0860
Investigation of potential effects of sleep on diffusion characteristics of metabolites and water: initial results1Depts. Radiology and Biomedical Research, University of Bern, Bern, Switzerland, 2Support Center for Advanced Neuroimaging, University Institute for Diagnostic and Interventional Neuroradiology, Bern, Switzerland, 3Sleep-Wake-Epilepsy-Center, University Hospital Bern, Bern, Switzerland, 4Dept. of Neurology, University Hospital Inselspital Bern, Bern, Switzerland
Synopsis
Diffusion-weighted MR spectroscopy (DW-MRS) and imaging (DW-MRI) was applied to investigate potential effects of sleep on apparent diffusion coefficients (ADCs) of water and metabolites in human gray matter in 7 healthy subjects. Monitoring the transition from wake to sleep for a period of 4 hours did not reveal any significant alterations, while comparison of night measurements after slight sleep deprivation to morning examinations after a full night’s sleep indicated that ADCs for some metabolites are lower in the morning than before sleep – though these results need corroboration in a larger cohort.
Introduction
Sleep is vital for all mammals, but still contested in its functionality1. Recent results suggest that sleep promotes brain detoxification through the glymphatic-system by altering the intra-/extra-cellular volume fractions2. We hypothesized that this structural change should affect the apparent diffusion coefficient (ADCs) of water, but possibly also the metabolites. Since metabolites probe intracellular space only and are partially specific to neuronal (e.g. glutamate, NAA) or glial (e.g. myo-inositol, cholines) cells3 their ADCs could serve as a cell-specific probe to investigate sleep-related or diurnal microstructural changes. The aim of this study was to examine if DW-MRS at long diffusion times (TDs) is sensitive to sleep/wake related structural changes in human brain.Methods
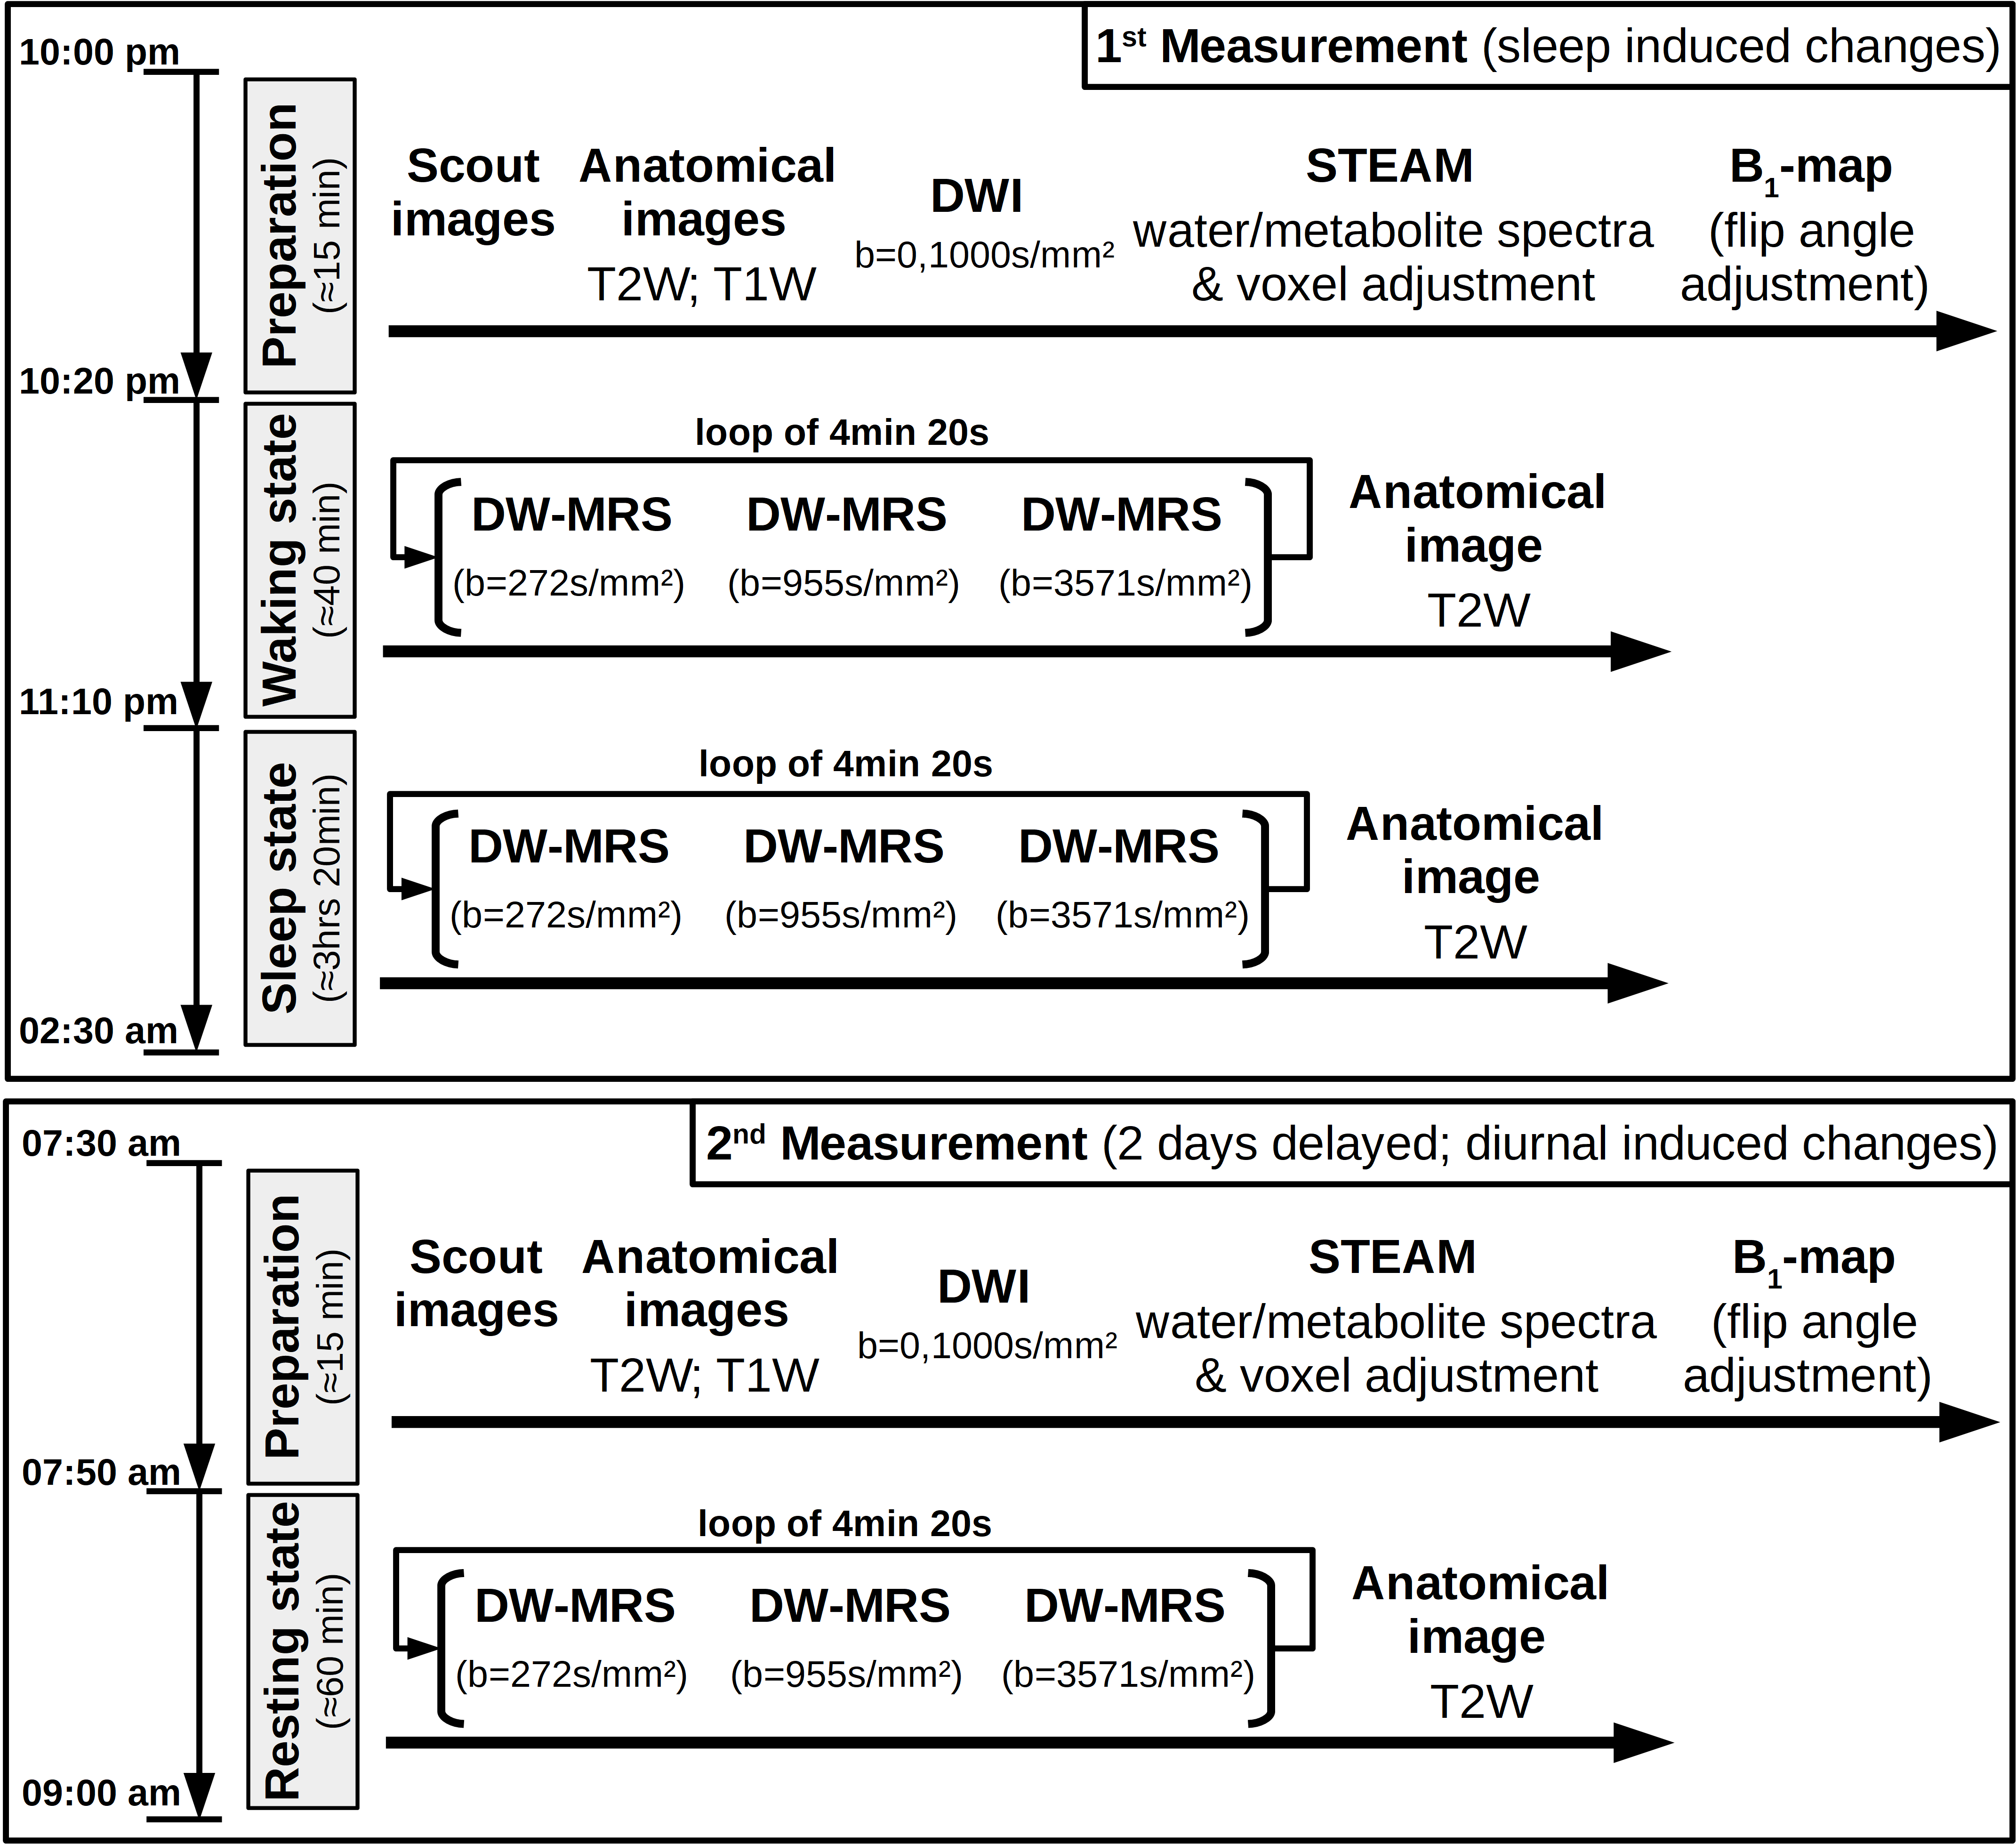
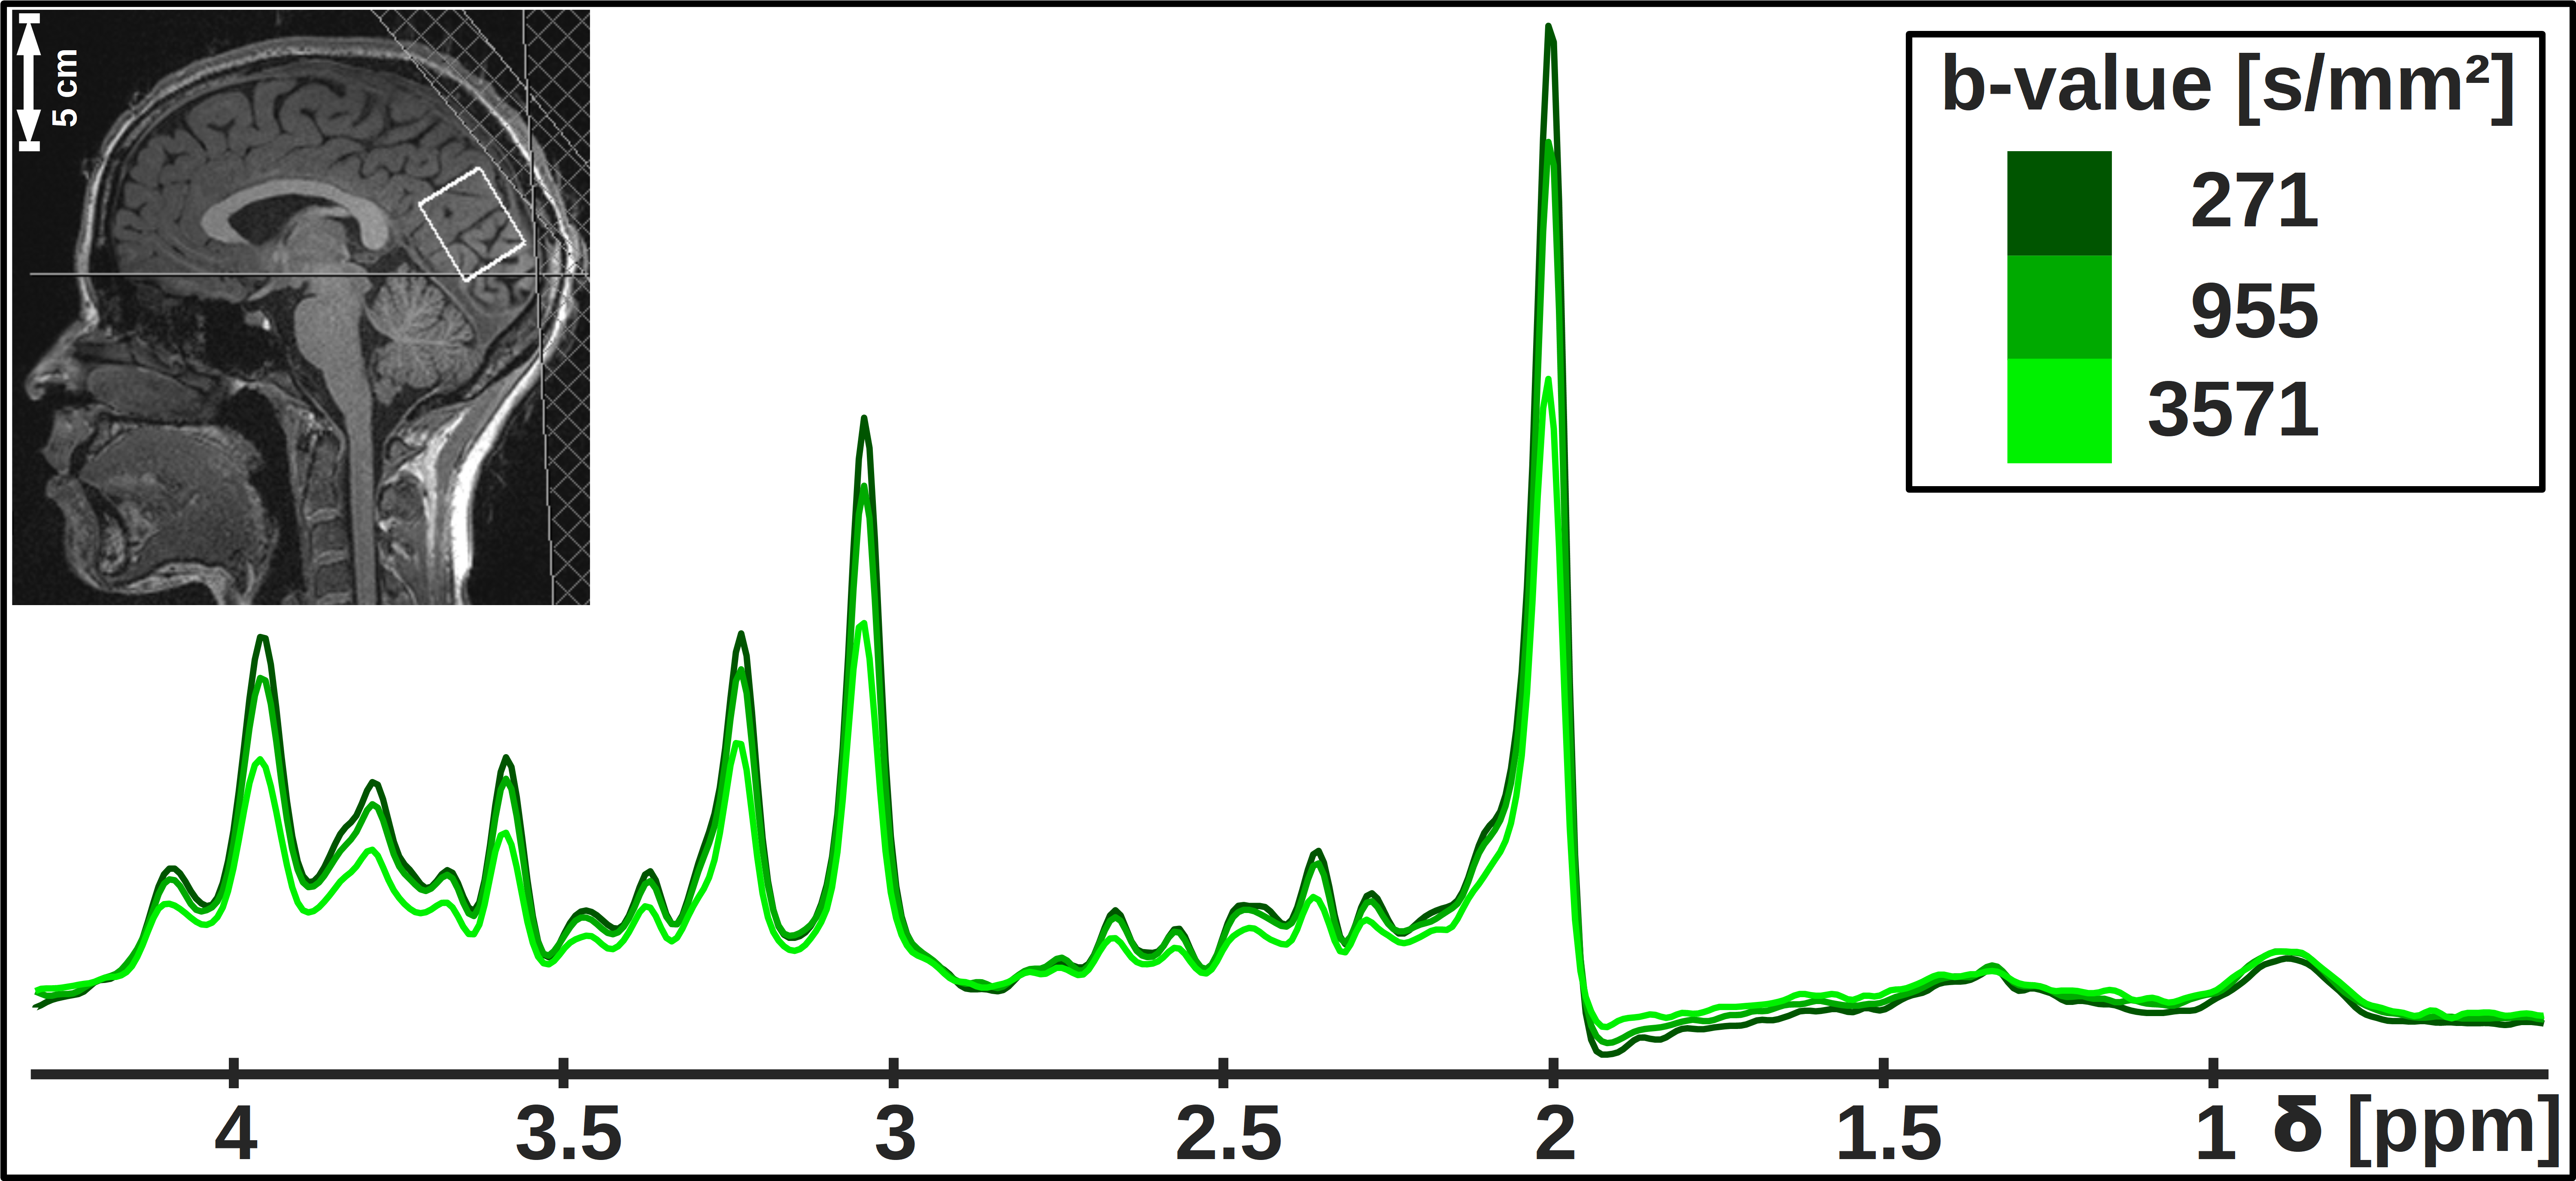
Study design: Seven healthy subjects with no sleep complaints as assessed by questionnaires4–6 were measured in two MR-sessions spaced by two days (cf. Fig. 1). The first session, starting at 10pm with volunteers in a partial sleep-deprived state (17hrs awake) after a maximum of 6hrs sleep in the previous night, lasted 4hrs, where the volunteers stayed awake during the first hour (controlled by finger responses upon oral stimuli) and were allowed to sleep in the remaining time. The exact sleep onset is unknown, since the simultaneously recorded EEG proved to be too noisy. However, the presence of sleep was judged based on characteristics like snoring, rhythmic breathing and heart-rate, and statements of subjects after measurements. After 2 days under normal daily rhythm and sufficient sleep, the second scan started at 7.30am. The voxel was automatically relocated to the same position using Siemens’ auto-align procedure.DW-MRS & DW-MRI: Measurements were performed on a 3T Siemens scanner using a 20-channel headcoil. A metabolite-cycled STEAM sequence was used to record non-water-suppressed diffusion spectra in occipital-parietal gray matter with water-selective FLAIR (TI/TE/TM/TR= 1200/36/150/4000ms) at TD=170ms7 (Fig. 2). The ADC acquisitions were split into blocks of 4:30min (Fig. 1) with three b-values of 270, 960 and 3570s/mm² and 16-32 acquisitions each. The inherent water reference was used for frequency, phase, eddy-current correction and motion-compensation7. A monopolar DW-MRI sequence at b=0, 1000s/mm² was applied for comparison (Fig. 1).
Modeling: Spectra were fitted with FiTAID simultaneously imposing a mono-exponential DW signal decay together with a spectral linear-combination-model8,9. The non-mono-exponential signal decay of water was represented by a kurtosis model and fitted in MatLab. Water mean diffusivities (MD) from DW-MRI were calculated as median of all pixels from segmented brain areas. The time course of ADC-values during the first session was analyzed by linear regression to probe for changes in transition from wake to sleep. Night/morning changes were tested for with paired t-tests.
Results and Discussion
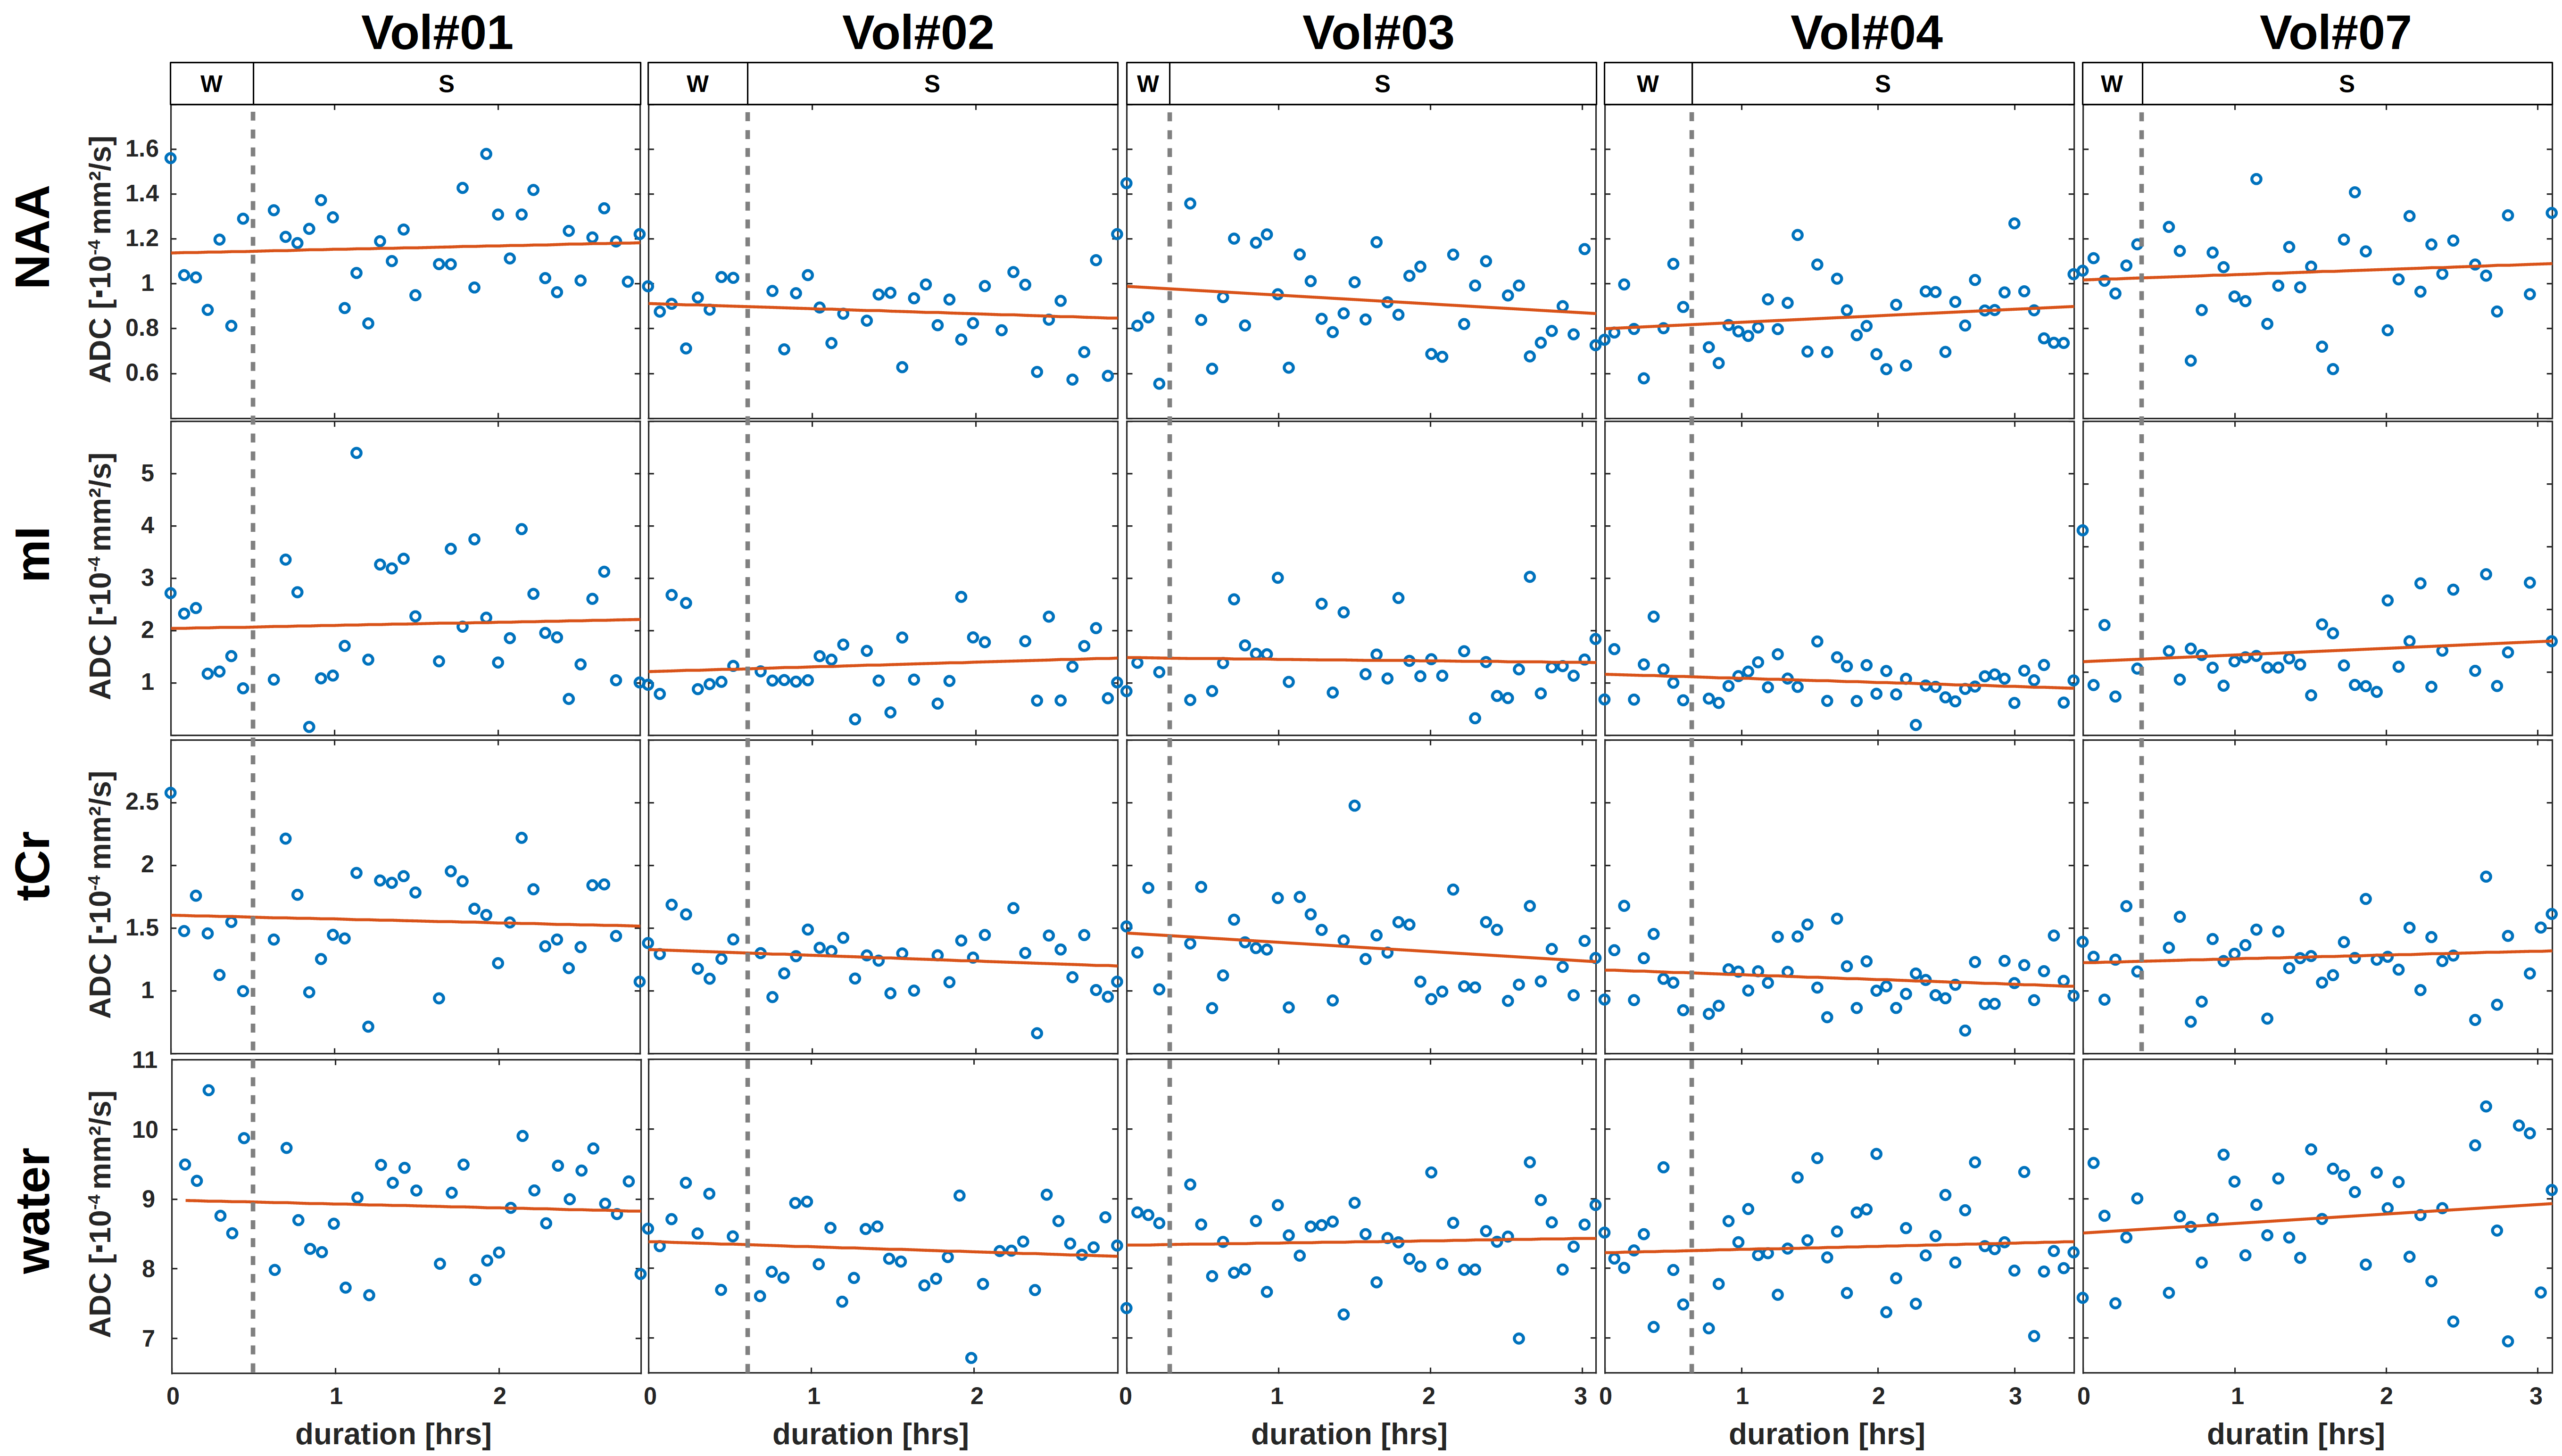
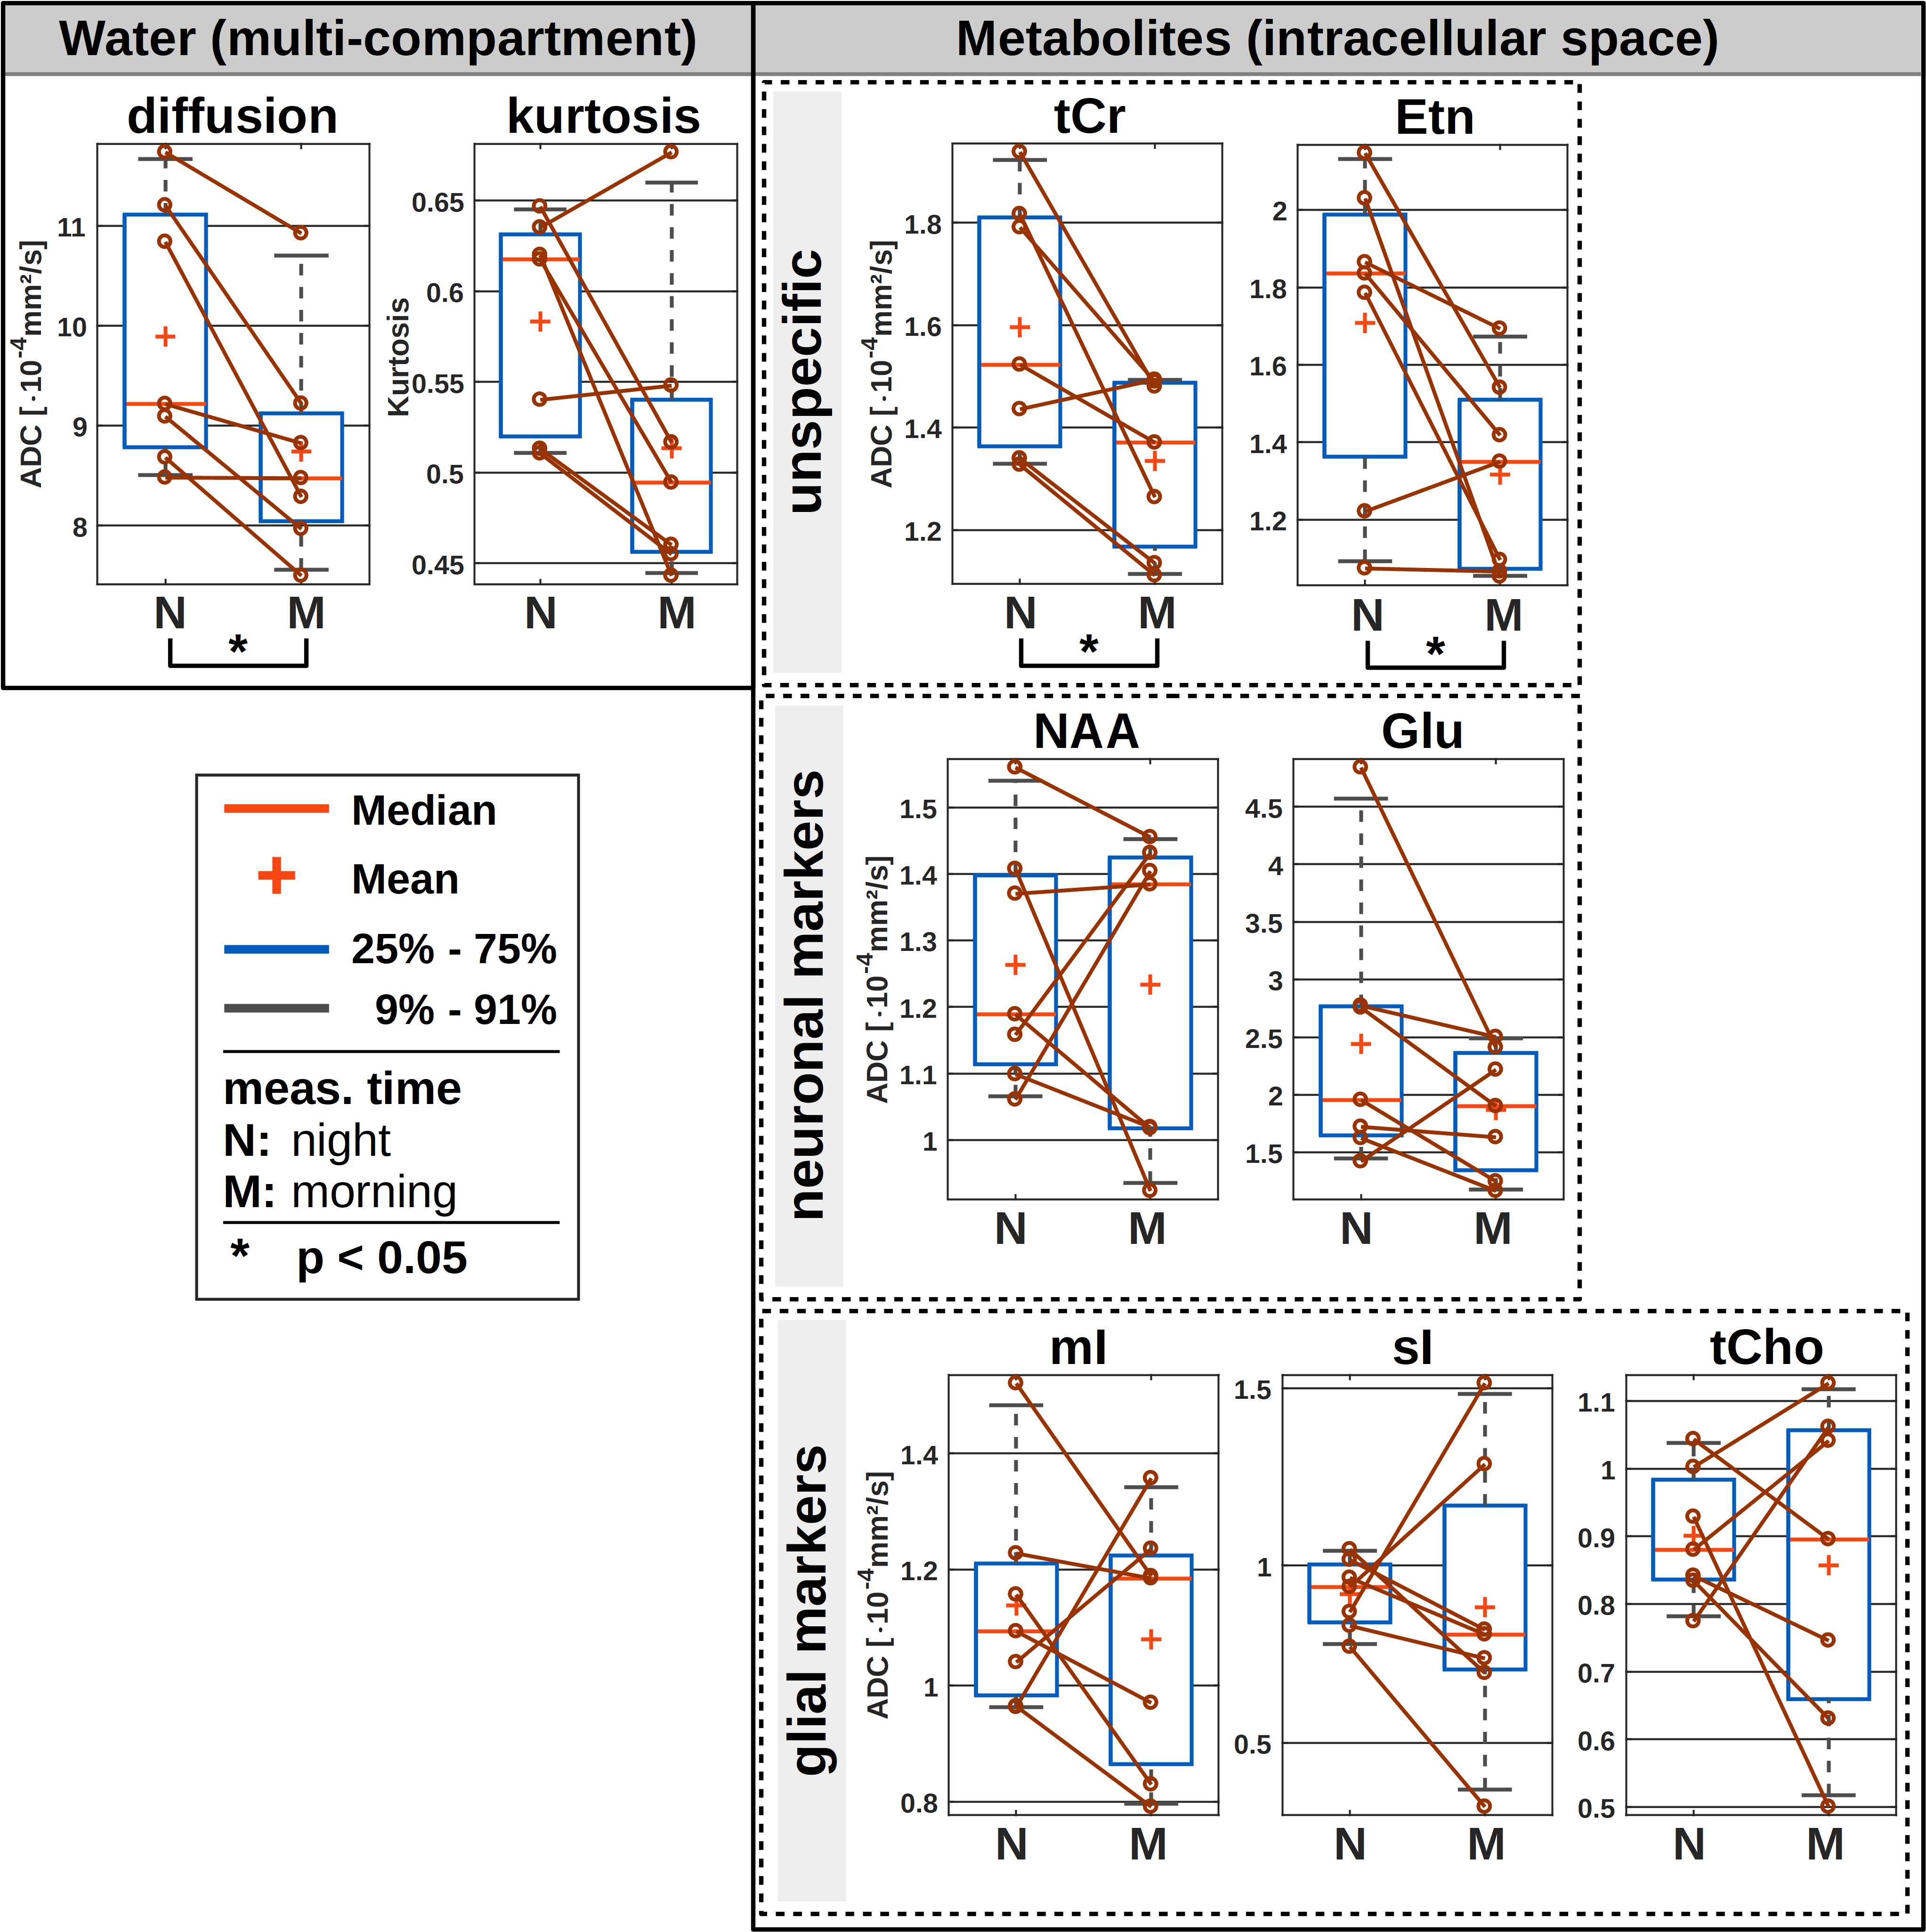
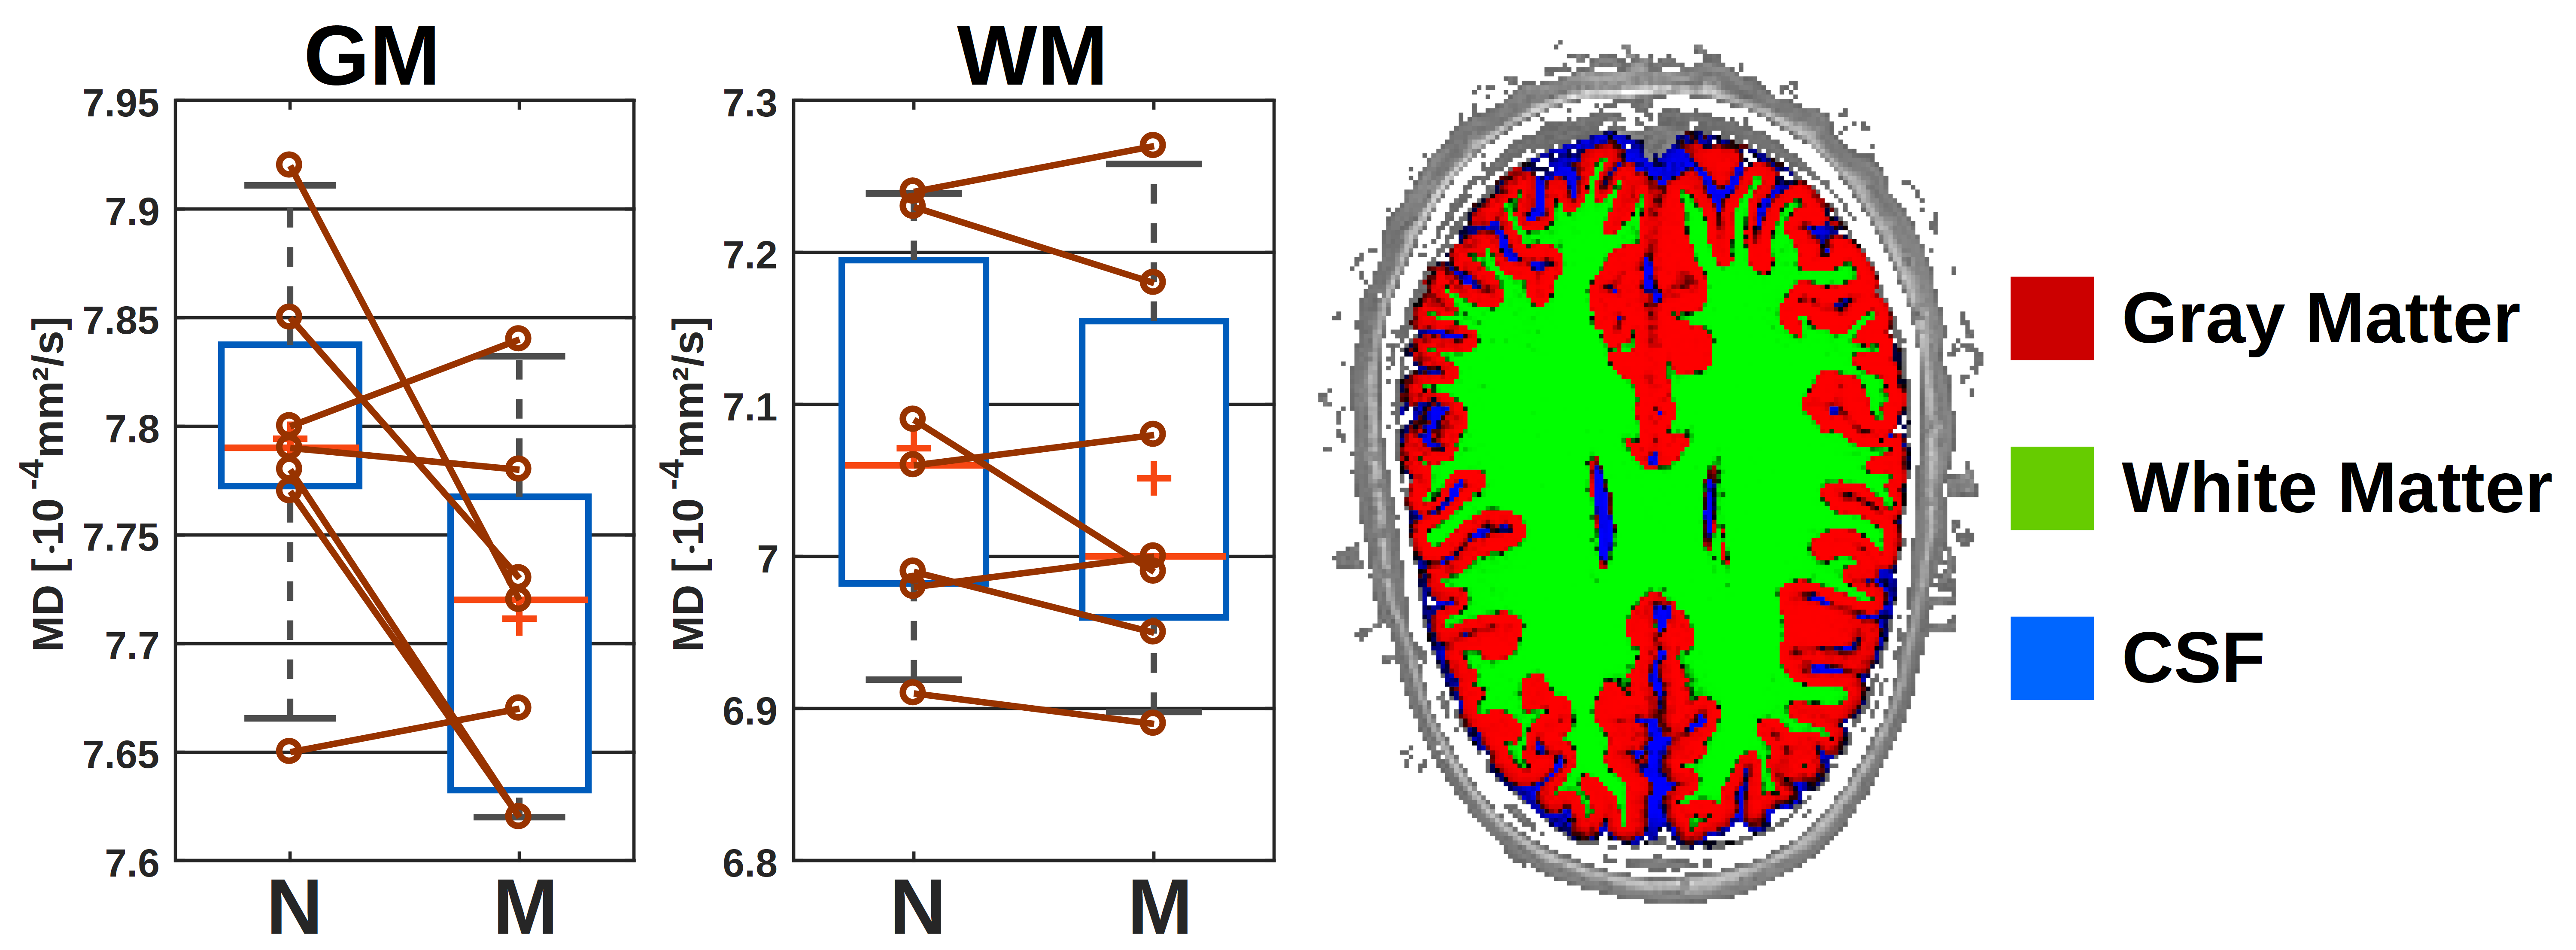
The results of the wake/sleep transition analysis are presented in Fig. 3 for the 5 subjects that were able to sleep in the first session. The time-series in Fig. 3A shows no trend to either negative or positive correlation with time for water or any metabolite.The diurnal ADC results for all subjects are presented in Fig. 4. The ADC values are significantly different (though without Bonferroni correction) between night and morning for ADCs of water, creatines and ethanolamine (Etn). For all subjects, all water ADCs are lower in the morning, while for tCr and Etn one subject shows reverse behavior (Glutamate with the same trend but with p>0.05). The same trend to lower MDs in the morning is observed by DW-MRI for GM (Fig. 5).
Night to morning changes in water ADCs have been reported before for studies using DW-MRI and region-based analysis. However, in contrast to the present results water diffusion was found to be faster in the morning12–13. Whether differences in results are due to technical reasons (choice of b-values, echo time, motion compensation), compartment effects (large voxel vs. adapted region in post-processing, CSF-suppression in MRS) or brain region is currently unclear.
In terms of metabolites, there are no previous reports and the number of subjects is still too small to draw final conclusions. However, given a missing uniform trend for the majority of metabolites or metabolites from a certain cell-type it seems safe to conclude that there is no reciprocal volume effect for intra-cellular space matching an expanded/decreased extracellular space (in line with results suggesting volume shifts from parenchymal space to CSF14). The significant effect for the creatines - if corroborated - may be related to the particular function and binding of these energy-related metabolites.
For the spectra recorded at night, reanalysis with reduced time resolution may be beneficial to improve the motion-compensation scheme and variance due to noise. Remarkably, averaged spectra in sleep and during wake show very stable results for macromolecules and prove overall stability of the scans. In addition, the long TD incurs ADCs to mostly sense diffusion along fiber bundles with limited sensitivity to changes of other cellular confinements. Measurements at shorter TD15 might shed more light on the nature of the diffusion alterations.
Conclusion
Metabolite-cycled DW-MRS and DW-MRI was performed to investigate sleep/wake and diurnal changes in diffusion constants of water and metabolites. Initial results suggest alterations for water and some metabolites, but need corroboration.Acknowledgements
This work is supported by the Swiss National Science Foundation (SNSF #320030‐175984).References
1. Rasch B and Born J. About Sleep’s Role in Memory. Physiol Rev 2013, 93:681–766.
2. Xie L, et al. Sleep drives metabolite clearance from the adult brain. Science 2013, 342:373–377.
3. Choi JK, Dedeoglu A and Jenkins BG. Application of MRS to mouse models of neurodegenerative illness. NMR Biomed 2007, 20:216–237.
4. Allen RP, et al. Restless legs syndrome: diagnostic criteria, special considerations, and epidemiology. Sleep Med 2003, 4:101–119.
5. Thurtell MJ, Bruce BB, Rye DB, Newman NJ and Biousse V. The Berlin Questionnaire Screens for Obstructive Sleep Apnea in Idiopathic Intracranial Hypertension. J Neuro-Ophthalmology 2011, 31:316–319.
6. Morin CM, Belleville G, Bélanger L and Ivers H. The Insomnia Severity Index: psychometric indicators to detect insomnia cases and evaluate treatment response. Sleep 2011, 34:601–608.
7. Döring A, Adalid V, Boesch C and Kreis R. Diffusion-weighted magnetic resonance spectroscopy boosted by simultaneously acquired water reference signals. Magn Reson Med 2018, 80:2326–2338.
8. Adalid V, et al. Fitting interrelated datasets: metabolite diffusion and general lineshapes. MAGMA 2017, 30:429–448.
9. Chong DGQ, Kreis R, Bolliger CS, Boesch C and Slotboom J. Two-dimensional linear-combination model fitting of magnetic resonance spectra to define the macromolecule baseline using FiTAID, a Fitting Tool for Arrays of Interrelated Datasets. MAGMA 2011, 24:147–164.
10. Soher B, Semanchuk P, Todd D and Young K. Vespa: Versatile Simulation, Pulses and Analysis for MR Spectroscopy. 2017. Available at: http://scion.duhs.duke.edu/vespa/.
11. Ligneul C and Valette J. Probing metabolite diffusion at ultra-short time scales in the mouse brain using optimized oscillating gradients and ‘short’-echo-time diffusion-weighted MRS. NMR Biomed 2017, 30:e3671.
12. Bernardi G, et al. Sleep reverts changes in human gray and white matter caused by wake-dependent training. Neuroimage 2016, 129:367–377.
13. Jiang C, Zhang L, Long X, Liao W and Huang W. VBM study of Diurnal Variations of Brain Diffusion in Healthy Adults. Biol Rhythm Res 2012, 20:20972.
14. Trefler A, Sadeghi N, Thomas AG, Pierpaoli C, Baker CI and Thomas C. Impact of time-of-day on brain morphometric measures derived from T1-weighted magnetic resonance imaging. Neuroimage 2016, 133:41–52.
15. Döring A and Kreis R. Magnetic resonance spectroscopy extended by oscillating diffusion gradients: Cell-specific anomalous diffusion as a probe for tissue microstructure in human brain. Neuroimage 2019, 202:116075.
Figures