0858
B-tensor encoding in gliomas: improved tumor grading by the isotropic kurtosis1Clinical Sciences Lund, Medical Radiation Physics, Lund University, Lund, Sweden, 2Department of Radiology, Brigham and Women's Hospital, Boston, MA, United States, 3Harvard Medical School, Boston, MA, United States, 4Clinical Sciences Lund, Diagnostic Radiology, Lund University, Lund, Sweden, 5Dept. of Translational Medicine, Division of Medical Radiation Physics, Lund University, Lund, Sweden, 6Clinical Sciences Lund, Neurology, Lund University, Lund, Sweden, 7Russell H. Morgan Department of Radiology and Radiological Science, Johns Hopkins University School of Medicine, Baltimore, MD, United States, 8Lund University Bioimaging Center, Lund University, Lund, Sweden
Synopsis
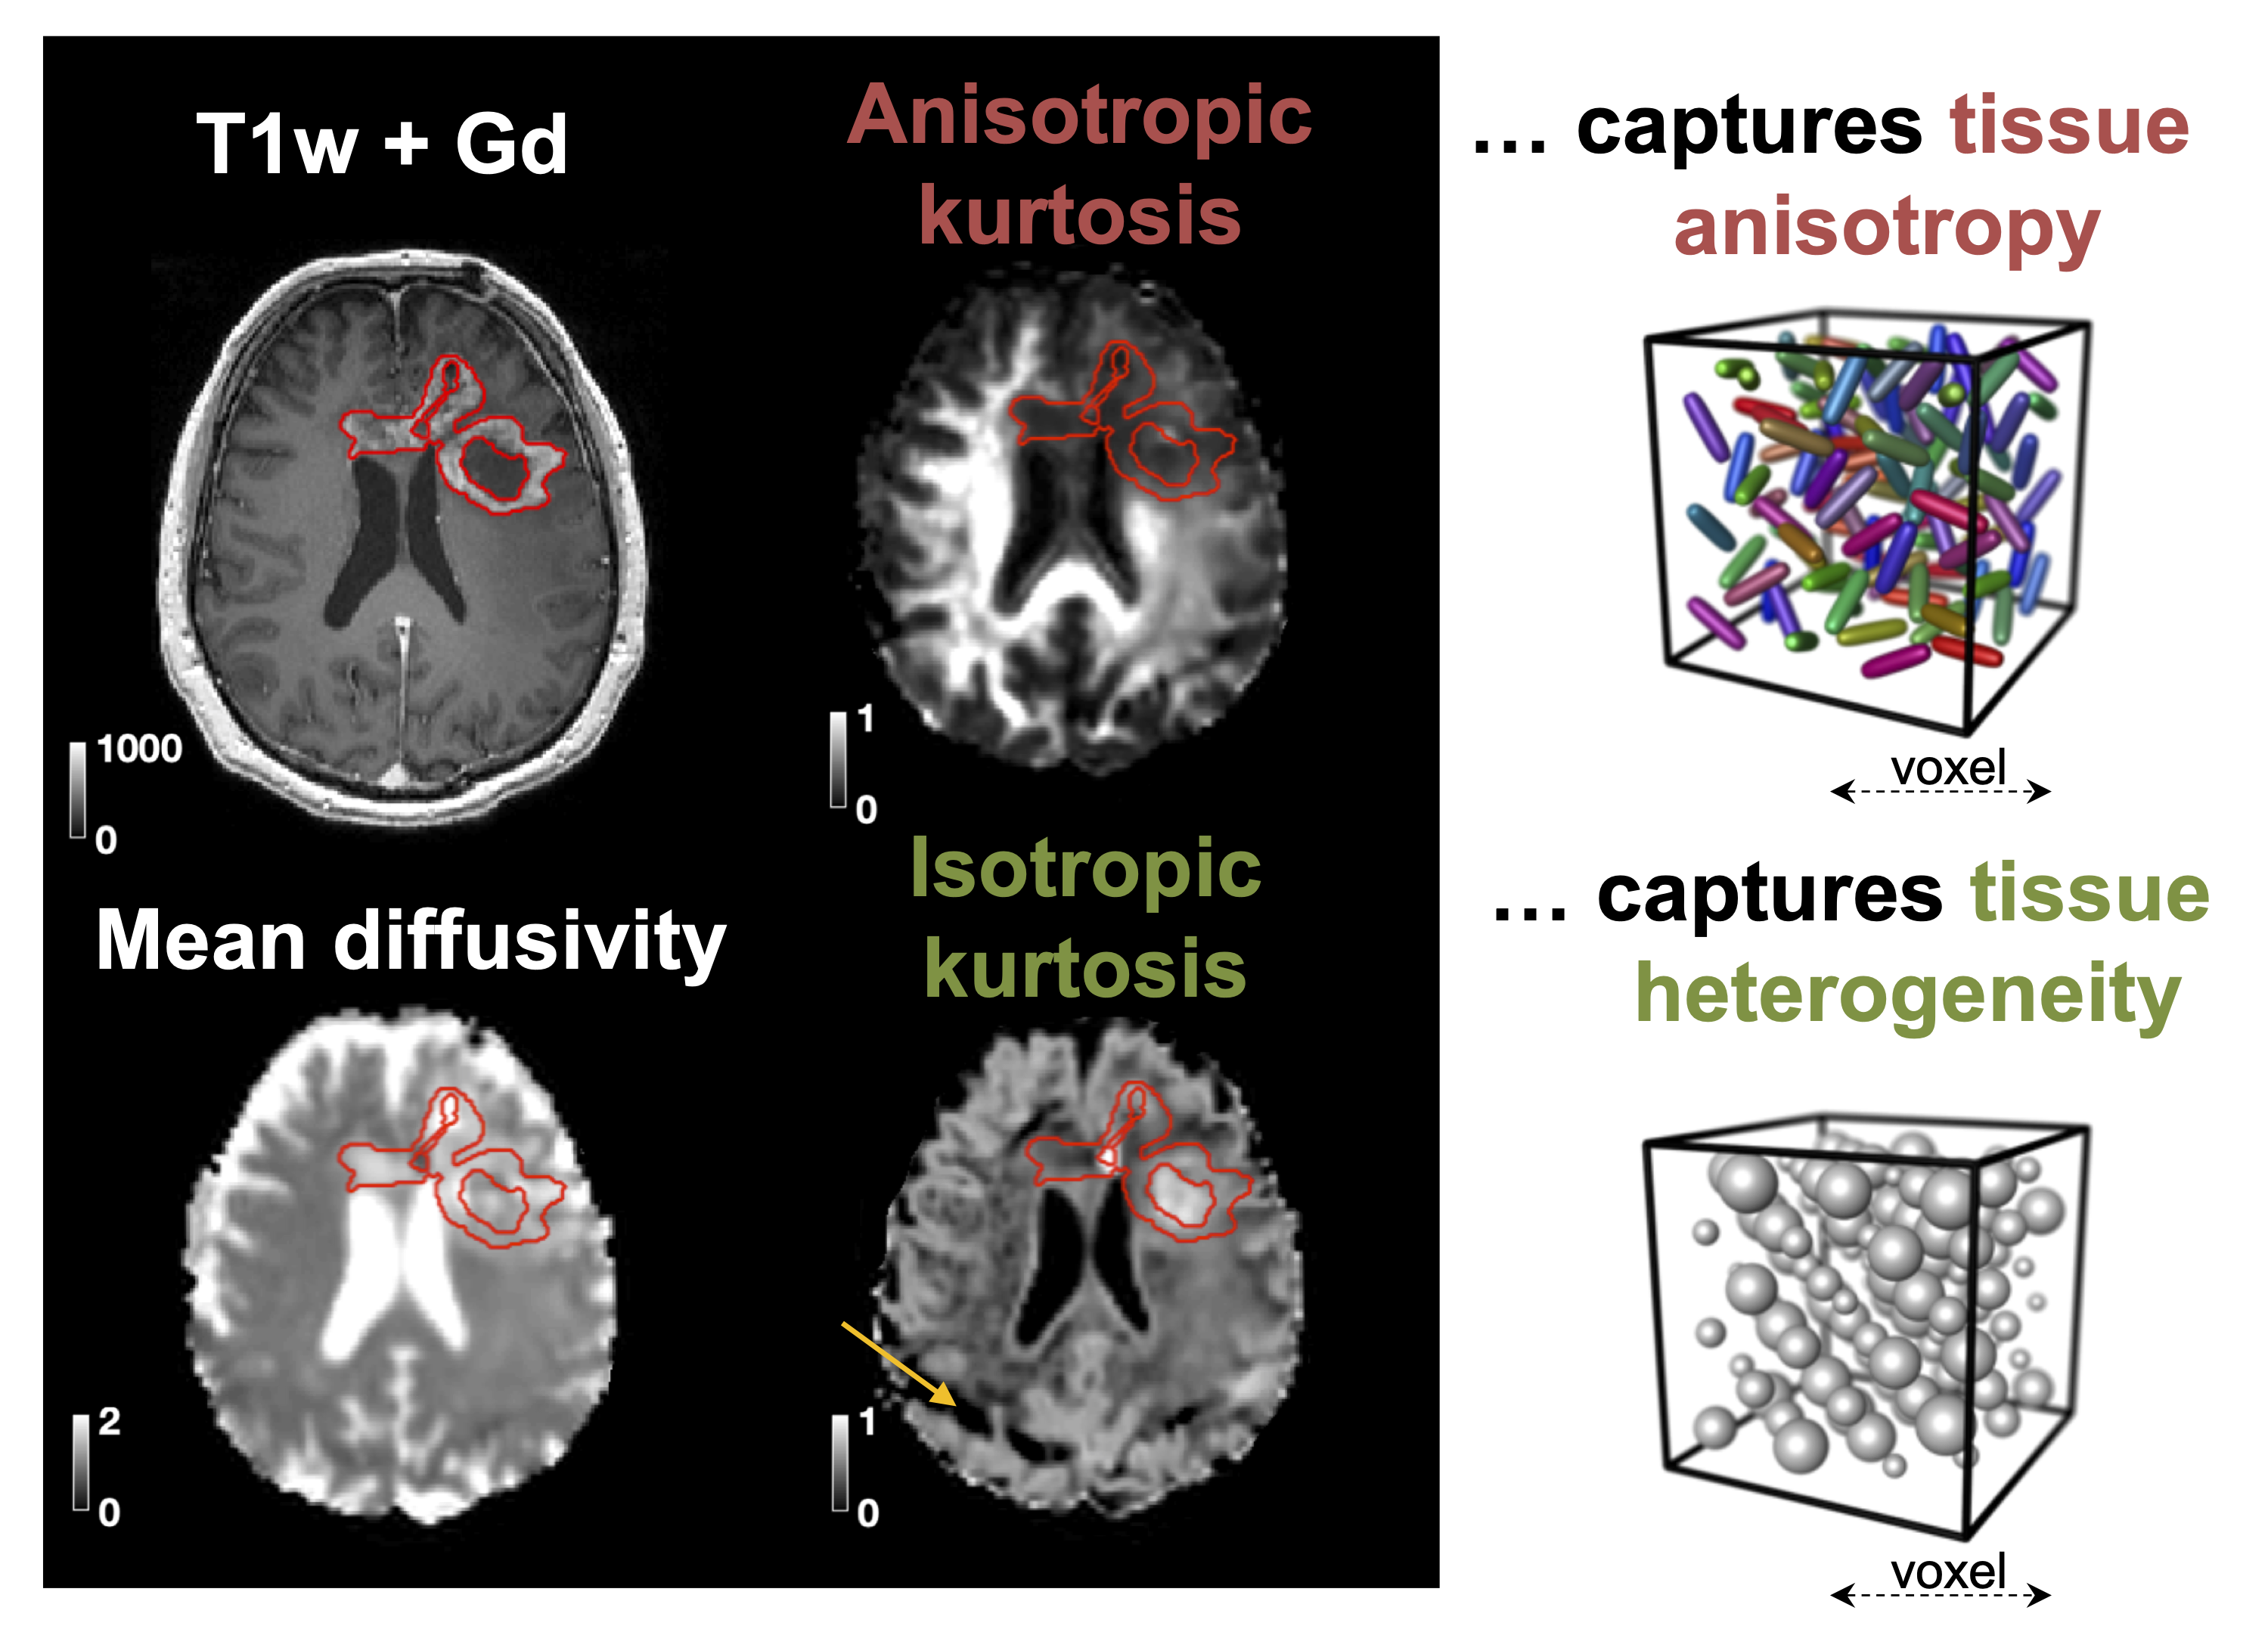
B-tensor encoding enables mapping of the isotropic and anisotropic components of the diffusional kurtosis, which are sensitive to cell eccentricity and variance in cell density, respectively. We measured the kurtosis components in patients with glioma tumors and explored their ability to improve tumor classification. Results showed that the addition of isotropic kurtosis improves the ability to distinguish low- and high-grade gliomas compared with using post-Gd T1w enhancements alone. Also, non-enhancing glioblastomas and oligodendrogliomas could be distinguished based on the within-tumor standard deviation of the isotropic kurtosis.
Introduction
Gliomas stem from glial cells and are the most common malignant brain tumors. Their radiological classification relies predominantly on the presence of post-contrast gadolinium (Gd) enhancement on T1w images. This approach has limited sensitivity and specificity, since not all enhancing tumors are high-grade and not all non-enhancing tumors are low-grade [1]. The aim of this study was to investigate whether glioma classification can be improved by b-tensor encoding, which is a novel diffusion MRI (dMRI) technique that permits separation of the isotropic and anisotropic components of the diffusional kurtosis [2,3].Methods
25 patients with glioma tumors were scanned on MAGNETOM Prisma 3T system (Siemens Healthcare, Erlangen, Germany) with a prototype diffusion-weighted spin-echo sequence that allows b-tensor encoding, using TR/TE=5300/80 ms, resolution=2.3×2.3×2.3 mm3, iPAT=2, partial-Fourier=6/8, two b-tensor shapes (linear and spherical) and four equidistant b-values between 0.1 and 2.0 ms/μm2 [5]. The mean diffusivity (MD), anisotropic kurtosis (MKA) and isotropic kurtosis (MKI) were obtained by fitting the signal equation [2-5]: $$\mathrm{S}(b,b_{\mathrm{\Delta}})=\mathrm{exp}(-b\mathrm{MD}+b^2\mathrm{MD^2}\, \mathrm{MK_I/6}+b^2_{\mathrm{\Delta}}b^2\mathrm{MD^2}\,\mathrm{MK_A^2/6})$$ Data analysis was performed using the software available at https://github.com/markus-nilsson/md-dmri. Histological diagnosis was provided by a neuropathologist and an experienced neuroradiologist delineated the tumors on post-Gd T1w images and assessed post-Gd T1w images for enhancements and high values on MKI maps (referred to as MKI enhancements).Results
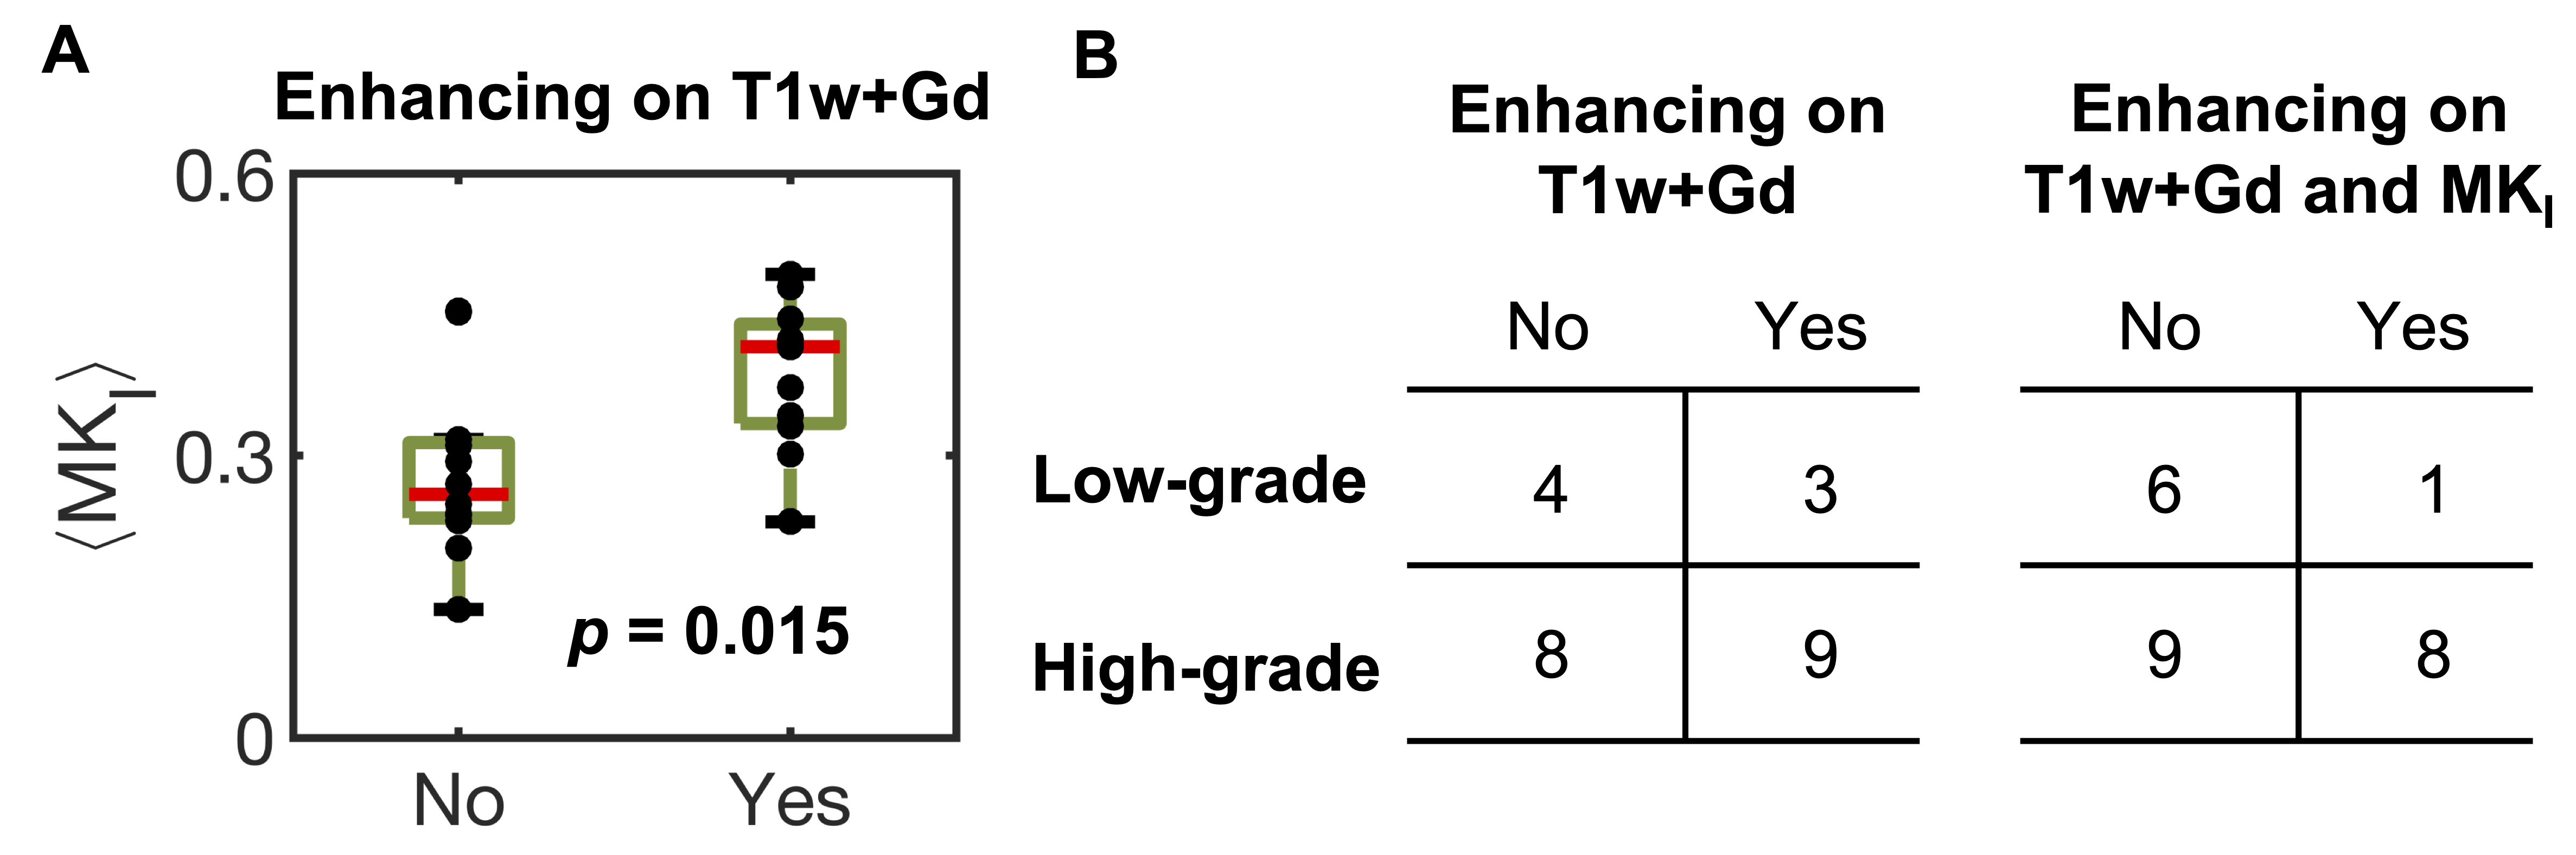
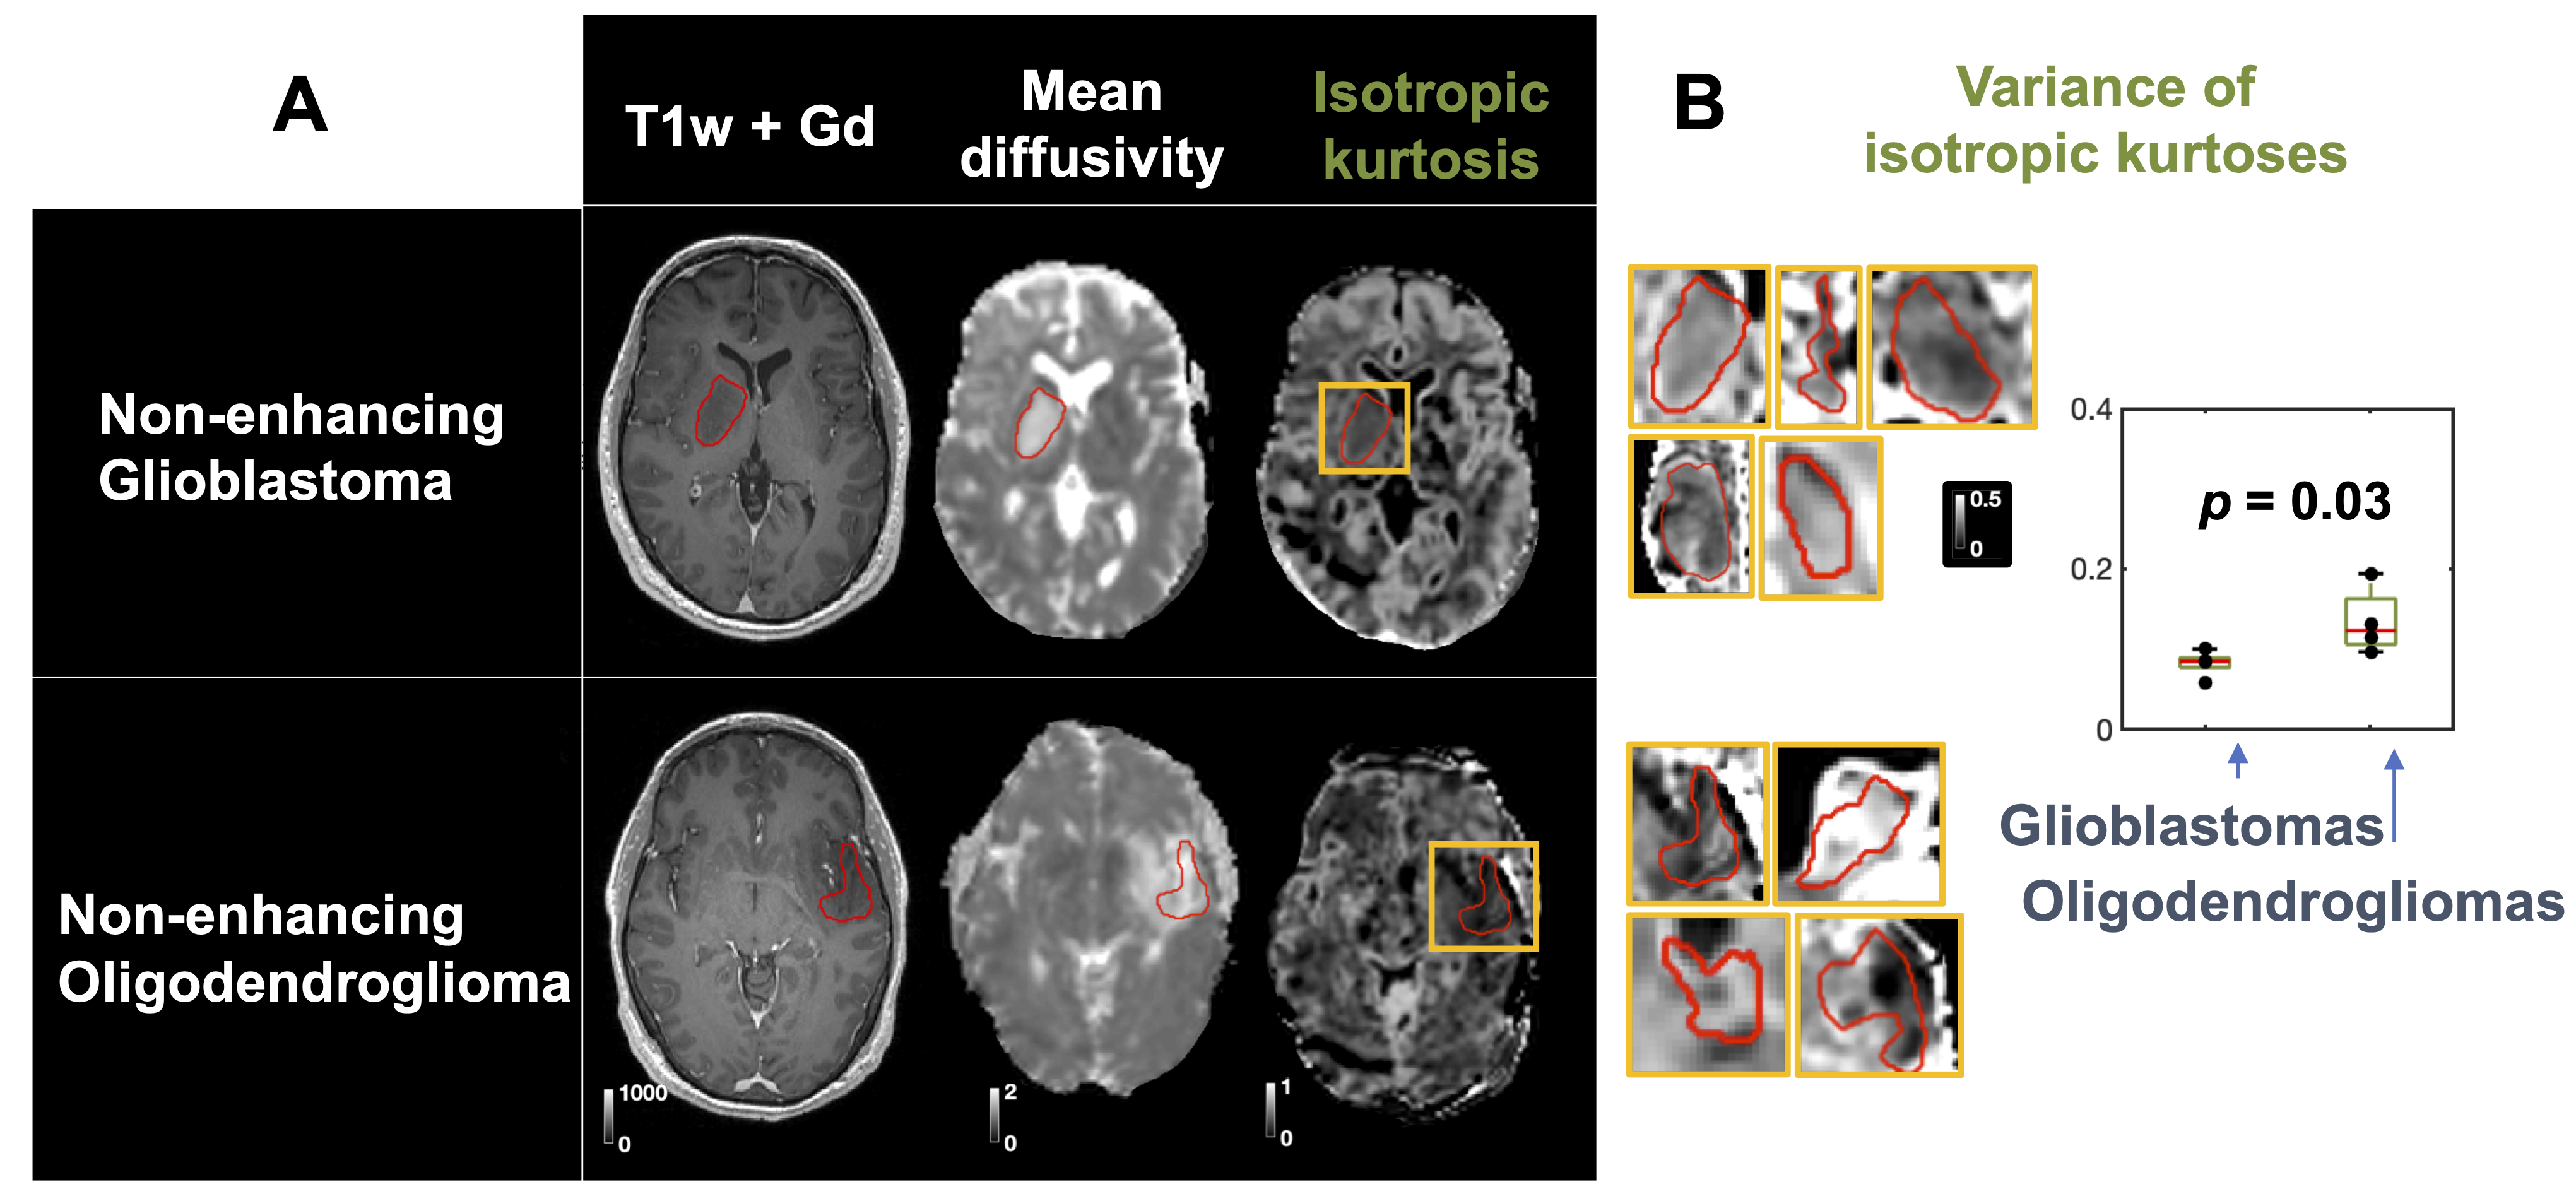
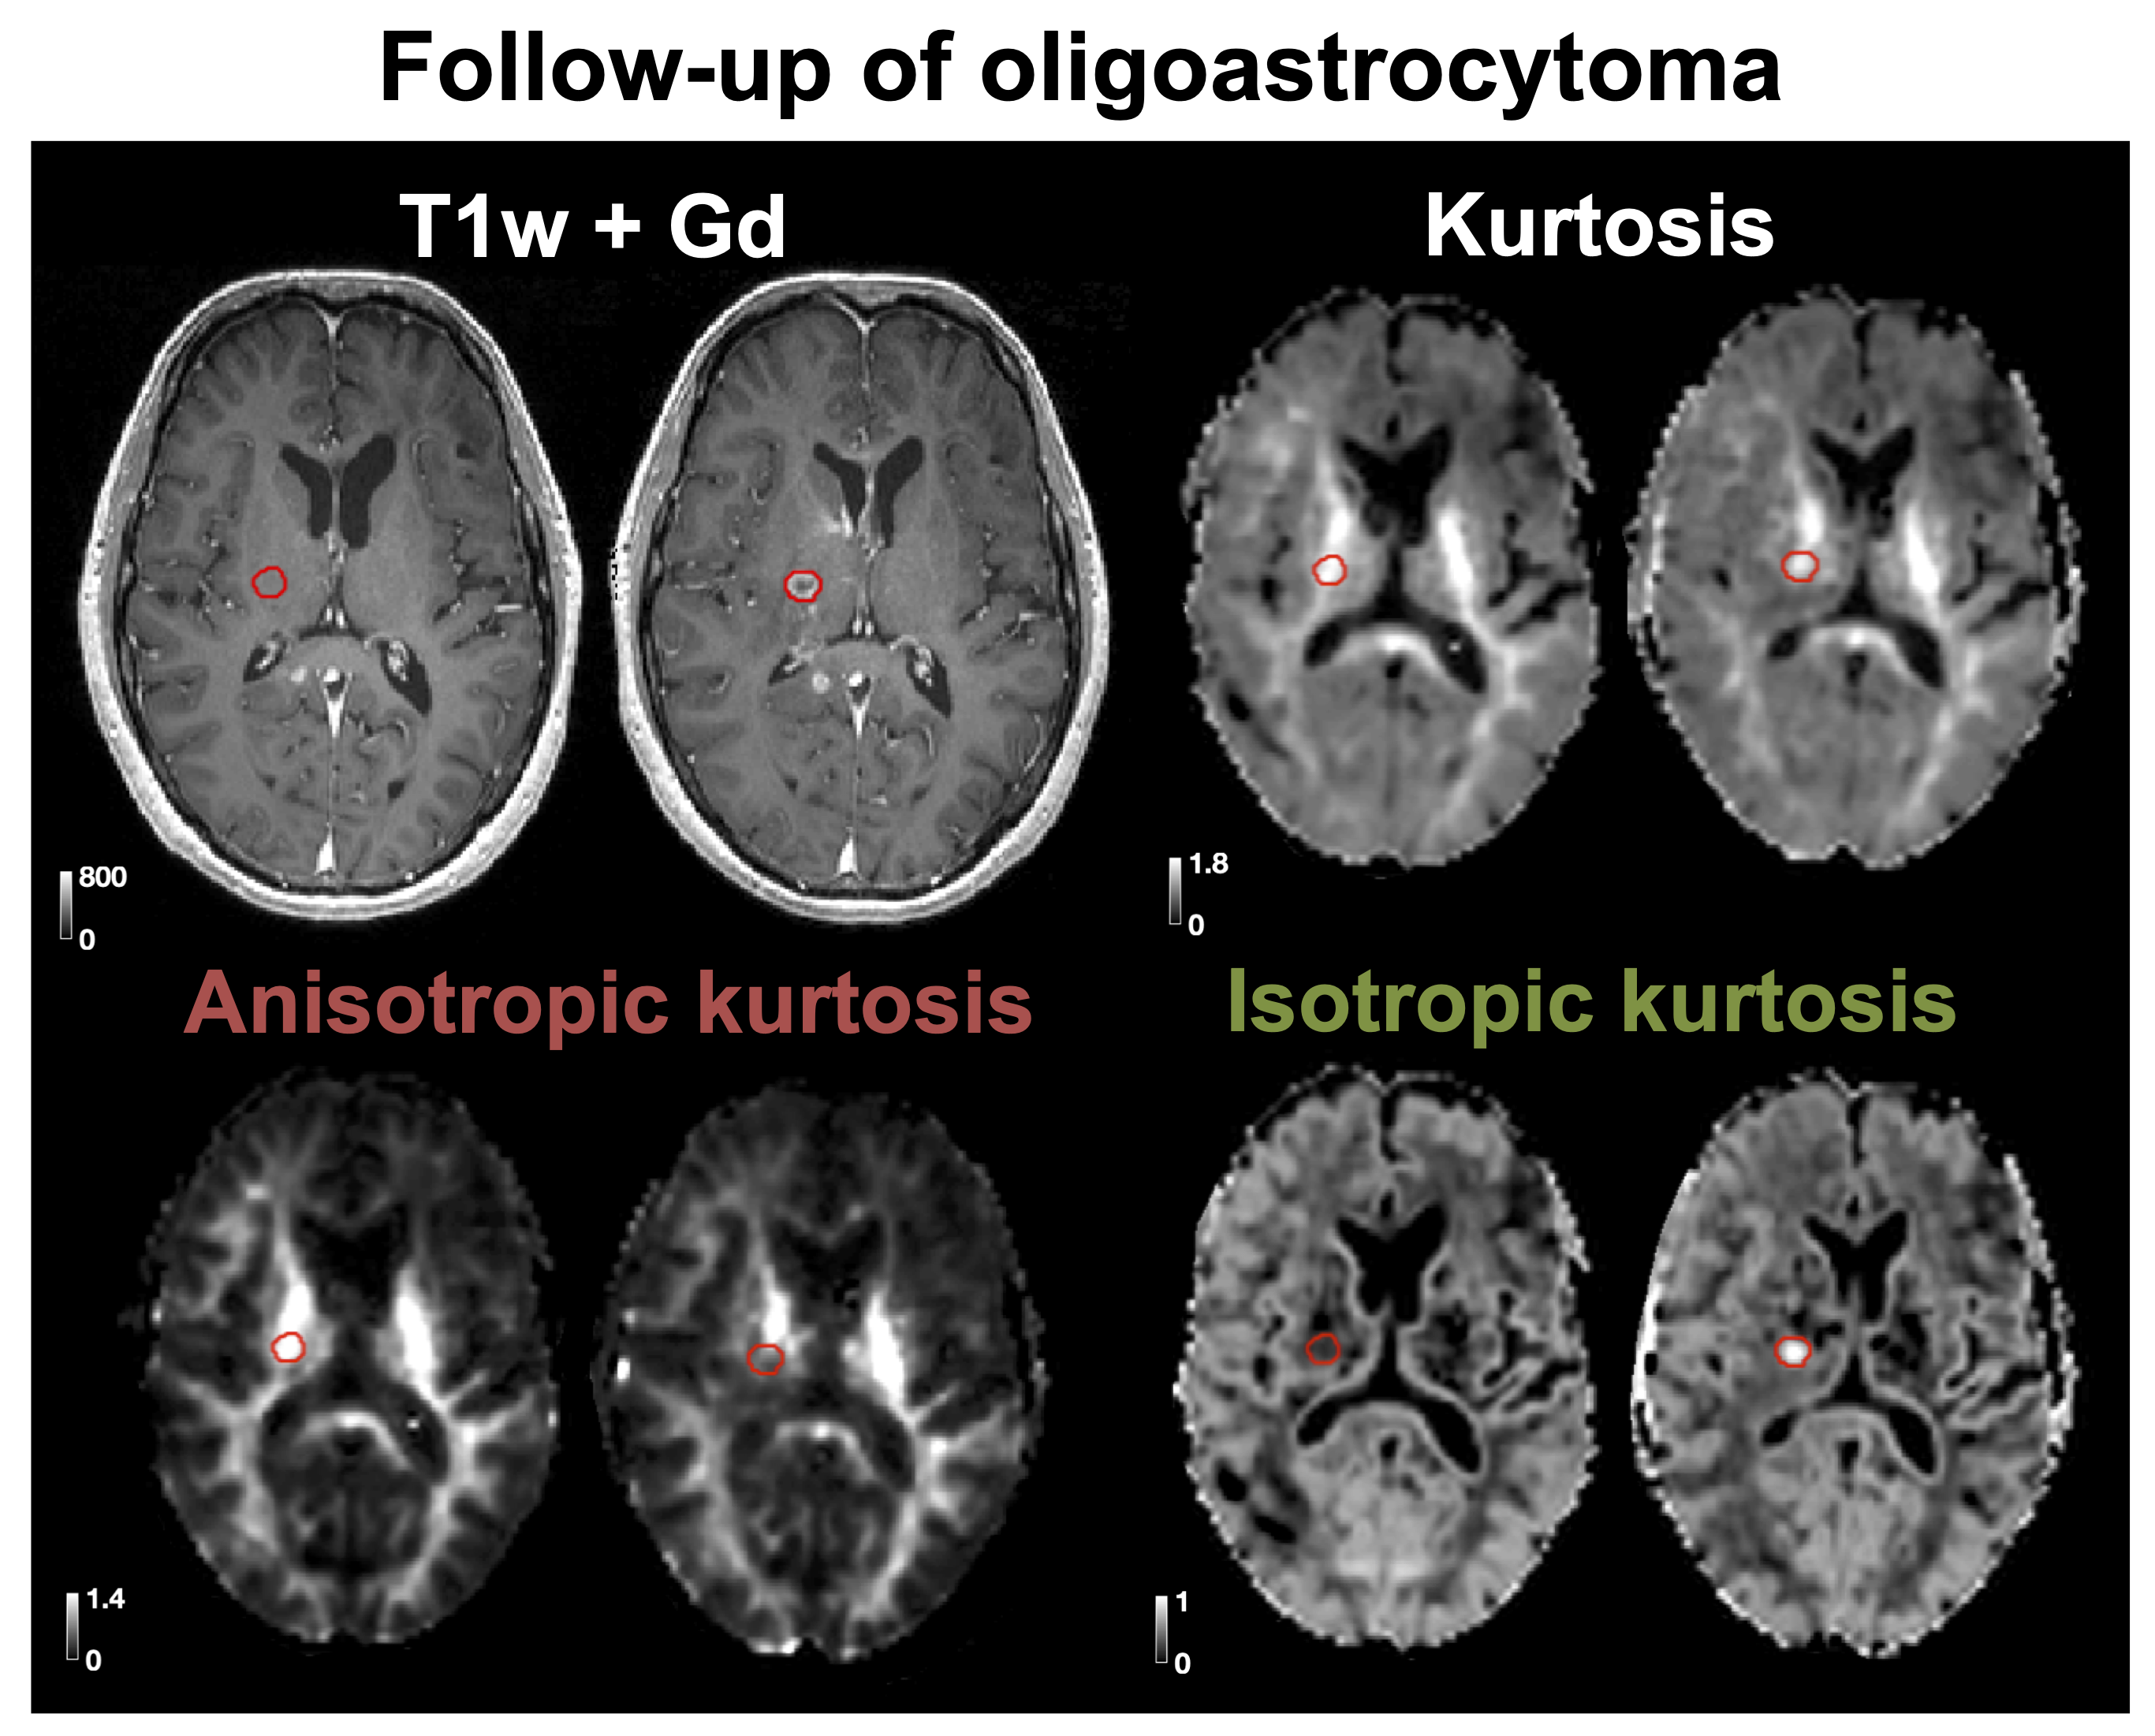
The 25 tumors were histopathologically diagnosed as 16 glioblastomas (WHO IV), 1 anaplastic astrocytoma (WHO III), 1 metastasis (adenocarcinoma of gastrointestinal origin), 4 oligodendrogliomas (WHO II), 2 diffuse astrocytomas (WHO II) and 1 oligoastrocytoma (WHO II). Contrast enhancement was related to the presence of high MKI values (Figure 1 shows an example). Gliomas enhancing on post-Gd T1w images exhibited higher MKI compared with non-enhancing gliomas (p = 0.015; U-test; Figure 2A, 89 % of MKI enhancing gliomas were also post-Gd T1w enhancing). Simultaneous enhancement on both maps was indicative of high-grade gliomas (Figure 2B). Compared with using post-Gd T1w enhancement only, the specificity increased from 57 % to 86 %, although the sensitivity decreased from 53 % to 47 %. Furthermore, the MKI could differentiate between non-enhancing oligodendrogliomas (WHO II) and non-enhancing glioblastomas (WHO IV). These tumors were similar on the mean diffusivity map but differed in the spatial heterogeneity of the MKI maps (Figure 3A; red ROIs in the yellow rectangles). Part B shows the corresponding tumor regions of all samples and that the within-tumor standard deviations of MKI differed between the tumors (p = 0.03; U-test). Finally, Figure 4 exemplifies how separation of the different kurtosis components may capture changes that are invisible in the total kurtosis.Discussion
Our primary finding was that high MKI values correlated with enhancement on post-Gd T1w images (Figure 2A). A potential clinical utility may be to avoid gadolinium administration for patients exhibiting MKI enhancements although this utility must be assessed in a larger cohort. Our second finding was that post-Gd and MKI enhancement, when considered together, can improve glioma grading (Figure 2B). The added specificity from combining post-Gd T1w and MKI maps can be understood in that they reflect independent tissue properties that are both typical for high-grade tumors, such as blood-brain barrier disruption and cell density variance, respectively. Our third finding was that MKI contributed to differentiating non-enhancing oligodendrogliomas (WHO II) from non-enhancing glioblastomas (WHO IV) based on its intra-tumor heterogeneity (Figure 3B). Our last finding was that disentangling diffusional kurtosis into its two components can be useful in lesions that have opposite effects on the anisotropic component (e.g. decrease) and isotropic component (e.g. increase) such as those that are located in white matter (Figure 4). The main limitation of this study is its exploratory nature and the limited number of patients in our cohort.Conclusions
B-tensor encoding may enable improve radiological classification of gliomas. As the sequence can be performed in just three minutes [6] and is available at common clinical MRI systems [7], the technique could be a promising clinical tool for facilitating prompt treatment decisions.Acknowledgements
We thank Siemens Healthcare for access to the pulse sequence programming environment and acknowledge funding grant from Swedish Research Council (2016-03443).References
[1] Scott, J.N., Brasher, P.M.A., Sevick, R.J., Rewcastle, N.B., Forsyth, P.A., 2002. How often are nonenhancing supratentorial gliomas malignant? A population study. Neurology 59, 947–949.
[2] Szczepankiewicz, Filip, et al. "Quantification of microscopic diffusion anisotropy disentangles effects of orientation dispersion from microstructure: applications in healthy volunteers and in brain tumors." NeuroImage 104 (2015): 241-252.
[3] Westin, Carl-Fredrik, et al. "Q-space trajectory imaging for multidimensional diffusion MRI of the human brain." NeuroImage 135 (2016): 345-362.
[4] Lasič, Samo, et al. "Microanisotropy imaging: quantification of microscopic diffusion anisotropy and orientational order parameter by diffusion MRI with magic-angle spinning of the q-vector." Frontiers in Physics 2 (2014): 11.
[5] Nilsson, Markus, et al. "An open-source framework for analysis of multidimensional diffusion MRI data implemented in MATLAB." Proc Intl Soc Mag Reson Med. Vol. 26. 2018.
[6] Nilsson, Markus, et al. " Tensor‐valued diffusion MRI in under 3 minutes: an initial survey of microscopic anisotropy and tissue heterogeneity in intracranial tumors." Magnetic resonance in medicine. 2020; 83: 608– 620.
[7] Szczepankiewicz, Filip, et al. "Tensor-valued diffusion encoding for diffusional variance decomposition (DIVIDE): Technical feasibility in clinical MRI systems." PloS one 14.3 (2019): e0214238.
Figures