0857
Short-range Tractography with high Throughput And Reproducibility (STTAR) characterized by FDT tracing and HDBSCAN clustering1Department of Radiology, Children's Hospital of Philadelphia, Philadelphia, PA, United States, 2Department of Bioengineering, School of Engineering and Applied Science, University of Pennsylvania, Philadelphia, PA, United States, 3Department of Radiology, Perelman School of Medicine, University of Pennsylvania, Philadelphia, PA, United States
Synopsis
Short-range association fibers (SAFs), linking adjacent cortical regions, are dominant in structural connectome and associated with autism and schizophrenia. However, SAFs are not well characterized due to challenges in high-throughput tracing of SAF with diffusion MRI and challenges of identifying and labeling reproducible SAFs. The vast amount of SAFs also make it difficult to delineate them. To meet these challenges, we established a protocol “STTAR” including high-throughput streamline tracing with a regularized FDT probabilistic tractography and semi-automatic identification of reproducible SAFs with novel HDBSCAN clustering. Newly identified reproducible SAFs and those consistently reported in the literature are also demonstrated.
Purpose
Short-range association fibers (SAFs), linking adjacent cortical regions, are dominant in structural connectome [1]. Hyper- and hypo-connectivity of SAFs are associated with autism [2] and schizophrenia [3,4], respectively. However, SAFs are not well characterized due to challenges in tracing with crossing fibers in diffusion MRI (dMRI) [1] and inter-subject variation [5]. Furthermore, some SAFs connecting the same pair of cortical regions are featured with different shapes, terminations, and functions [6,7]. With the vast amount of SAFs, traditional approach [8,9] for tracing long-range fibers is no longer suitable. To meet these challenges, this study aimed to establish a protocol “STTAR” (Short-range Tractography with high Throughput And Reproducibility) including high-throughput streamline tracing with a regularized FDT probabilistic tractography [10] and semi-automatic identification of reproducible SAFs with novel hierarchical density-based spatial clustering of applications with noise (HDBSCAN) [11]. In this abstract, the STTAR protocol, newly identified reproducible SAFs and those consistently reported in the literature are demonstrated. With STTAR, we will identify, map and label the whole brain reproducible SAFs as the anatomical reference for basic neuroscience and clinical research.Methods
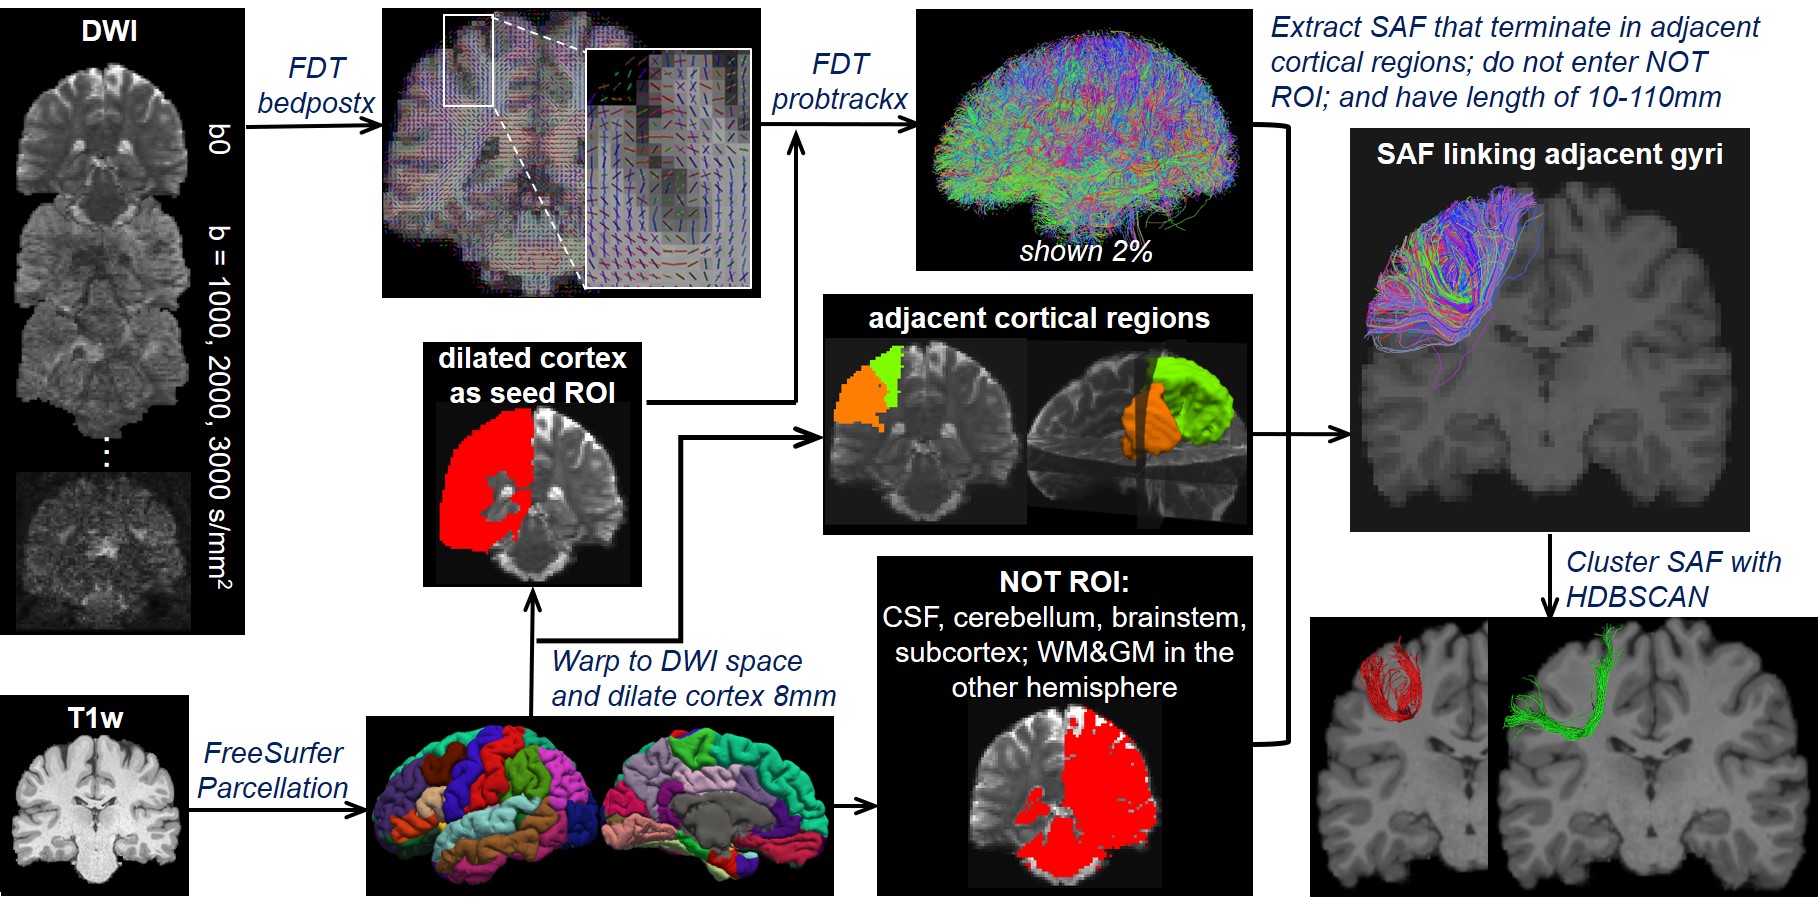
Overview of STTAR protocol (Figure 1): FreeSurfer-parcellated cortical regions from T1-weighted images (T1w) are co-registered into diffusion-weighted MRI (DWI) space and dilated as seed ROI. Probabilistic FDT streamline tracing is conducted on EPI-distortion corrected DWI. Streamlines that terminate in adjacent cortical regions are extracted and filtered with NOT ROI and length threshold of 10-110mm. SAFs connecting the same pairs of cortical regions are clustered via novel density-based HDBSCAN clustering. Details of tracing and clustering are explained below.Here, three subjects aged 22-25 years from HCP with multi-shell DWI were included, with 90 directions in each shell of b=1000,2000,3000 s/mm2.
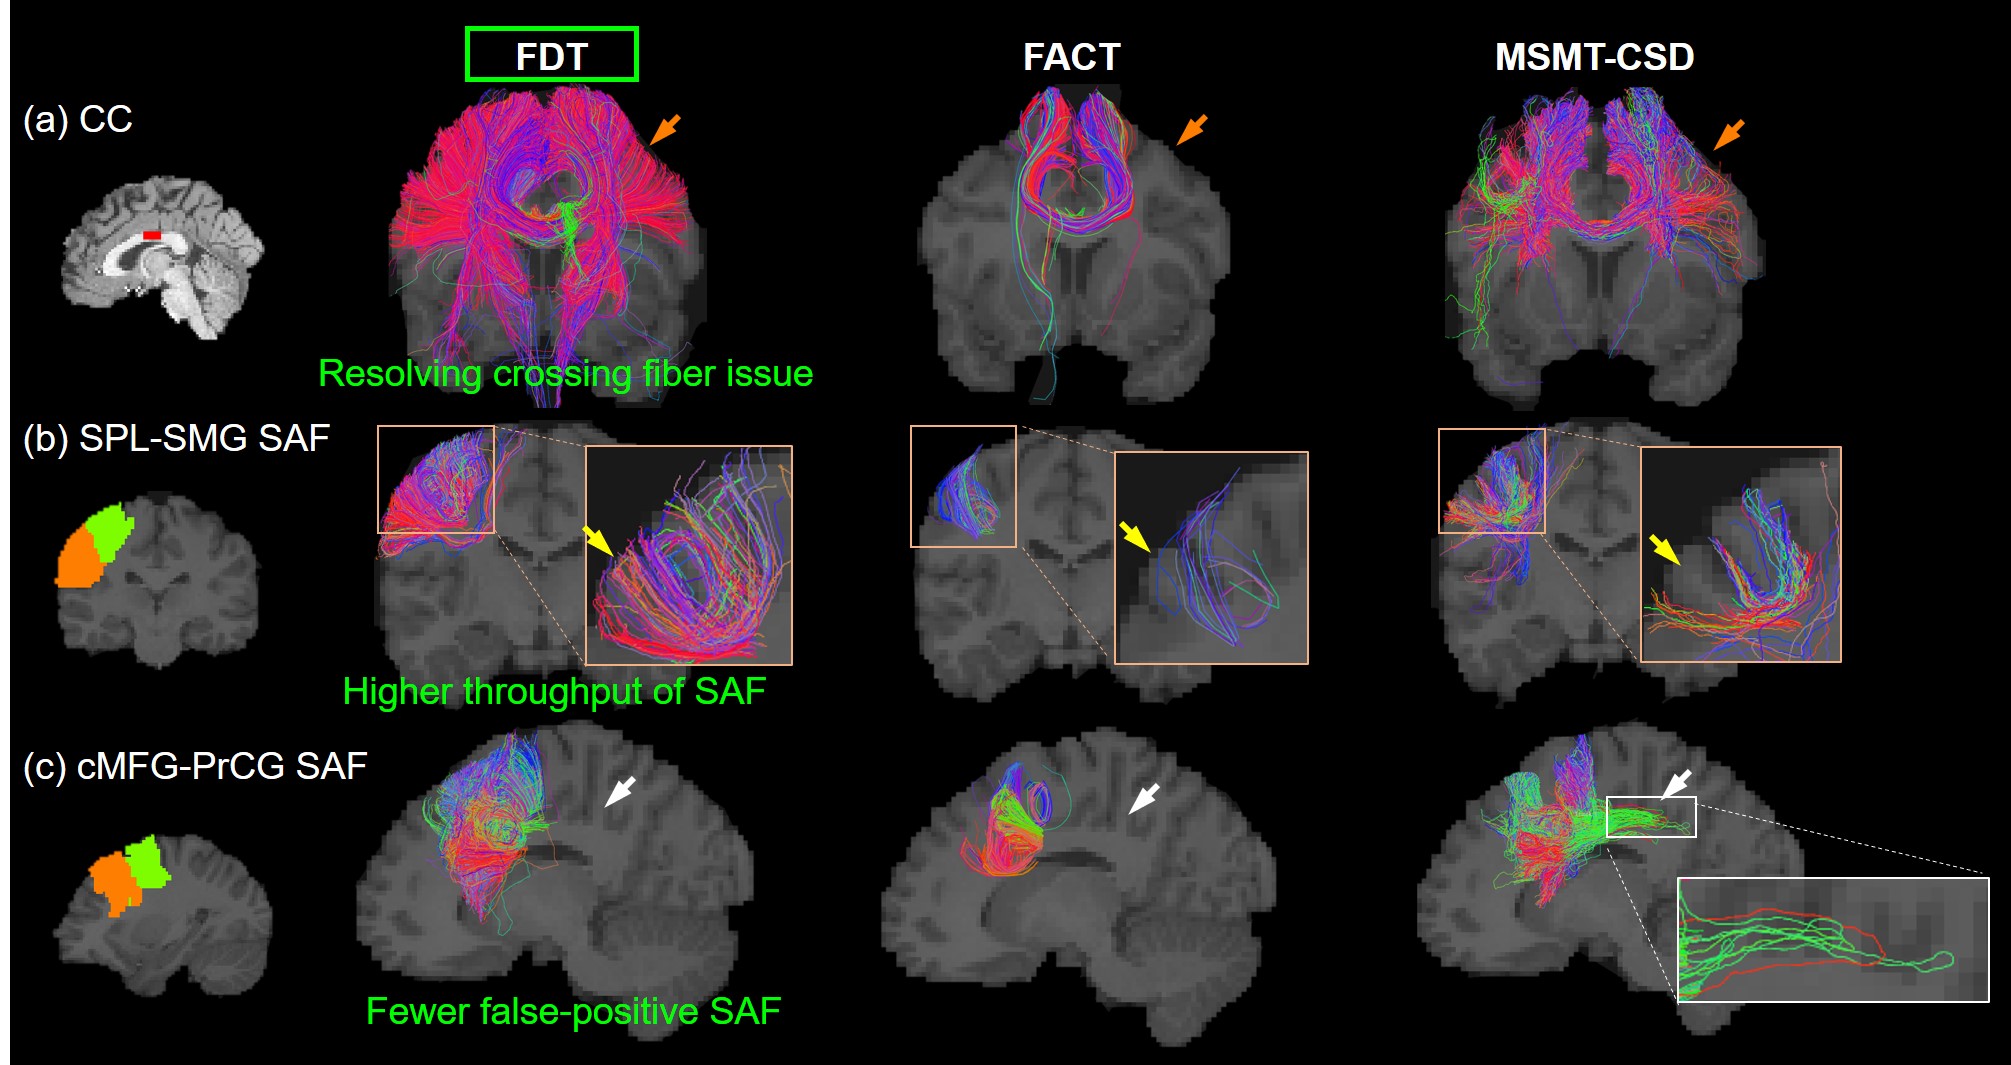
Streamline tracing of SAF: Three local fiber orientation and tracing algorithms were compared in this study: FDT streamline tracing (FMRIB’s Diffusion Toolbox, https://fsl.fmrib.ox.ac.uk/fsl/fslwiki/FDT), fiber assignment by continuous tracking(FACT) [12], multi-shell multi-tissue constrained spherical deconvolution (MSMT-CSD) [13]. Each algorithm traced fibers with angle threshold of 60 degrees. In FDT streamline tracing, Bayesian estimation of diffusion parameters obtained using sampling techniques for modeling crossing fibers(bedpostx) [10,14-15] of multi-shell ball and stick model was applied for local fiber orientation estimation, with two fibers per voxel, 1000 burn-in jumps, and further 1250 jumps sampling every 25 jumps (total 50 samples). Probabilistic tracking with crossing fibers(probtrackx) [10,14] was used to trace streamlines, with 10 seeds per voxel and traced in opposite directions from the seed. Traced streamlines were saved. In FACT, deterministic, DTI-based whole-brain tractography was conducted in Diffusion Toolkit (http://www.trackvis.org/dtk/) with FA>0.01. In MSMT-CSD, orientation distribution function(ODF) of WM was estimated via MSMT-CSD, followed by anatomically-constrained tractography(ACT) [16] in MRtrix[17]. For the two probabilistic tracing algorithms, MSMT-CSD and FDT, other common configurations were: step size=0.5mm; total number of streamlines of MSMT-CSD was set as the number traced in FDT.
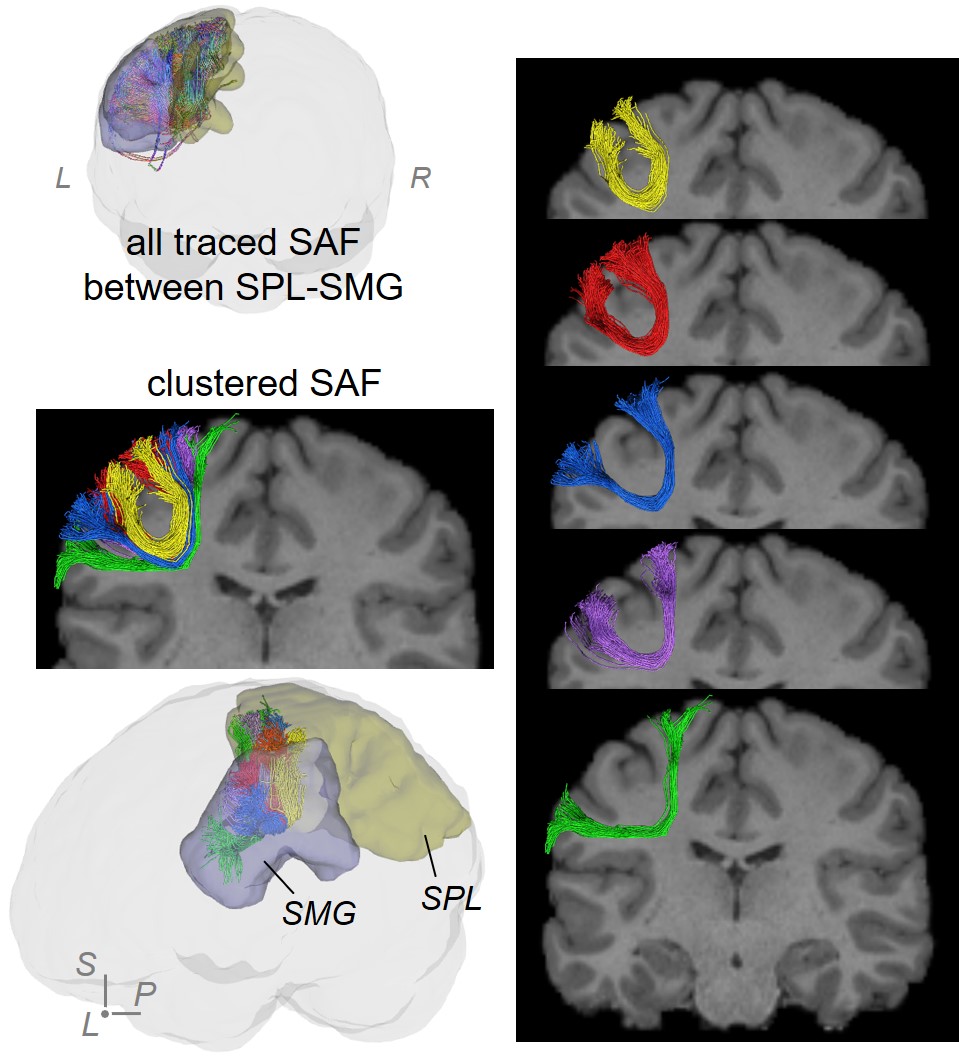
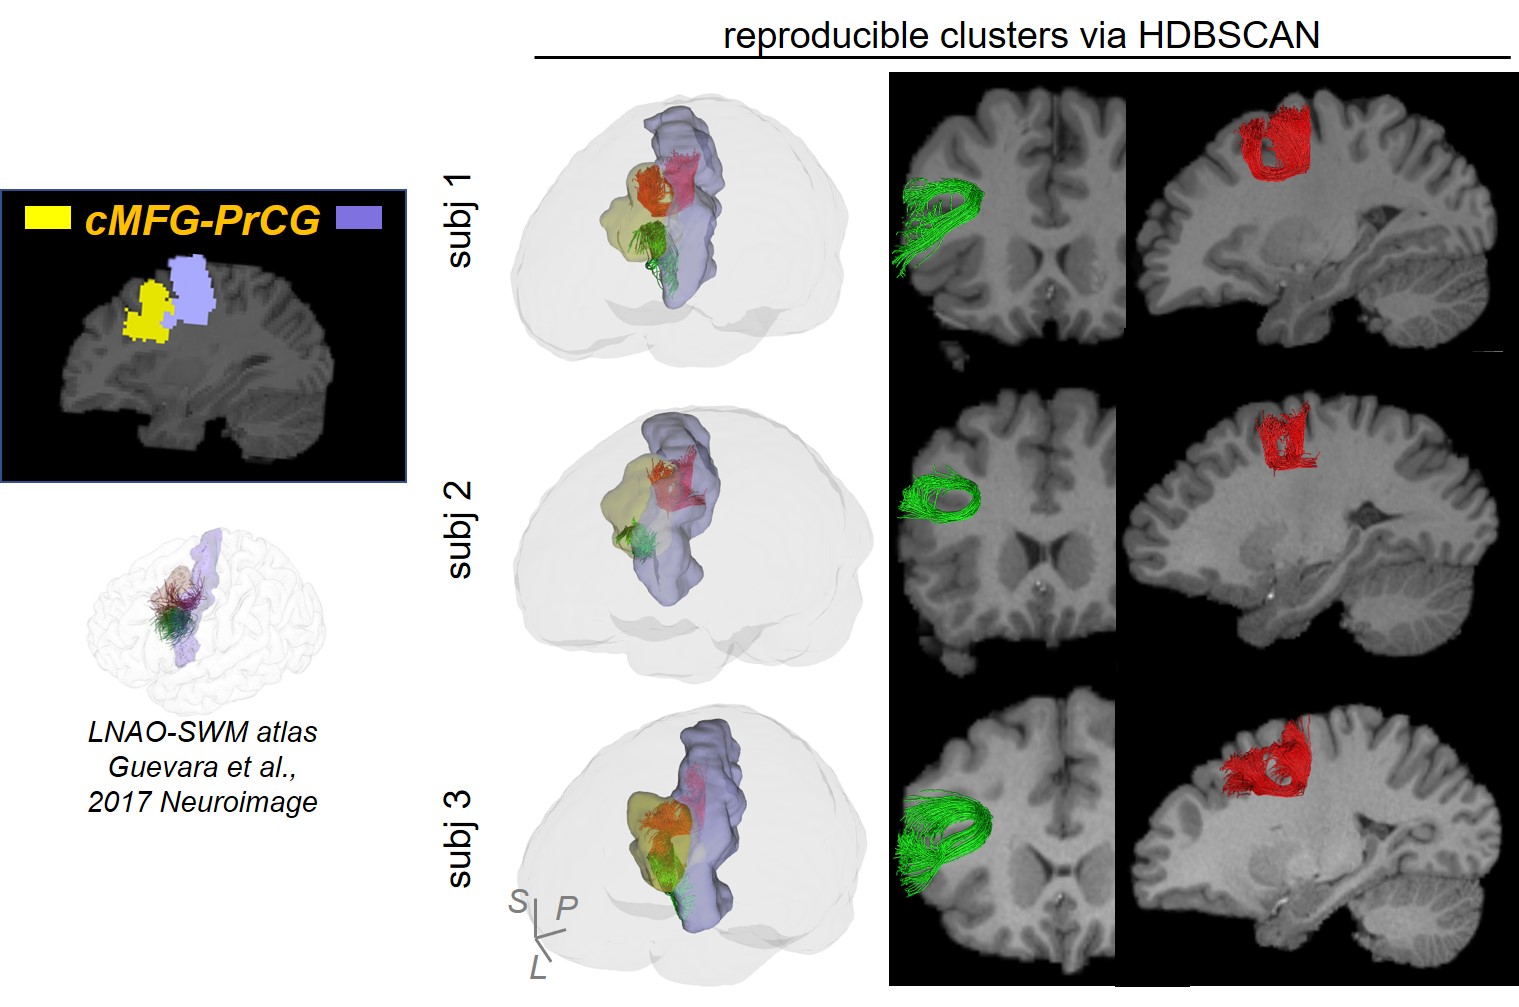
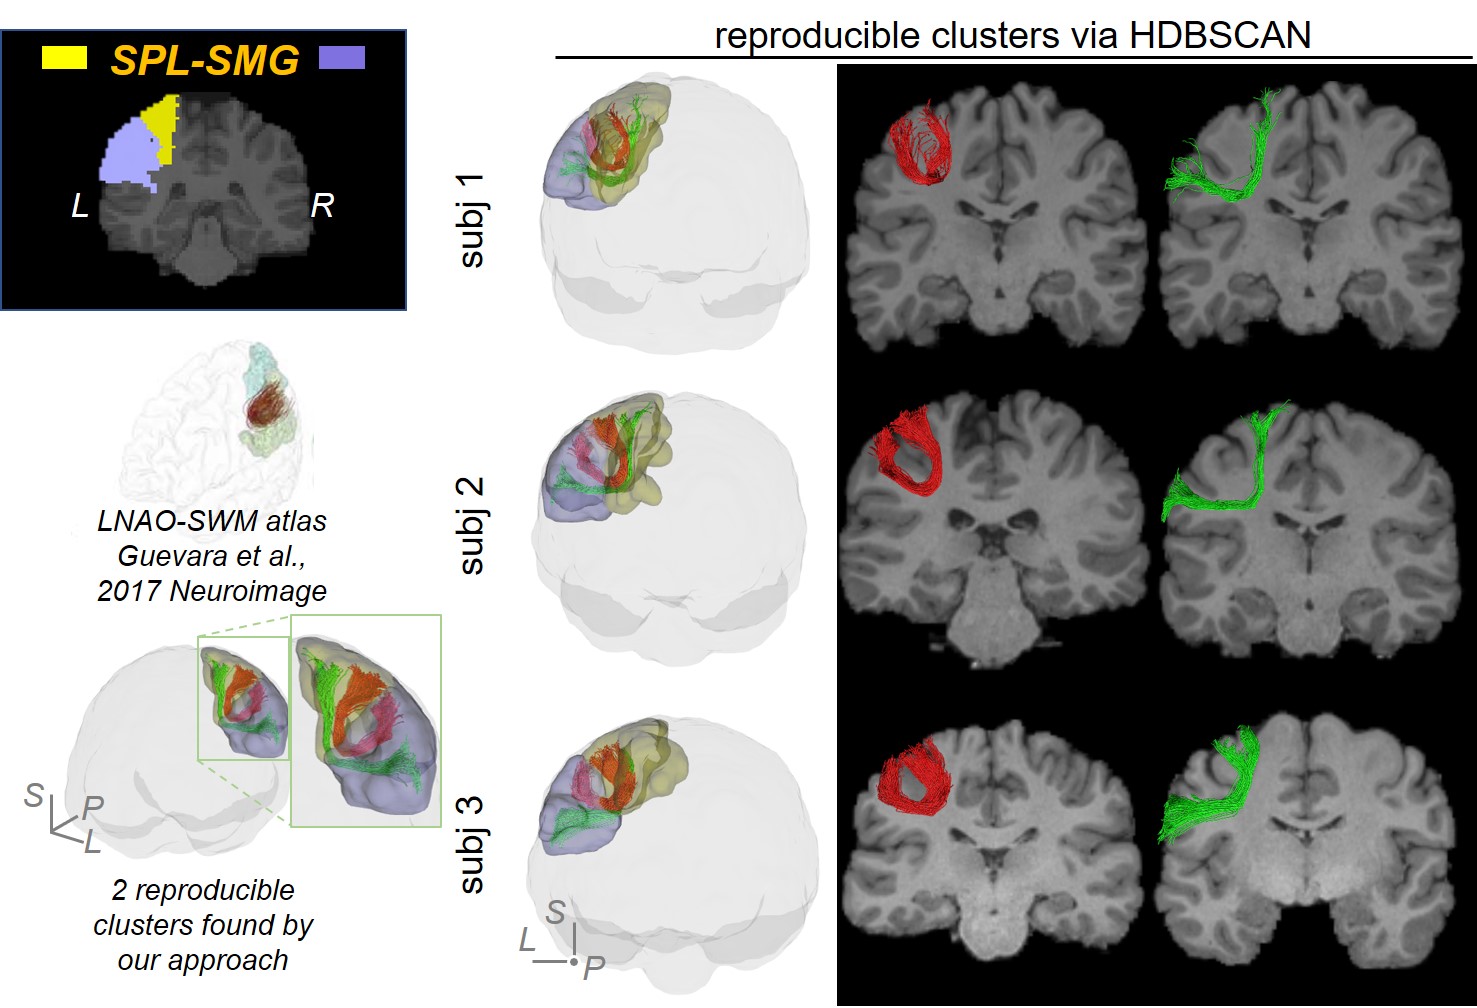
SAF clustering with HDBSCAN: Ten points were evenly sampled along each fiber and the coordinates were vectorized as $$$f$$$ = (x1,y1,z1,…,x10,y10,z10)T. Distance between two fibers was defined as: $$$d(f_a,f_b)=min(\|{f_a-f_b}\|_2, \|f_a- \bar{f_b} \|_2)$$$, where $$$\bar{f}$$$ denotes (x10,y10,z10,…,x1,y1,z1)T [18]. To well separate local SAFs, a novel, hierarchical density-based clustering approach, HDBSCAN [11] was then applied on the distance matrix of all fibers within one set of SAFs which connect adjacent cortical regions with following parameters: minimal points=1; minimal cluster size = number of streamlines in one SAF / m, where, for SAFs shown in figures, m = 80 for SAF linking caudal middle frontal gyrus (cMFG) and precentral gyrus (PrCG), and 50 for SAF linking superior parietal lobule (SPL) and supramarginal gyrus (SMG).
Results
Figure 2 shows that FDT streamline tracing outperformed the other two tracing algorithms. Specifically, to demonstrate the capability of dealing with crossing fiber, corpus callosum (CC) was traced from an ROI on the middle sagittal plane (Figure 2(a), left panel, shown in red). Compared to FACT, FDT covered CC through crossing fibers regions and resolved the crossing fiber issue (Figure 2(a)). Moreover, specifically for SAF tracing, FDT better covered SAF (Figure 2(b)) and produced fewer false-positive, long, sharp-turn SAF fibers than MSMT-CSD (Figure 2(c)), demonstrating its capacity of well SAF tracing. Within local SAFs linking the same pair of adjacent cortical regions, novel clustering approach based on HDBSCAN well separated SAFs with different shapes and terminations in the cortical regions (example shown in Figure 3). In addition, our SAF clustering method identified reproducible SAF clusters, not only the ones literature [7,19] reported (example shown in Figure 4; and Figure 5 red cluster), but also new cluster which previous studies [7,19] did not identify (example shown in Figure 5).Discussion and Conclusions
The newly established STTAR protocol is capable of resolving crossing fiber issue, producing high-throughput SAF with fewer false-positives, well separating local SAFs with different shapes and terminations, and reproducibly identifying both reported and new SAF clusters through novel density-based clustering approach HDBSCAN. This protocol will be able to identify, map and label the whole brain reproducible SAFs as the anatomical reference, thus paving the way for neuroscience and clinical neuropsychiatric research in SAF in exploratory dataset without SAF atlas. Functions and clinical values of newly identified reproducible cluster need further investigation. We will continue comprehensive evaluation of STTAR.Acknowledgements
This study is funded by NIH MH092535, MH092535-S1 and HD086984.
Data were provided by the Human Connectome Project, WU-Minn Consortium (Principal Investigators: David Van Essen and Kamil Ugurbil; 1U54MH091657) funded by the 16 NIH Institutes and Centers that support the NIH Blueprint for Neuroscience Research; and by the McDonnell Center for Systems Neuroscience at Washington University.
References
[1] Ouyang, M., Kang, H., Detre, J. A., Roberts, T. P., & Huang, H. (2017). Short-range connections in the developmental connectome during typical and atypical brain maturation. Neuroscience & Biobehavioral Reviews, 83, 109-122.
[2] Courchesne, E., & Pierce, K. (2005). Why the frontal cortex in autism might be talking only to itself: local over-connectivity but long-distance disconnection. Current opinion in neurobiology, 15(2), 225-230.
[3] Innocenti, G. M., & Price, D. J. (2005). Exuberance in the development of cortical networks. Nature Reviews Neuroscience, 6(12), 955.
[4] Paus, T., Keshavan, M., & Giedd, J. N. (2008). Why do many psychiatric disorders emerge during adolescence?. Nature Reviews Neuroscience, 9(12), 947.
[5] Zhang, Y., Zhang, J., Oishi, K., Faria, A. V., Jiang, H., Li, X., ... & Mori, S. (2010). Atlas-guided tract reconstruction for automated and comprehensive examination of the white matter anatomy. Neuroimage, 52(4), 1289-1301.
[6] Catani, M., Dell’Acqua, F., Vergani, F., Malik, F., Hodge, H., Roy, P., ... & De Schotten, M. T. (2012). Short frontal lobe connections of the human brain. Cortex, 48(2), 273-291.
[7] Guevara, M., Román, C., Houenou, J., Duclap, D., Poupon, C., Mangin, J. F., & Guevara, P. (2017). Reproducibility of superficial white matter tracts using diffusion-weighted imaging tractography. Neuroimage, 147, 703-725.
[8] Huang, H., Zhang, J., Van Zijl, P. C., & Mori, S. (2004). Analysis of noise effects on DTI‐based tractography using the brute‐force and multi‐ROI approach. Magnetic Resonance in Medicine: An Official Journal of the International Society for Magnetic Resonance in Medicine, 52(3), 559-565.
[9] Wakana, S., Caprihan, A., Panzenboeck, M. M., Fallon, J. H., Perry, M., Gollub, R. L., ... & Mori, S. (2007). Reproducibility of quantitative tractography methods applied to cerebral white matter. Neuroimage, 36(3), 630-644.
[10] Behrens, T. E., Berg, H. J., Jbabdi, S., Rushworth, M. F., & Woolrich, M. W. (2007). Probabilistic diffusion tractography with multiple fibre orientations: What can we gain?. Neuroimage, 34(1), 144-155.
[11] Campello, R. J., Moulavi, D., & Sander, J. (2013, April). Density-based clustering based on hierarchical density estimates. In Pacific-Asia conference on knowledge discovery and data mining (pp. 160-172). Springer, Berlin, Heidelberg.
[12] Mori, S., Crain, B. J., Chacko, V. P., & Van Zijl, P. C. (1999). Three‐dimensional tracking of axonal projections in the brain by magnetic resonance imaging. Annals of Neurology: Official Journal of the American Neurological Association and the Child Neurology Society, 45(2), 265-269.
[13] Jeurissen, B., Tournier, J. D., Dhollander, T., Connelly, A., & Sijbers, J. (2014). Multi-tissue constrained spherical deconvolution for improved analysis of multi-shell diffusion MRI data. NeuroImage, 103, 411-426.
[14] Behrens, T. E., Woolrich, M. W., Jenkinson, M., Johansen‐Berg, H., Nunes, R. G., Clare, S., ... & Smith, S. M. (2003). Characterization and propagation of uncertainty in diffusion‐weighted MR imaging. Magnetic Resonance in Medicine: An Official Journal of the International Society for Magnetic Resonance in Medicine, 50(5), 1077-1088.
[15] Jbabdi, S., Sotiropoulos, S. N., Savio, A. M., Graña, M., & Behrens, T. E. (2012). Model‐based analysis of multishell diffusion MR data for tractography: How to get over fitting problems. Magnetic resonance in medicine, 68(6), 1846-1855.
[16] Smith, R. E., Tournier, J. D., Calamante, F., & Connelly, A. (2012). Anatomically-constrained tractography: improved diffusion MRI streamlines tractography through effective use of anatomical information. Neuroimage, 62(3), 1924-1938.
[17] Tournier, J. D., Smith, R., Raffelt, D., Tabbara, R., Dhollander, T., Pietsch, M., ... & Connelly, A. (2019). MRtrix3: A fast, flexible and open software framework for medical image processing and visualisation. NeuroImage, 116137.
[18] Chen, P., Fan, X., Liu, R., Tang, X., & Cheng, H. (2015, April). Fiber segmentation using a density-peaks clustering algorithm. In 2015 IEEE 12th International Symposium on Biomedical Imaging (ISBI) (pp. 633-637). IEEE.
[19] Catani, M., Robertsson, N., Beyh, A., Huynh, V., de Santiago Requejo, F., Howells, H., ... & Dell'Acqua, F. (2017). Short parietal lobe connections of the human and monkey brain. Cortex, 97, 339-357.
Figures