0856
Towards taking the guesswork (and the errors) out of diffusion tractography1Radiology, Harvard Medical School & Massachusetts General Hospital, Charlestown, MA, United States, 2Radiology, Massachusetts General Hospital, Charlestown, MA, United States, 3Massachusetts Institute of Technology, Cambridge, MA, United States
Synopsis
Orientation distributions estimated from diffusion MRI have multiple peaks per voxel. Tractography algorithms must choose among them arbitrarily, leading to errors. We propose a novel approach to making this choice in a manner informed by the data. We use post mortem optical and MRI data to train a convolutional neural network that can recognize voxel-wise connection patterns directly from diffusion data, circumventing the conventional paradigm of an orientation distribution. We introduce TRACARIS (TRACt Architectures Recovered from Imaging Signals), a tractography algorithm that uses these network-predicted, local connection patterns. We present preliminary validation results from a post mortem human brain sample.
Introduction
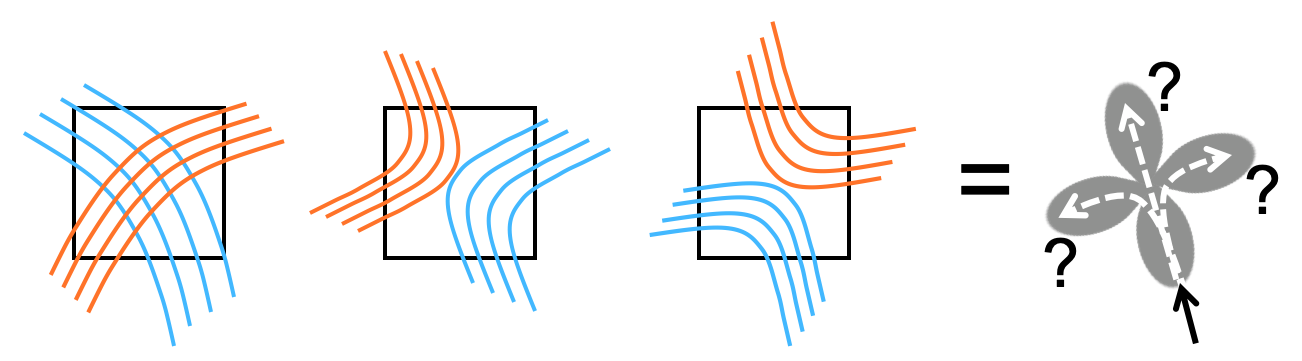
Diffusion MRI (dMRI) data quality has improved dramatically in recent years, allowing more accurate estimates of orientation distribution functions (ODFs). However, accurate ODFs do not ensure accurate tractography, as different arrangements of axon bundles give rise to similar ODFs. In voxels with multiple ODF peaks, tractography must choose which one to follow arbitrarily (Fig. 1). This ambiguity is referred to as the "crossing vs. kissing fiber" problem but also encountered, e.g., where fiber bundles split or merge. We propose a solution that does not rely on prior anatomical information or on assumptions of microstructural continuity along bundles.Methods
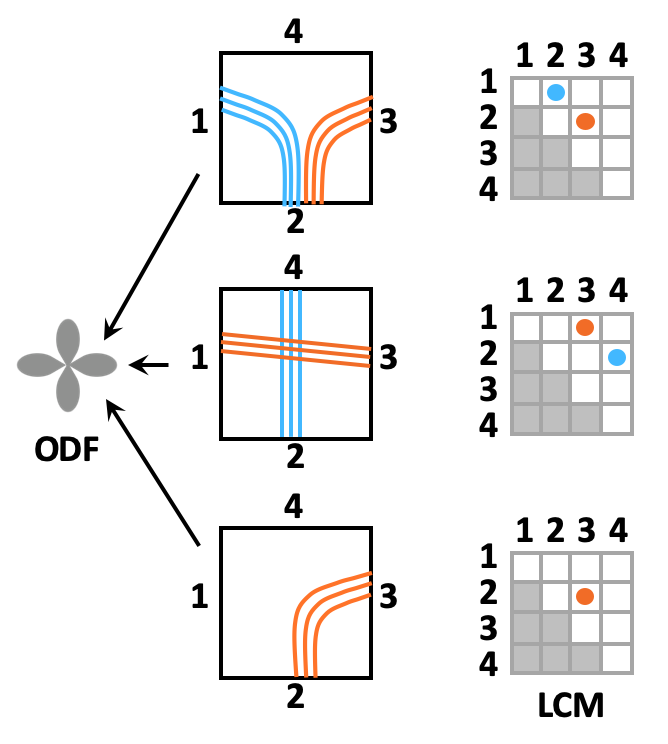
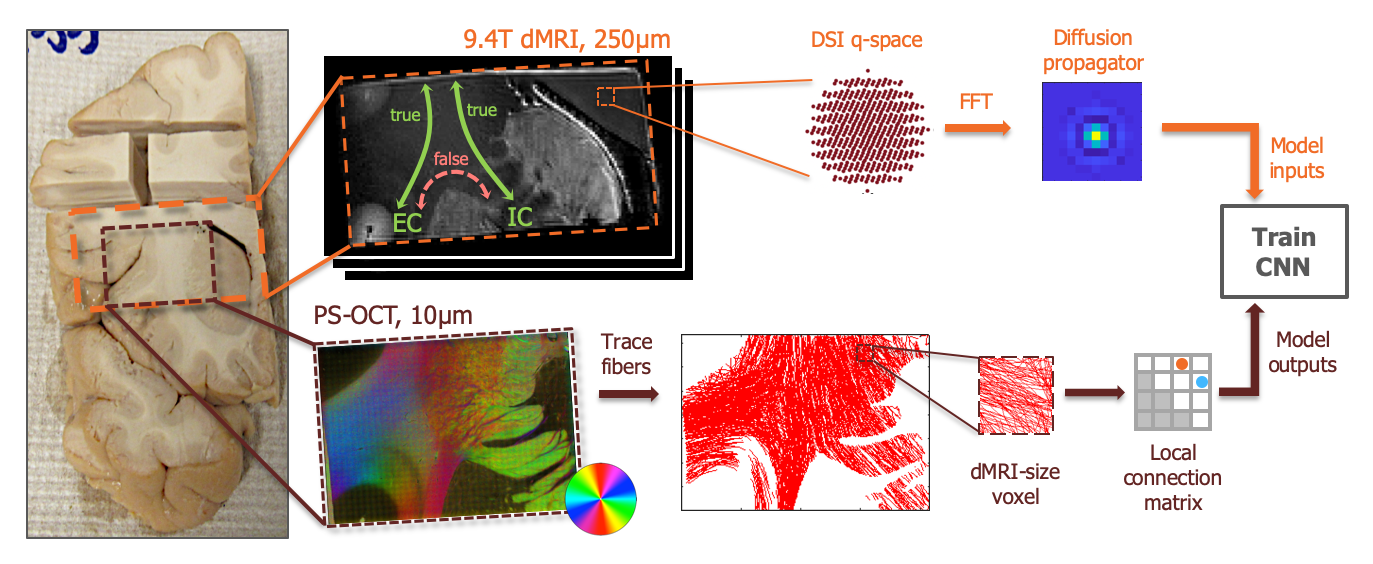
Local connection matrix (LCM): Fig. 2 illustrates the concept in 2D. Each square is a voxel in dMRI space, and the curves inside it are axon bundles. Let fi, i=1,…,4 indicate 4 faces of a (2D) voxel. We define the LCM of the voxel as a 4x4 matrix C={cij}, where cij is non-zero only if there is a connection between voxel faces fi and fj. As C is symmetric, we only consider its upper triangular part. The figure shows three example bundle configurations with similar ODFs but different LCMs. Data acquisition: We used a human brain sample containing the area of where fibers split into the external capsule and internal capsules (EC/IC). The challenge for tractography is to follow these two bundles, but without following paths that go from the EC to IC or vice versa (Fig. 3). We acquired dMRI data at 9.4T (3D-EPI, 514-direction DSI1, bmax=40K, 0.25mm isotropic resolution) and polarization-sensitive optical coherence tomography (PS-OCT)2,3 scans on 63 coronal slices (0.003/0.075mm in-plane/through-plane resolution). The latter yield measurements of optic axis orientations. Ground truth: We performed tractography on PS-OCT orientation maps downsampled to 0.01mm. We counted the streamlines that connected each pair of faces in each 0.25mm dMRI voxel. For this proof of concept, we measured in-plane (2D) PS-OCT orientations. Thus we computed 4x4 LCMs, counting connections between the left, right, superior, and inferior faces of dMRI voxels. We normalized LCM elements to sum to 1, representing the portion of a voxel's fibers that connected each pair of faces. Network architecture: We constructed a convolutional neural network (CNN) whose inputs were the 3D diffusion propagators (zero-padded to 163) from a target voxel and its 6 nearest neighbors. A convolutional encoder with 4 convolution layers of 60 features is followed by a ReLu non-linearity, batch normalization, and max-pooling. The deepest layer is flattened and dense connections are added to a layer with 512 elements, followed by a dropout layer (fraction=0.2) and a dense layer with a softmax activation function. The output comprises the 10 unique elements of the 2D LCM at the target voxel. We trained the model on data from half of the available slices, and used it to predict LCMs in the remaining slices. Tractography: We reconstructed ODFs from the DSI data. We performed streamline tractography, choosing which ODF peak to follow at each step 1. by the conventional rule of minimizing the bending angle with respect to the previous step, and 2. by sampling from the LCM.Results
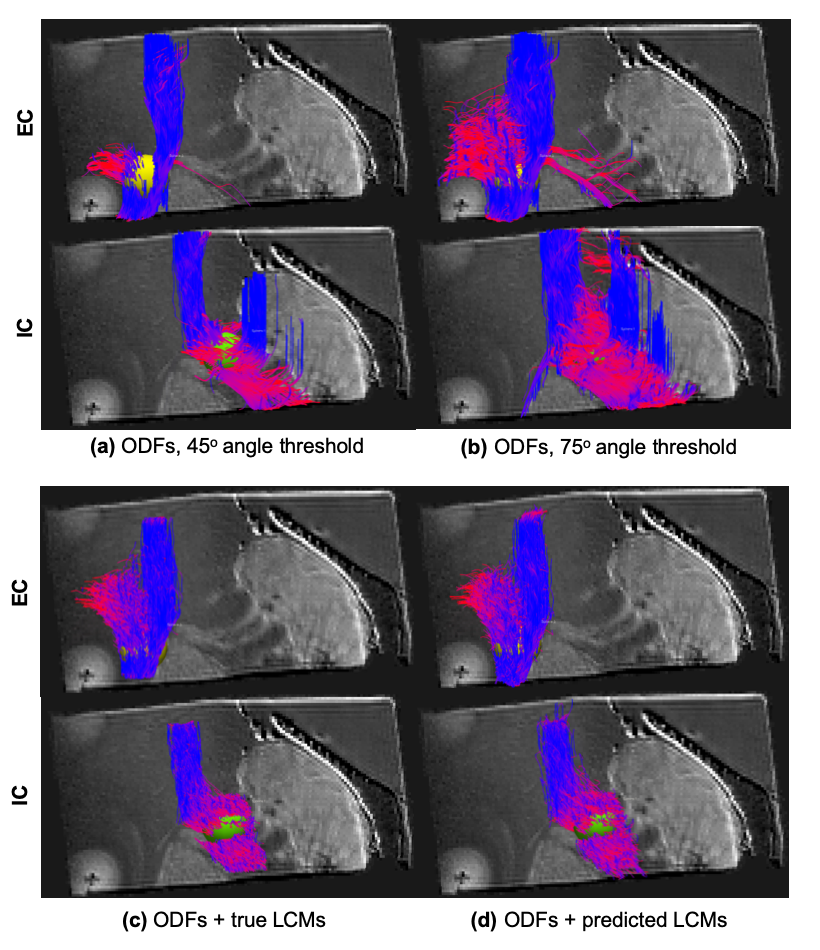
For each approach, Fig. 4 shows all streamlines that went through the EC (yellow sphere) or the IC (green sphere). No other inclusion regions were used. When we used the conventional choice of the peak that minimized the bending angle, results depended strongly on the maximum angle threshold. When this was set to a stringent 45o (Fig. 4a), the EC bundle was not reconstructed fully, and a few erroneous streamlines turned from the EC into the IC. When we relaxed the threshold to 75o (Fig. 4b), we recovered the EC bundle, but at the cost of more erroneous connections traveling from the EC to the IC and vice versa. Additional erroneous streamlines were found with both angle thresholds. When we used LCMs to determine which peak to follow, we did not find the aforementioned false positives. Fig. 4c shows the best-case scenario, using the ground-truth LCMs from the PS-OCT data. This illustrates that having access to the LCMs can indeed ensure that tractography takes the correct turn at each step. Fig. 4d shows the realistic scenario, usign LCMs predicted from the dMRI data by the CNN. This illustrates that we can recover LCMs successfully from DSI data. Importantly, when using the LCMs, we did not enforce a maximum angle threshold, i.e., we allowed tractography to take as sharp turns as it wanted, trusting the LCM to guide it to the correct choice.Discussion
This early prototype used 4x4 LCMs to aid ODF-based tractography but, in the future, higher-dimensional (e.g., icosahedral) LCMs could replace ODFs altogether. We used full propagators from DSI as the CNN inputs, but will investigate if microstructural maps derived from less demanding (q-shell) sampling schemes are sufficient. This was a proof-of-concept experiment, where we trained and tested on different voxels from the same white-matter area. A larger and more diverse training set will be needed to scale this prototype up to the whole brain. We plan to build such a training set by obtaining realistic axon configurations from PS-OCT scans in different white-matter regions, and augmenting them by simulating additional configurations.Acknowledgements
This work was supported by the National Institute of Biomedical Imaging and Bioengineering (R01-EB021265). It was carried out at the Athinoula A. Martinos Center for Biomedical Imaging at the Massachusetts General Hospital, using resources provided by the Center for Functional Neuroimaging Technologies, P41-EB015896, a P41 Biotechnology Resource Grant, and by the NIH Shared Instrumentation Grant Program (S10RR025563, S10RR023401, S10RR019307, and S10RR023043).References
1. V. J. Wedeen, P. Hagmann, W.-Y. I. Tseng, T. G. Reese, and R. M. Weisskoff, “Mapping complex tissue architecture with diffusion spectrum magnetic resonance imaging.,” Magn Reson Med, vol. 54, no. 6, pp. 1377–1386, Dec. 2005.
2. H. Wang, J. Zhu, M. Reuter, L. N. Vinke, A. Yendiki, D. A. Boas, B. Fischl, T. Akkin, “Cross-validation of serial optical coherence scanning and diffusion tensor imaging: A study on neural fiber maps in human medulla oblongata,” Neuroimage, 100C:395–404, Jun. 2014.
3. Wang H, Magnain C, Wang R, Dubb J, Varjabedian
A, Tirrell LS, Stevens A, Augustinack JC, Konukoglu E, Aganj I, Frosch MP,
Schmahmann JD, Fischl B, Boas DA (2018). as-PSOCT: volumetric microscopic
imaging of human brain architecture and connectivity, NeuroImage 165, 56-68.
Figures