0854
Synchrotron microCT tractography connectomics: comparison with diffusion MRI and neural tracer injections1Department of Radiology, The University of Chicago, Chicago, IL, United States, 2Department of Neurobiology, The University of Chicago, Chicago, IL, United States
Synopsis
In this study, we generated tractography-derived, mesoscale mouse “connectomes” from diffusion MRI and synchrotron microCT data on the same mouse brain and evaluated their accuracy using anterograde tracer data from the Allen Mouse Brain Connectivity Atlas. We are developing whole-brain synchrotron microCT, which provides micron-level isotropic resolution across whole mouse brains with no physical sectioning. Even when binning the microCT orientation information to the MRI resolution, microCT tractography outperformed MRI. However, both datasets performed similarly to a tractography connectome constructed entirely with random orientation data, highlighting the importance of understanding geometric biases in tractography connectome construction.
Introduction
Neural connectivity plays an important role in the understanding of a number of neurological diseases.1–3 Diffusion MRI (dMRI) tractography has the potential to noninvasively map this connectivity information in vivo.4 However, efforts to validate tractography have revealed poor specificity,5 creating a push for new validation methods over a range of spatial scales.6 The Allen Mouse Brain Connectivity Atlas (AMBCA)7 uses neural-tracer based optical imaging to provide gold-truth connectivity values for the mouse brain. While an exquisite resource, this method is limited to imaging a single injection site per specimen, making the construction of a “connectome” extremely labor intensive. Furthermore, the imaging requires sectioning, which can potentially warp the tissue and results in volumetric data with non-isotropic resolution. With 12 hours of data collection time, synchrotron microcomputed tomography (microCT) allows for micron-level isotropic resolution across whole mouse brains with no sectioning. Fibers can be resolved and their local orientations can be estimated across the whole brain, allowing for the testing of tractography algorithms. In this study, we generated tractography-derived, mesoscale connectomes from dMRI and microCT data on the same sample and evaluated their accuracy using tracer data from AMBCA.Methods
MRI data were acquired of a perfusion-fixed control mouse brain. The brain was imaged with a Bruker 9.4 T magnet, using a 3D diffusion-weighted SE sequence (150 μm isotropic resolution, 30 directions, b=3000 s/mm2). Fiber orientation distribution functions (ODFs) were generated using constrained spherical deconvolution in MRtrix.8 The specimen was then stained with heavy metals in preparation for microCT imaging at beamline 32-ID of the Advanced Photon Source at Argonne National Lab. The volume was reconstructed at 1.2 μm isotropic resolution. Fiber orientations were estimated at each voxel using structure tensor analysis.9,10 The orientations were binned across ROIs the size of a single dMRI voxel, and represented as ODFs on a basis of spherical harmonic functions. The dMRI and microCT data were nonlinearly registered to the AMBCA template using ANTs registration.11 These transforms were used to warp 467 neuronal tracer injection ROIs and 632 target structure ROIs into the spaces of each modality. The injection ROIs were used as seed regions for probabilistic tractography using MRtrix. Connectivity matrices were constructed by summing the number of streamlines entering each target structure that originated in each injection site. As a control, the same tractography experiments were performed using random orientation data with the “NullDist2” algorithm in MRtrix.Results
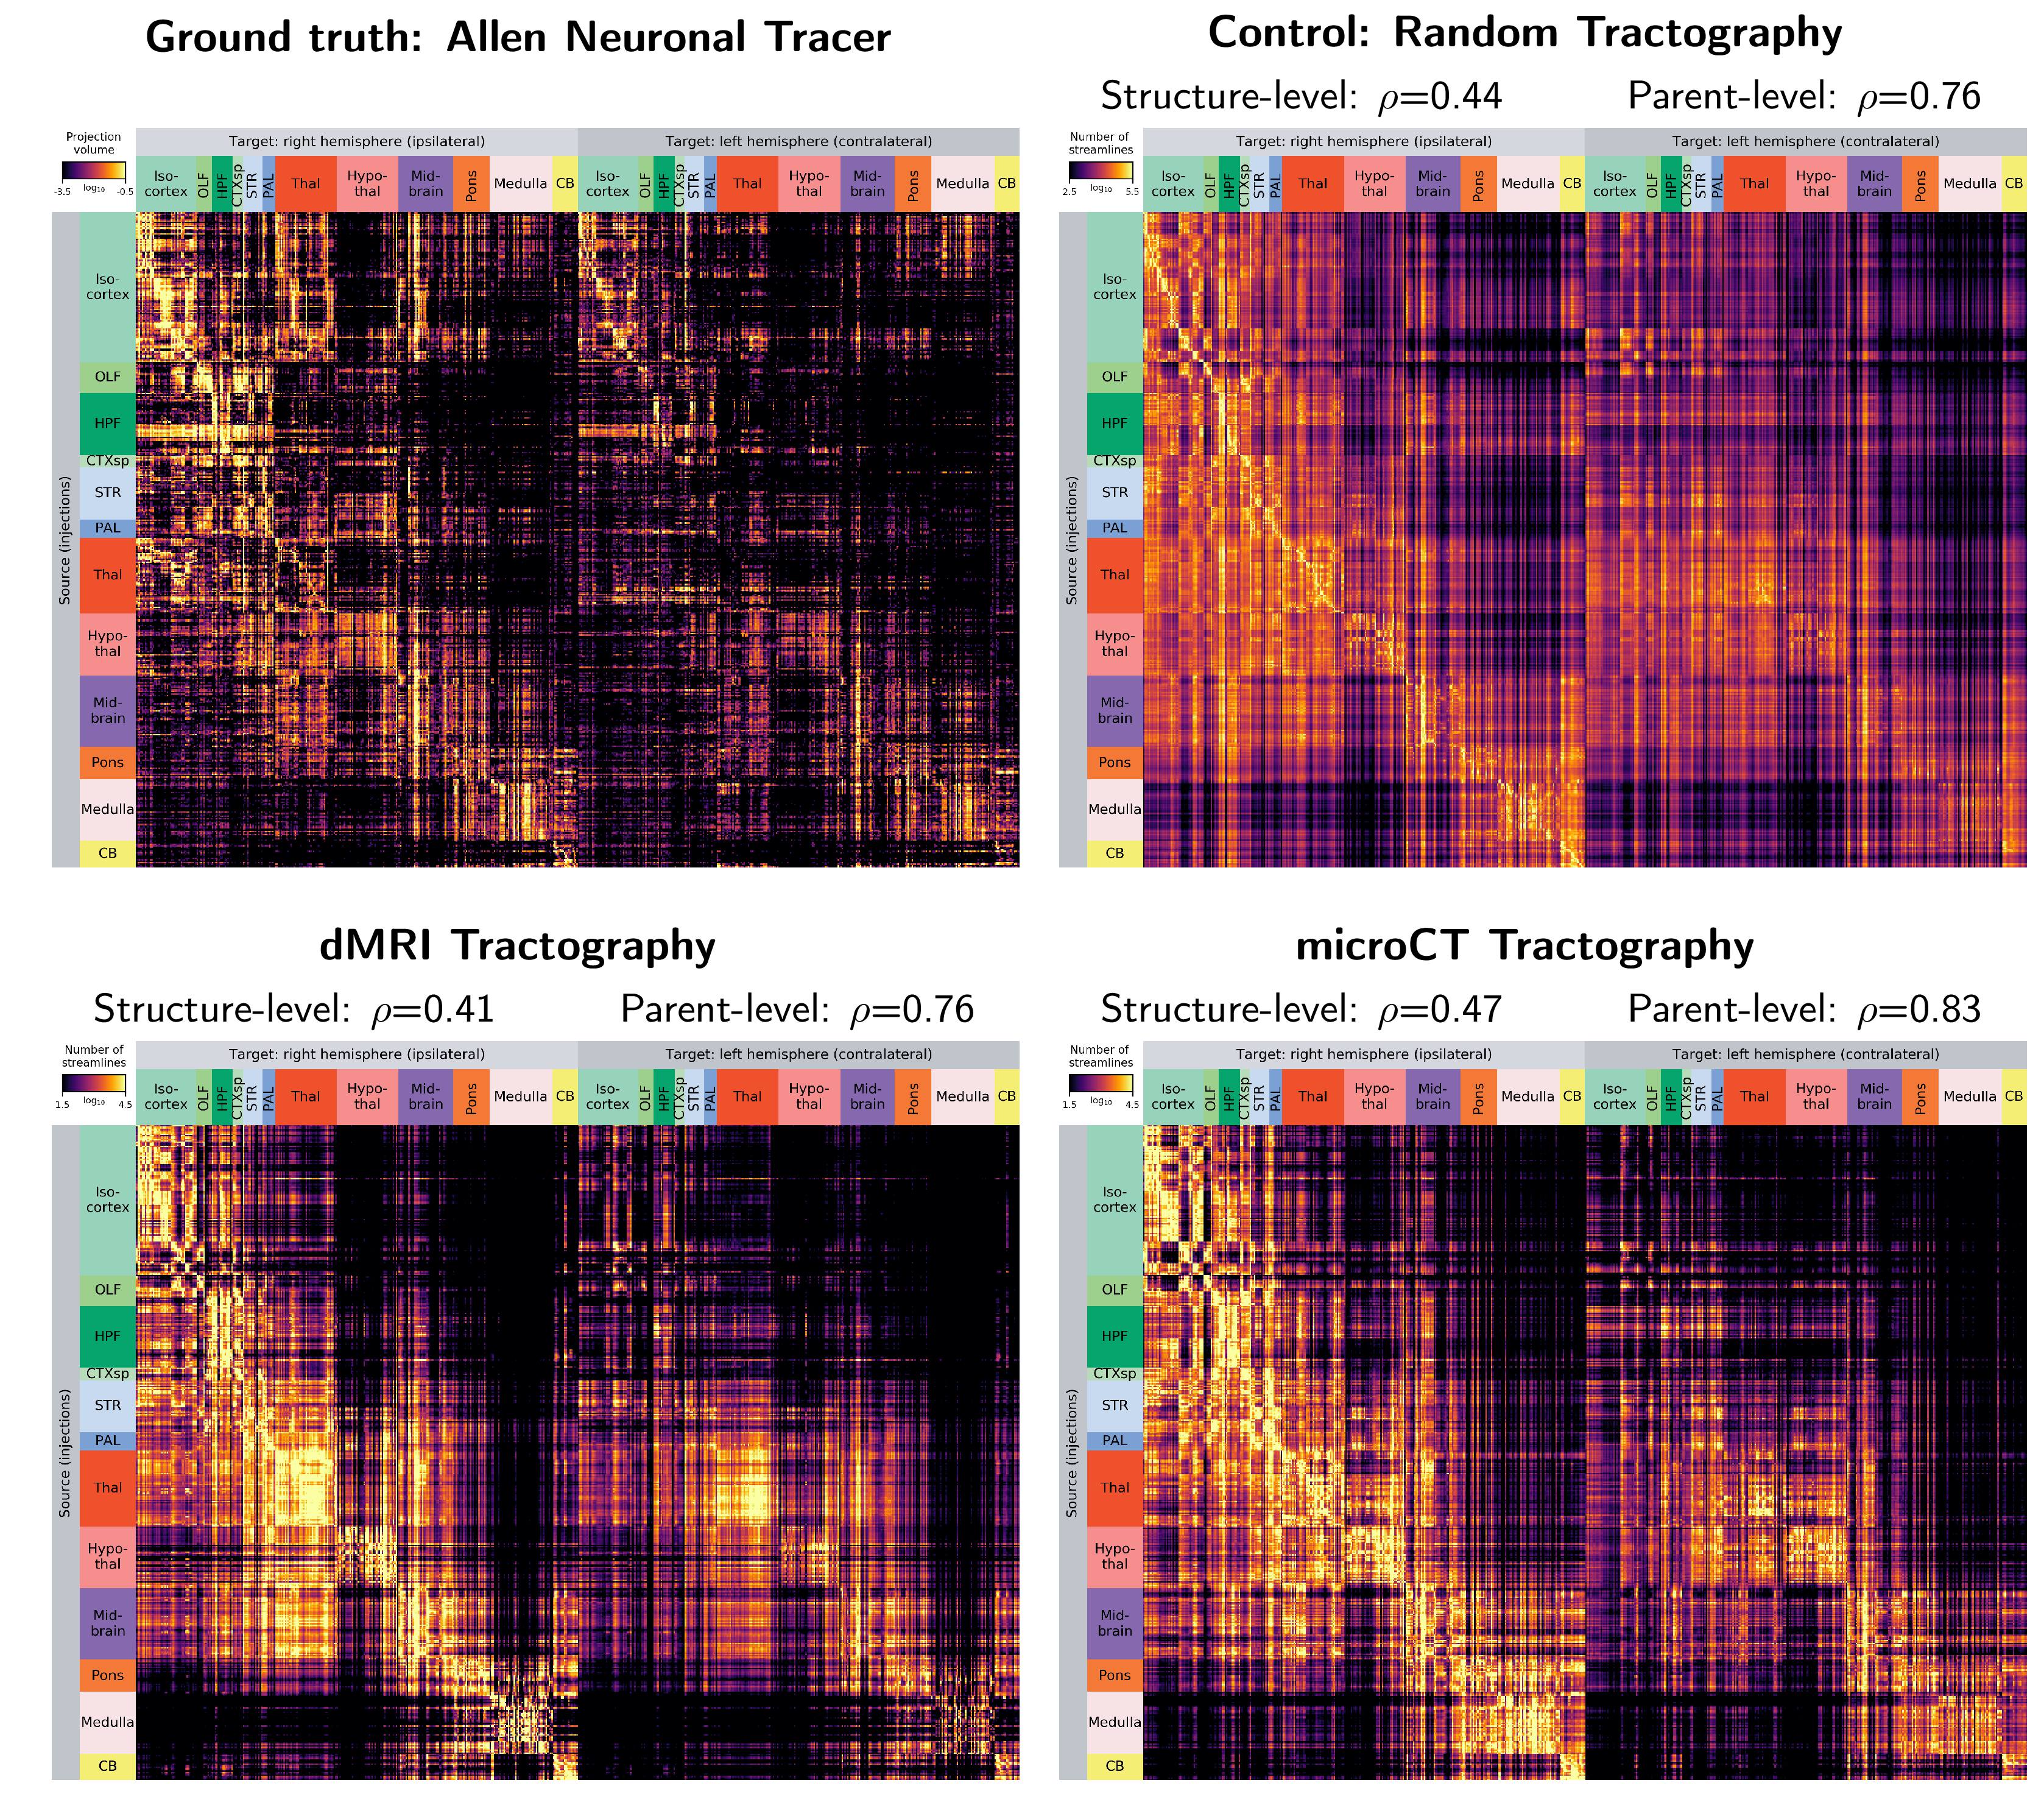
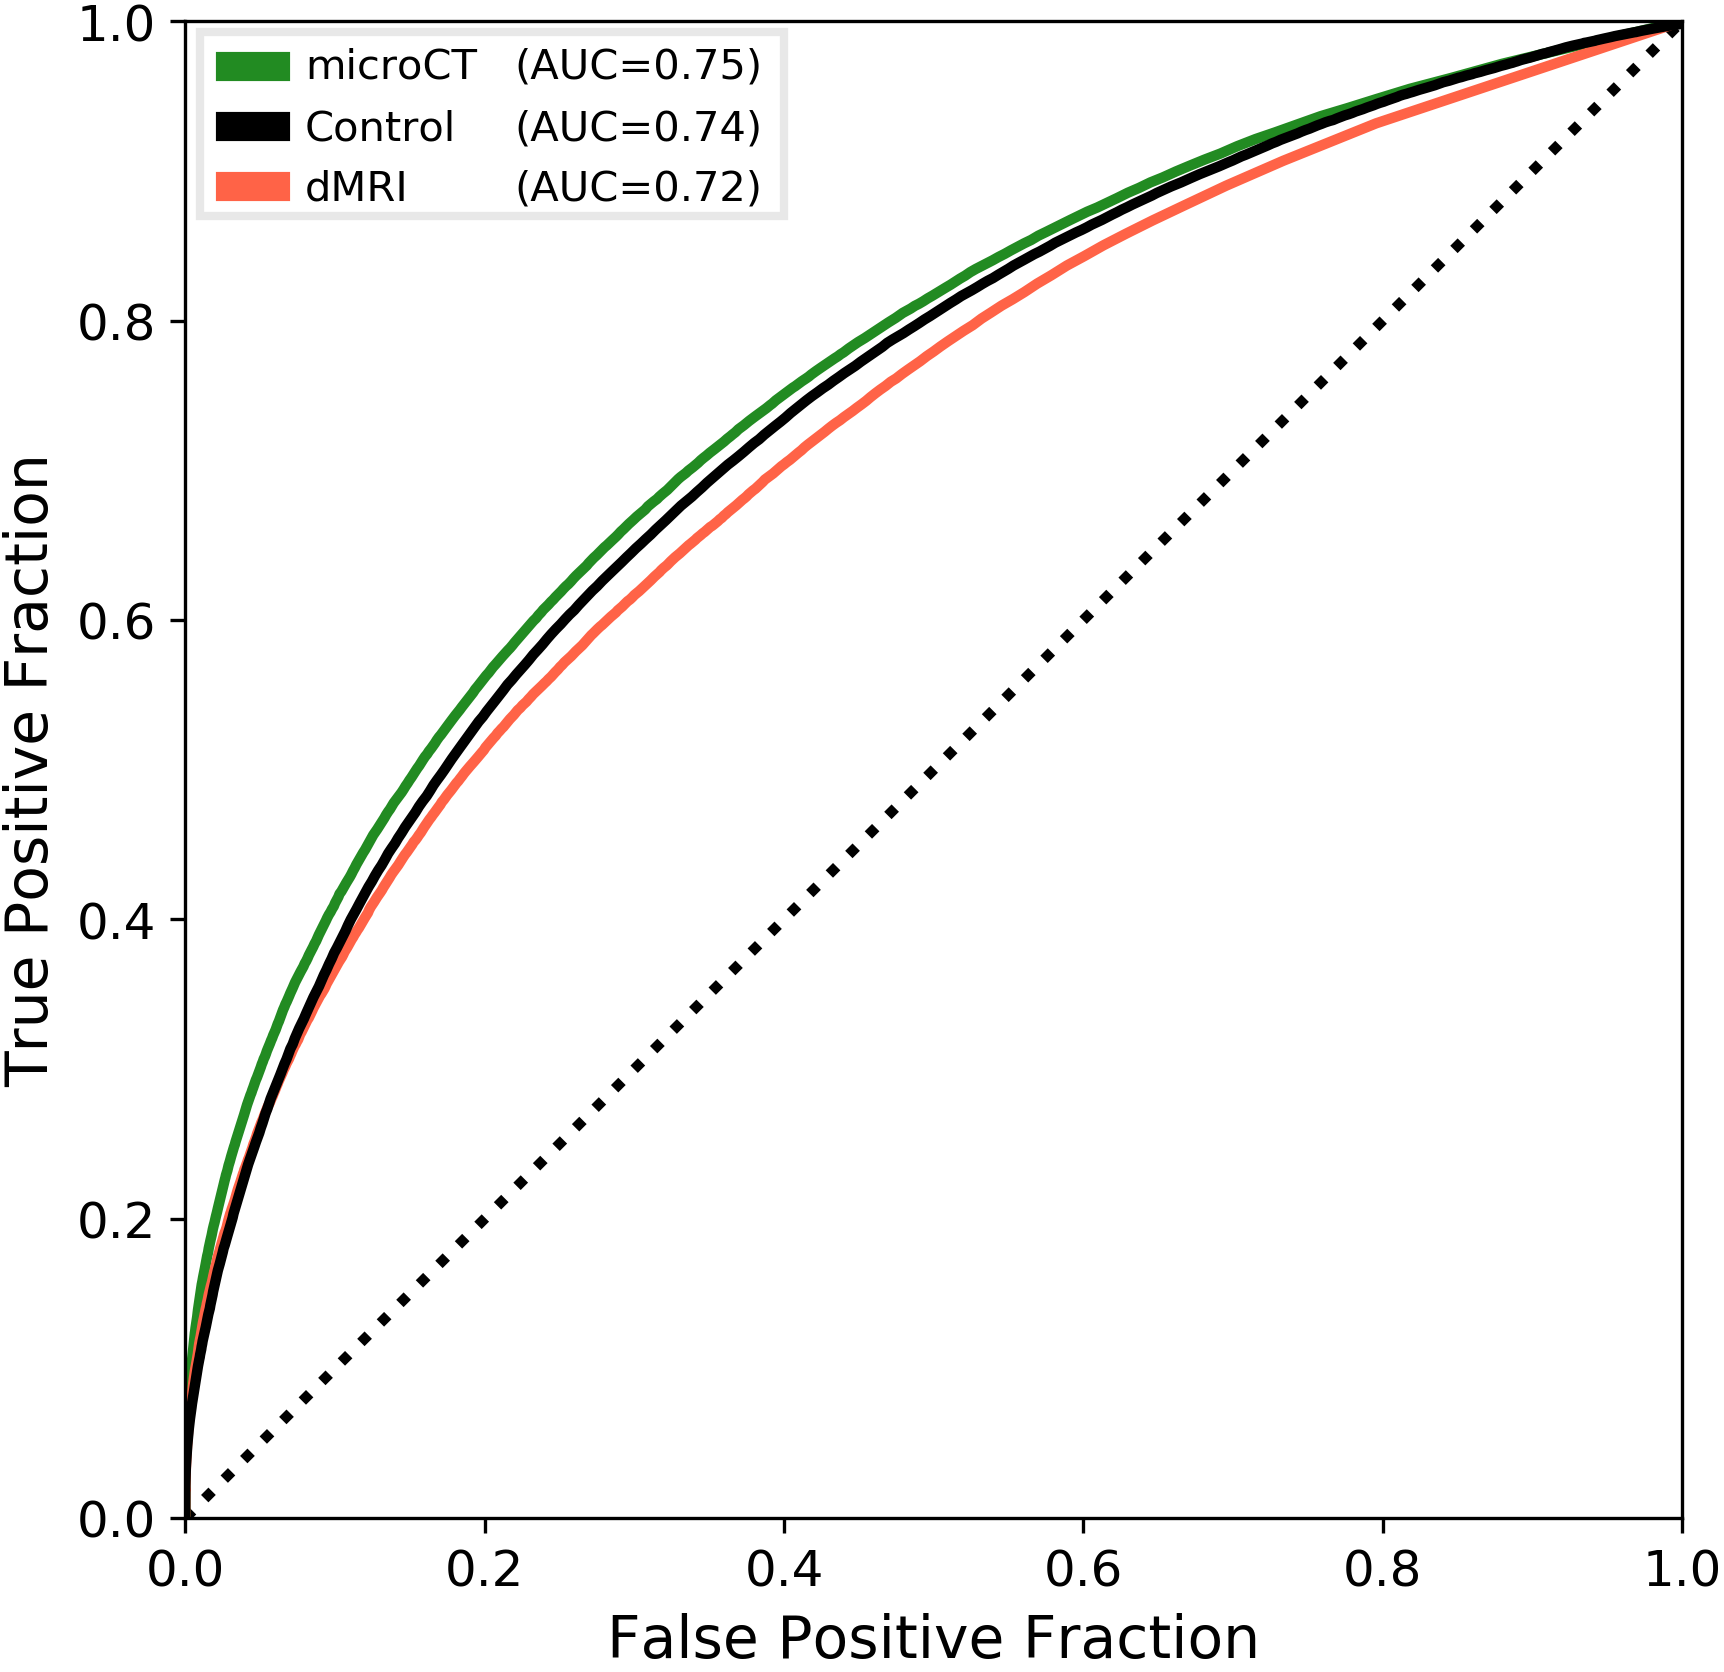
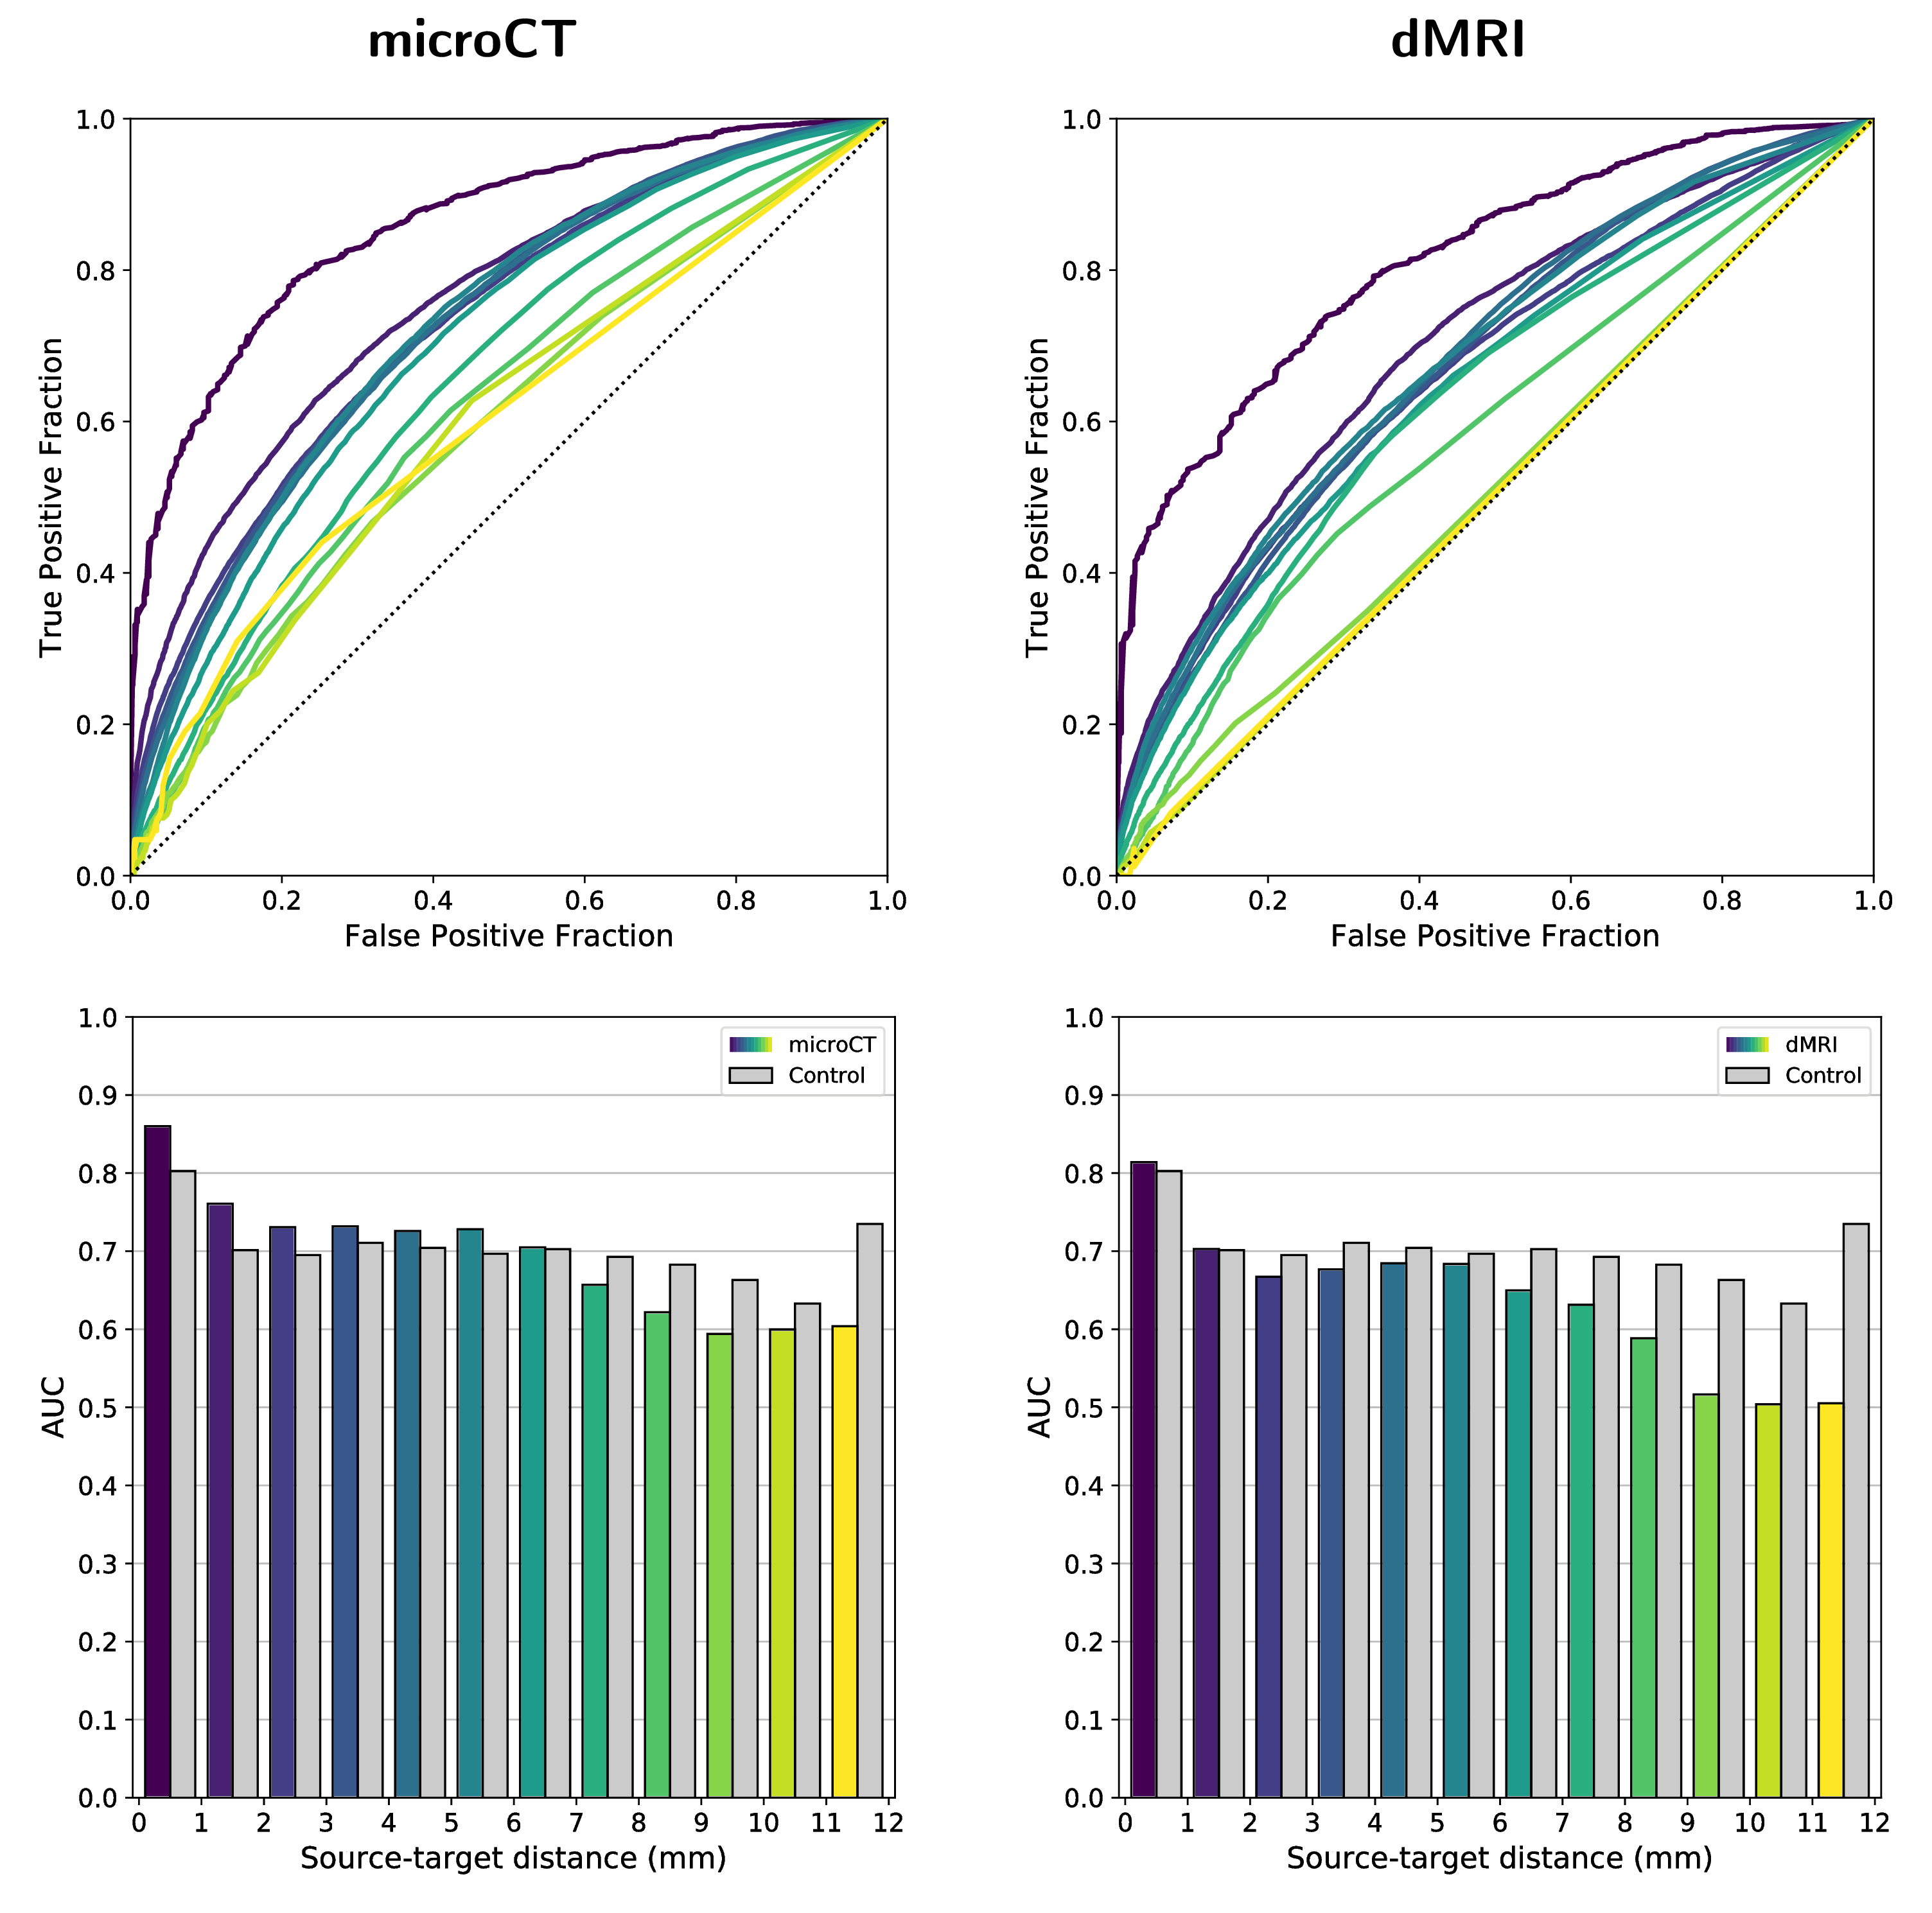
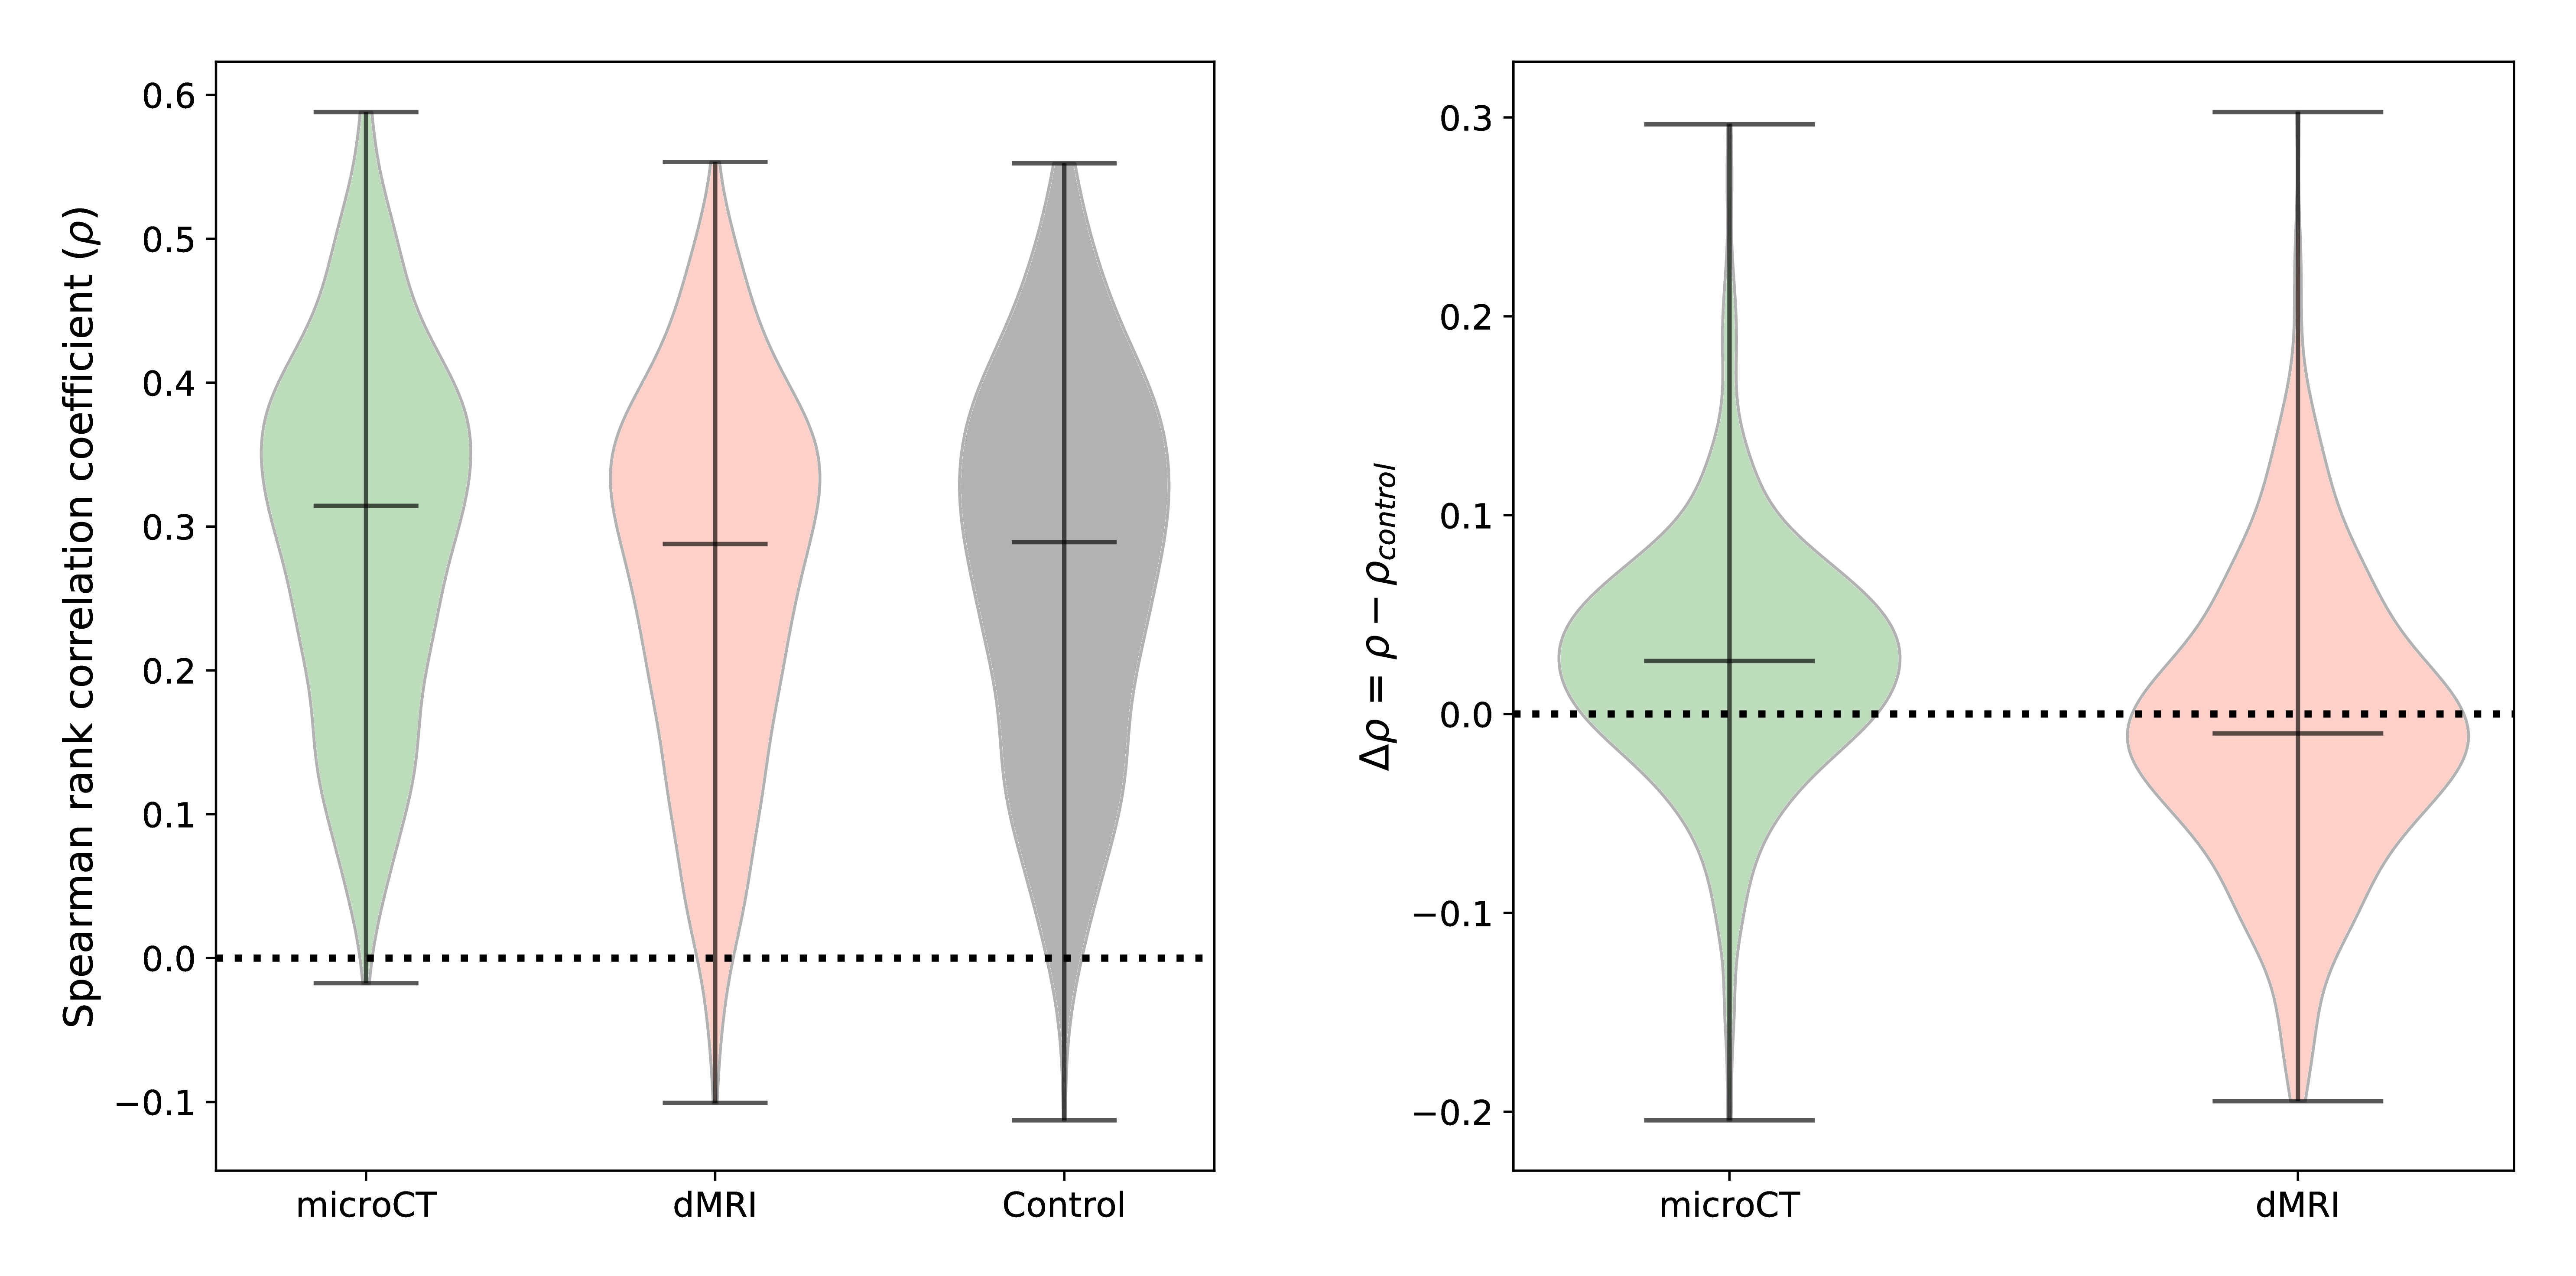
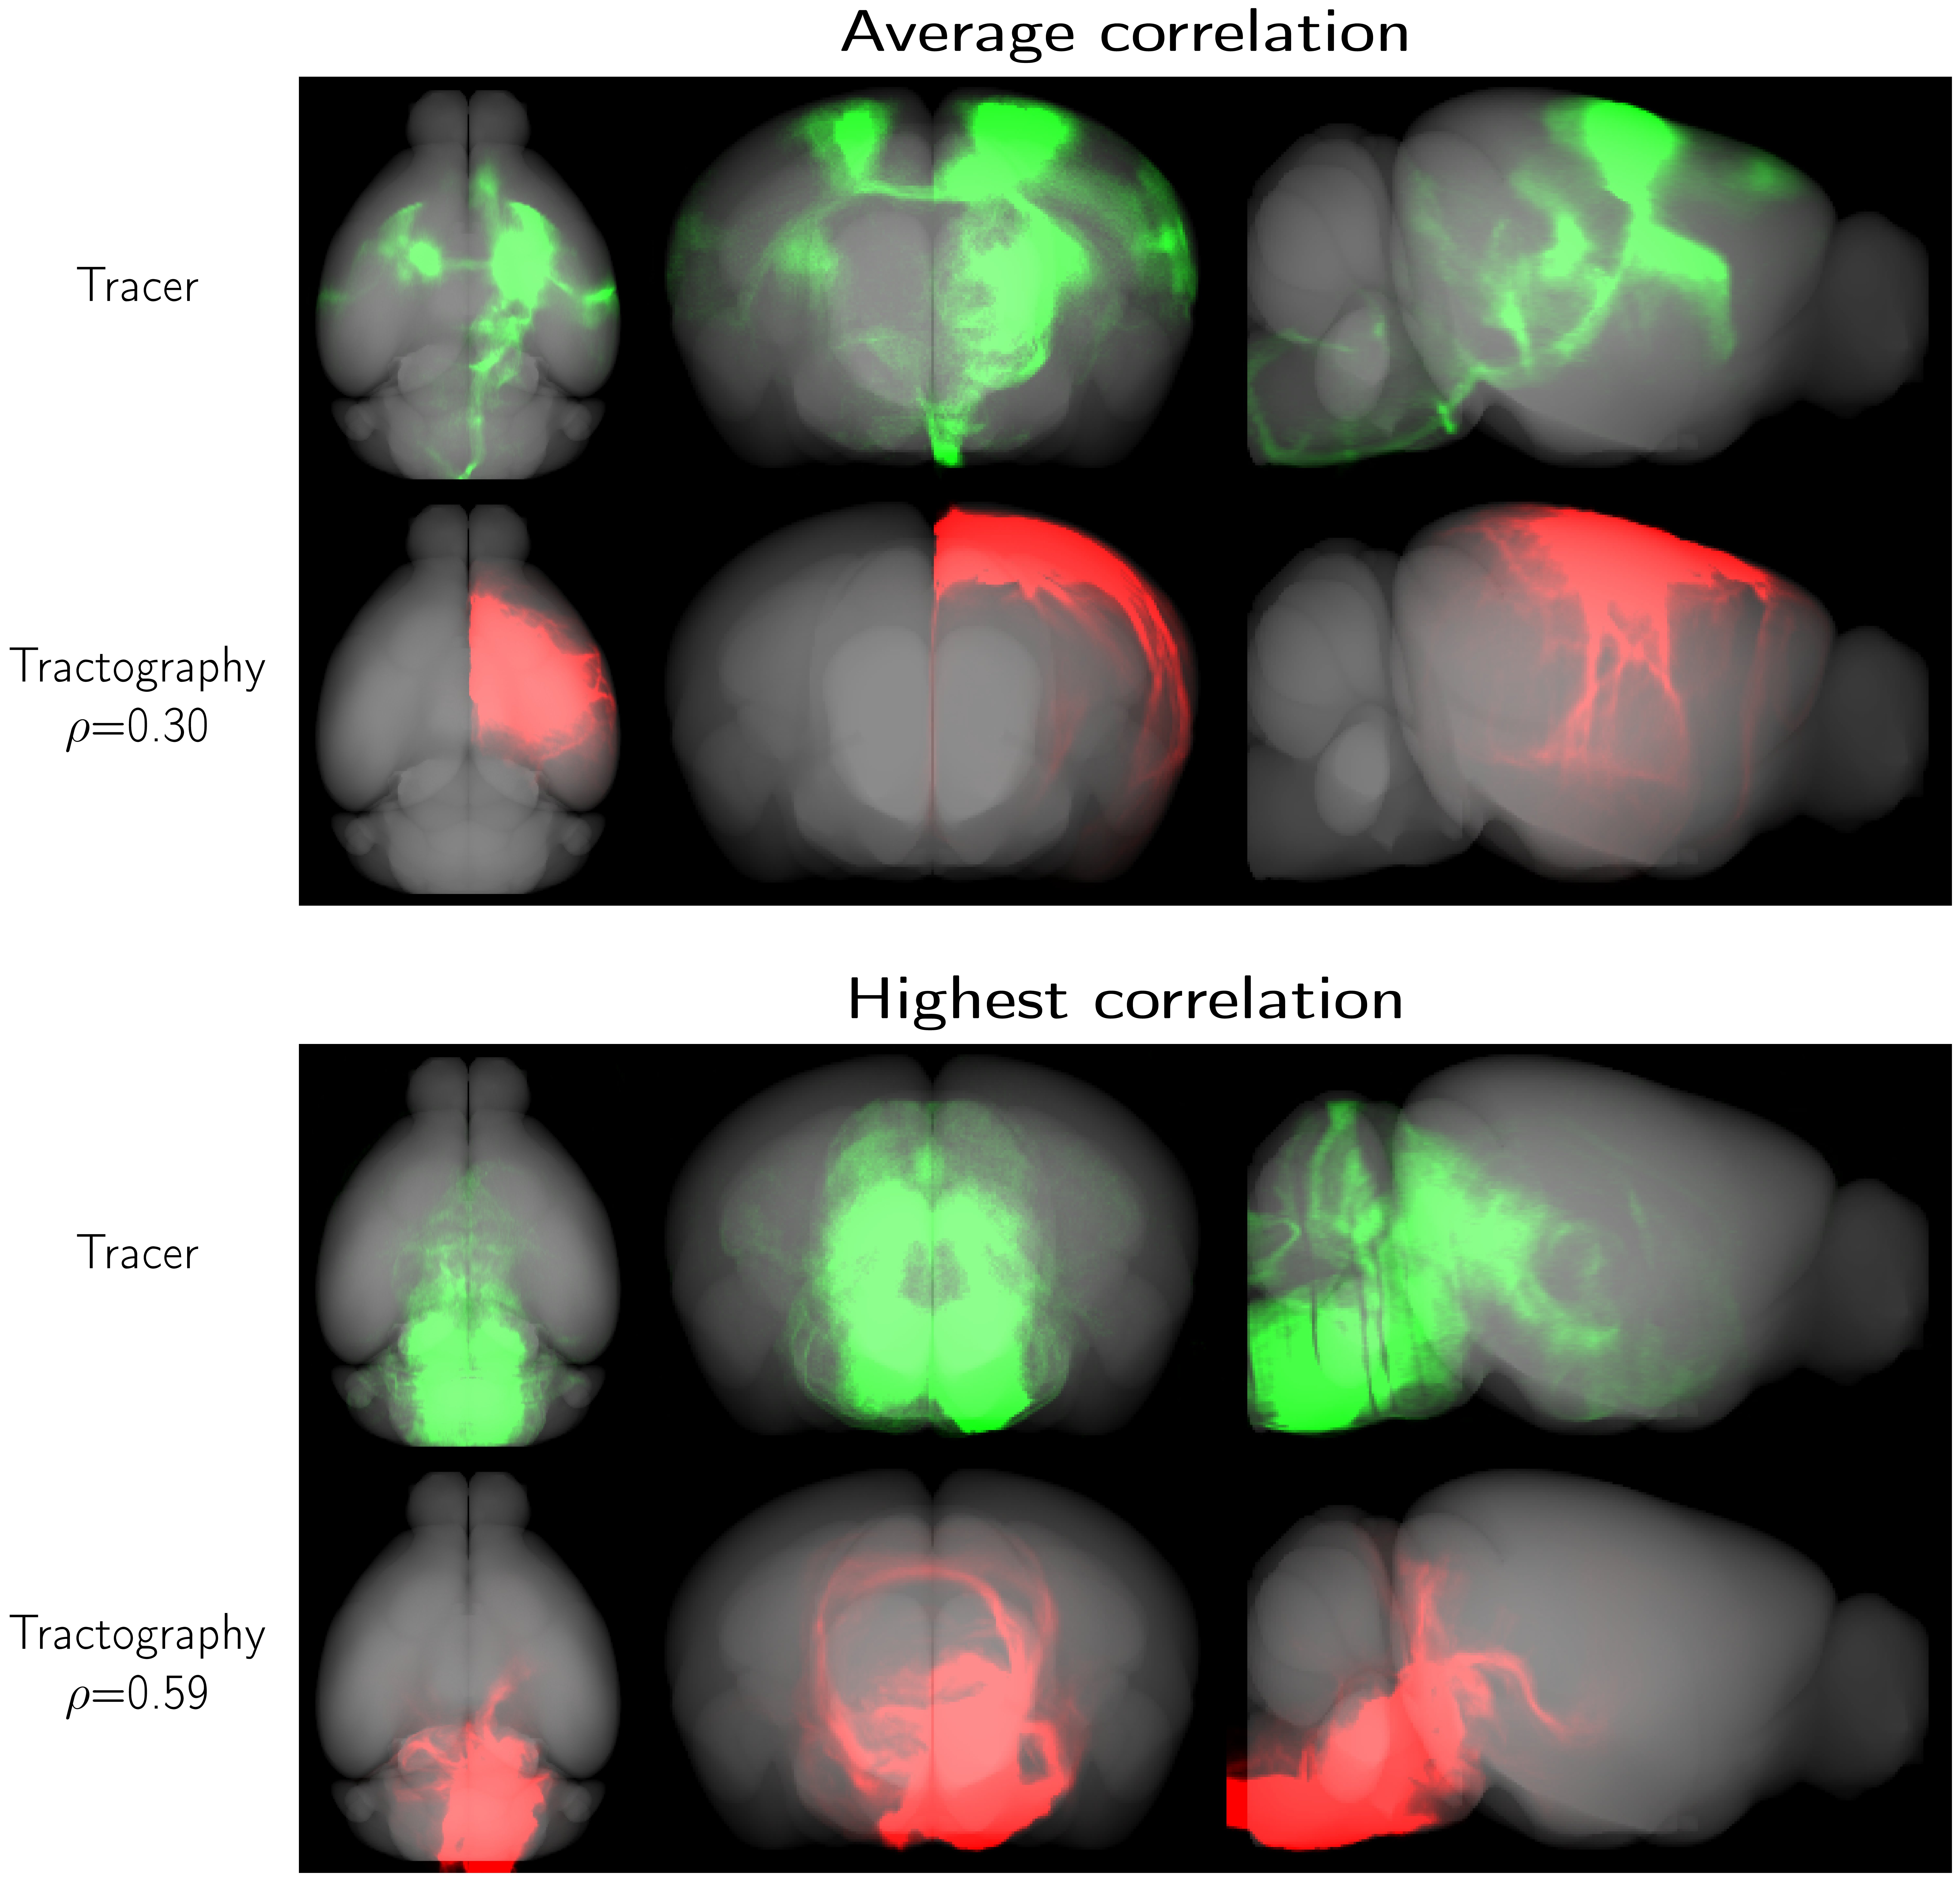
Figure 1 shows the connectivity matrices. The Spearman rank correlation coefficients between matrix values derived from tractography and from tracer data were ρ=0.41 for dMRI, ρ=0.47 for microCT and ρ=0.44 for the random control. At a coarser level of detail, correlations across parent structures increased to ρ=0.76 for dMRI, ρ=0.83 for microCT and ρ=0.76 for the random control. Figure 2 shows receiver operating curves (ROC) generated by sweeping the number of streamlines used to define a positive connection in the tractography-derived connectivity matrices, with AMBCA values as ground-truth. This analysis resulted in area under the curve (AUC) values of AUC=0.72 for dMRI, AUC=0.75 for microCT, and AUC=0.74 for the random control. Figure 3 shows ROC curves calculated for groups of connections binned by the Euclidean distance between the centers of mass of the source and target ROIs. The AUC values for these curves decreased with increasing distance, falling below control values after 6 mm for microCT and 2 mm for dMRI. Spearman rank correlation coefficients were also calculated between the in-brain voxels of each tractography density image and the corresponding tracer image. Figure 4 shows the distribution of these correlation values for microCT, dMRI and the random control. A paired t-test showed that the microCT coefficients were significantly greater than the control coefficients. Across all experiments, the average correlation coefficient was around ρ=0.30, while the maximum was ρ=0.59. Figure 5 shows a visual comparison of tracer and tract density images for these representative values.Discussion
The correlation coefficients for the connectivity matrices and tract density images are within the range published in similar validation studies.12,13 Along all metrics, tractography from microCT data modestly outperformed tractography from dMRI data, indicating the promise of microCT as a dMRI validation modality. However, a significant amount of mistracking still occurred for nearly all experiments. At this resolution, microCT results were only slightly better than random tracking, while dMRI results were slightly worse. In the future, this pipeline can be applied to structure-tensor ODFs binned at higher resolutions from the microCT dataset, allowing for an analysis of the “upper bound” of tractography performance using orientation data at a much higher spatial resolution than is currently achievable with dMRI.Conclusions
These results demonstrate a step towards the process of developing synchrotron microCT as a specimen-specific ground-truth connectivity modality. They also highlight the care that must be taken when interpreting tractography-derived connectivity results in light of inherent biases. The relative success of the random tractography shows that much of the tractography-derived connectivity information can be explained by geometric effects: connection strengths increase for shorter connection lengths and larger target regions. Accordingly, it is important to verify that tractography not only properly connects neurological regions of interest, but properly colocalizes with the ground-truth pathways between these regions.Acknowledgements
Research reported in this publication was supported by the National Institute Of Neurological Disorders And Stroke of the National Institutes of Health under Award Number F31NS113571. The content is solely the responsibility of the authors and does not necessarily represent the official views of the National Institutes of Health.
This work was partly funded by a Argonne National Laboratory - University of Chicago collaborative grant.
This research used resources of the Advanced Photon Source, a U.S. Department of Energy (DOE) Office of Science User Facility operated for the DOE Office of Science by Argonne National Laboratory under Contract No. DE-AC02- 06CH11357.
References
[1] A. Fornito, A. Zalesky, and M. Breakspear, “The connectomics of brain disorders,” Nature Reviews Neuroscience, vol. 16, no. 3, pp. 159–172, 2015.
[2] M. Rubinov and D. S. Bassett, “Emerging evidence of connectomic abnormalities in schizophrenia.,” The Journal of neuroscience : the official journal of the Society for Neuroscience, vol. 31, pp. 6263–5, apr 2011.
[3] T. Xie and Y. He, “Mapping the Alzheimer’s Brain with Connectomics,” Frontiers in Psychiatry, vol. 2, p. 77, jan 2012.
[4] P. J. Basser, S. Pajevic, C. Pierpaoli, J. Duda, and A. Aldroubi, “In vivo fiber tractography using DT-MRI data,” Magnetic Resonance in Medicine, vol. 44, pp. 625–632, oct 2000.
[5] K. H. Maier-Hein, P. F. Neher, J.-C. Houde, M.-A. Cˆot ́e, E. Garyfallidis, J. Zhong, et al., “The challenge of mapping the human connectome based on diffusion tractography,” Nature Communications, vol. 8, p. 1349, dec 2017.
[6] K. G. Schilling, V. Nath, C. Hansen, P. Parvathaneni, J. Blaber, Y. Gao, et al., “Limits to anatomical accuracy of diffusion tractography using modern approaches,” NeuroImage, vol. 185, pp. 1–11, jan 2019.
[7] S. W. Oh, J. A. Harris, L. Ng, B. Winslow, N. Cain, S. Mihalas, et al., “A mesoscale connectome of the mouse brain,” Nature, vol. 508, pp. 207–214, apr 2014.
[8] J.-D. Tournier, F. Calamante, and A. Connelly, “MRtrix: Diffusion tractography in crossing fiber regions,” International Journal of Imaging Systems and Technology, vol. 22, pp. 53–66, mar 2012.
[9] M. D. Budde and J. A. Frank, “Examining brain microstructure using structure tensor analysis of histological sections,” NeuroImage, vol. 63, no. 1, pp. 1–10, 2012.
[10] K. G. Schilling, V. Janve, Y. Gao, I. Stepniewska, B. A. Landman, and A. W. Anderson, “Histological validation of diffusion MRI fiber orientation distributions and dispersion,” NeuroImage, vol. 165, pp. 200–221, jan 2018.
[11] B. B. Avants, N. J. Tustison, M. Stauffer, G. Song, B. Wu, and J. C. Gee, “The Insight ToolKit image registration framework.,” Frontiers in neuroinformatics, vol. 8, p. 44, 2014.
[12] E. Calabrese, A. Badea, G. Cofer, Y. Qi, and G. A. Johnson, “A Diffusion MRI Tractography Connectome of the Mouse Brain and Comparison with Neuronal Tracer Data,” Cerebral Cortex, vol. 25, pp. 4628–4637, nov 2015.
[13] D. B. Aydogan, R. Jacobs, S. Dulawa, S. L. Thompson, M. C. Francois, A. W. Toga, H. Dong, J. A. Knowles, and Y. Shi, “When tractography meets tracer injections: a systematic study of trends and variation sources of diffusion-based connectivity,” Brain Structure and Function, vol. 223, pp. 2841–2858, jul 2018.
Figures