0852
TractLearn: a geodesic learning framework for quantitative dissection of brain bundles1School of Biomedical Engineering, University of Sydney, Sydney, Australia, 2CNRS LPNC UMR 5105, University of Grenoble Alpes, Grenoble, France, 3Laboratoire d'informatique de Grenoble, Grenoble, France, 4University of Grenoble Alpes, Grenoble, France, 5Bordeaux Universitary Hospital, Bordeaux, France, 6Sydney Imaging Lab, University of Sydney, Sydney, Australia, 7School of Aerospace, Mechanical and Mechatronic Engineering, Sydney, Australia
Synopsis
Here we present a unified framework for brain fascicles quantitative analyses by geodesic learning (TractLearn) — as a data-driven unsupervised learning task. TractLearn allows a mapping between the image high-dimensional domain and the reduced latent space of brain fascicles. Besides providing a framework to test the reliability of various brain metrics with a global overview, it allows to identify subtle quantitative alteration in disease model with small subset of patients and/or data sparsity. With this regard, TractLearn is a ready-to-use algorithm for precision medicine.
Introduction
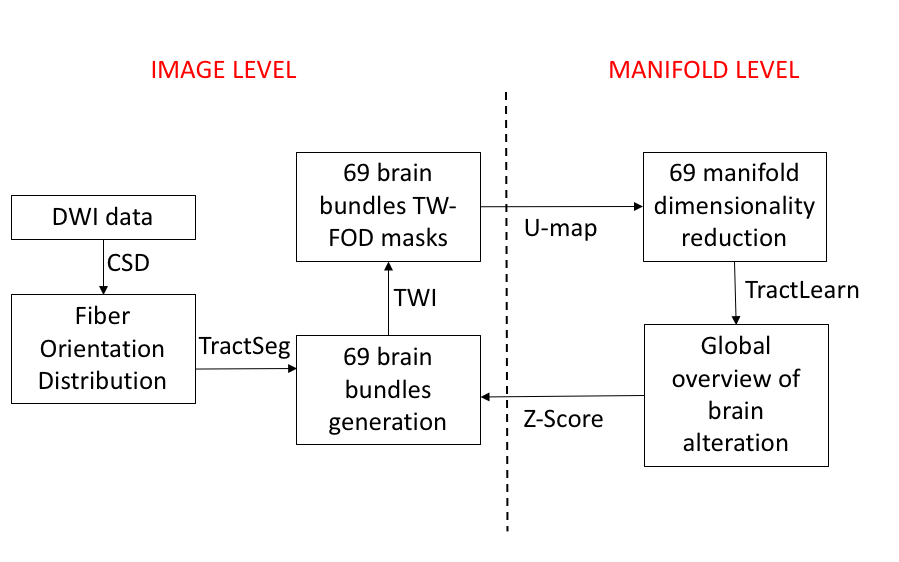
Streamlines from diffusion-weighted imaging (DWI) provide a wealth of information regarding brain structural connectivity. A deep-learning approach was recently proposed to generate major brain fascicles from fiber orientation distribution (FOD) function peaks [1]. The information contained in these local tractograms can be subsequently exploited to generate maps with different contrasts using the track-weighted imaging (TWI) framework [2]. However, statistical analyses on all quantitative values contained in each fascicle is difficult owing to the curse of dimensionality. In addition, classical voxel-based analysis doesn’t consider the global interaction between voxel modification in a dedicated bundle. Here, we propose a 3-step method to obtain a fast-quantitative analysis of all brain bundles, through their TWI contrast. Firstly, we will reduce the dimensionality of all voxels contained in each bundle, to have one point per bundle and individual in a manifold subspace. Secondly, we will learn the manifold [3,4] from our healthy controls first dataset and project onto the second retest dataset to check the reliability. Finally, we propose to mathematically detect abnormalities in a trauma model by applying Z-scores to the projection of a new subject onto the same manifold.METHODS
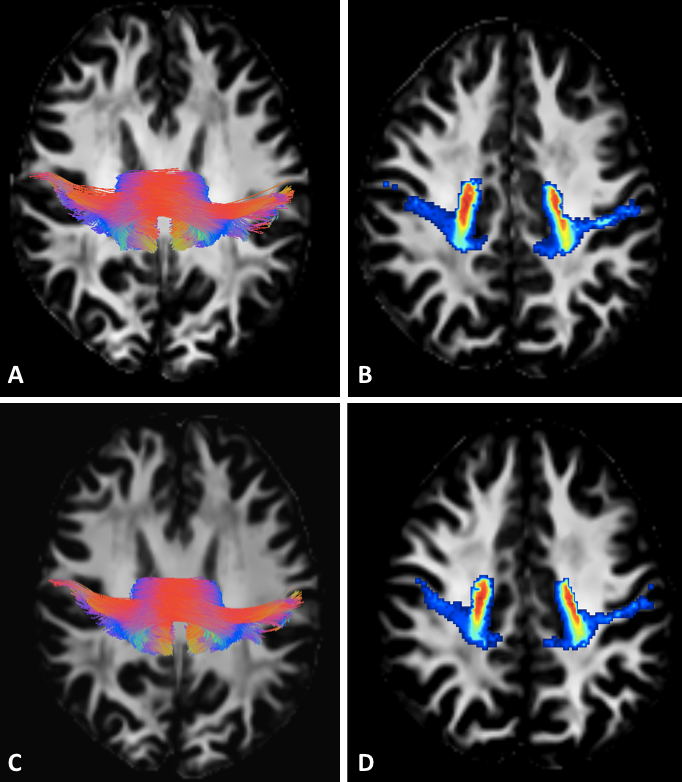
20 healthy males (age=20.9±3.3) were scanned on a 3T Siemens Prisma scanner: high-angular resolution, multi-shell DWI acquired for each subject over two sessions (12 months apart). 5 patients referred with mild traumatic brain injury were also included with the same protocol.Preprocessing included denoising [5], eddy current and motion correction [6], bias field and Gibbs artifacts’ corrections [7], and up-sampling to 1 mm3 [8]. FODs were computed using Spherical Deconvolution [9] in MRtrix3 (www.mrtrix.org). TractSeg (https://github.com/MIC-DKFZ/TractSeg) used pre-trained DWI data to reconstruct 72 discrete bundles [1]. For each bundle, we calculated the mean TW-FOD, which was computed using the FODs in the TWI framework [2]).
Modeling brain fascicles with TractLearn
We use the strategy developed in [4, 10] to localize an anomaly among TractSeg fascicles, which can be summarized as follow:
1/Dimensionality reduction to convert collection of voxels quantitative values from each bundle into a unique point in a manifold subspace. Here we have used U-map [11].
2/ We built an atlas based on healthy controls dataset: Y=f(x)+epsilon. Y being healthy control data in real space (ie. TWI values extracted from each bundle), x the corresponding point in the reduced space and epsilon the residuals. f will be the regression equation between the reduced space and the natural space. To ensure robustness, epsilon was estimated using a leave-one-out strategy.
3/ Any new subject (retest or mTBI patient) will be "projected" onto the learned manifold representing the normal controls. The projection f will correspond to the image closest to that of the tested subject, while belonging to the normal controls manifold.
We consider that the residual epsilon is representative of any abnormalities present in a new subject when it is greater than the model variability learned during the leave-one-out on controls. A bootstrap method was applied to estimate the uncertainty of the distance distribution, by randomly selecting inter and intra-individual distance in the manifold. We finally identified altered voxels in each fascicle by applying a Z-Score, with threshold corresponding to p<0.01 (Figure 1).
RESULTS
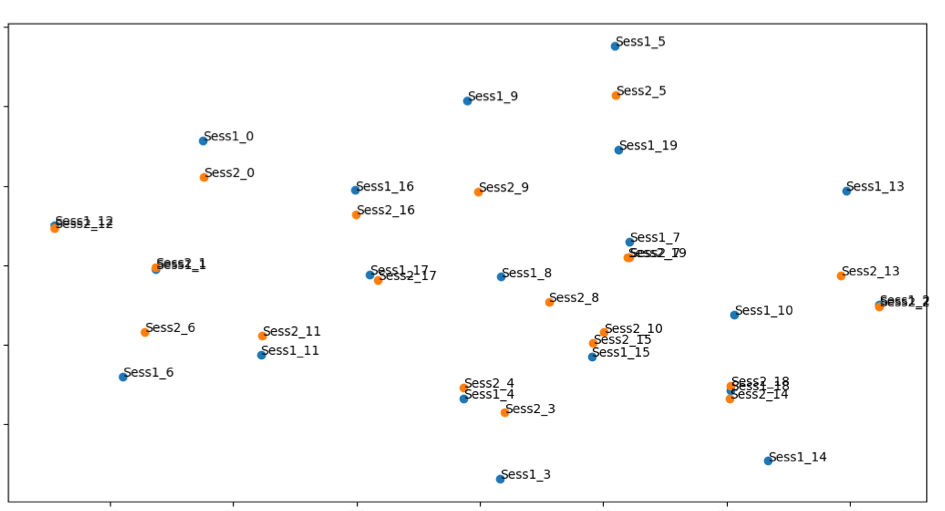
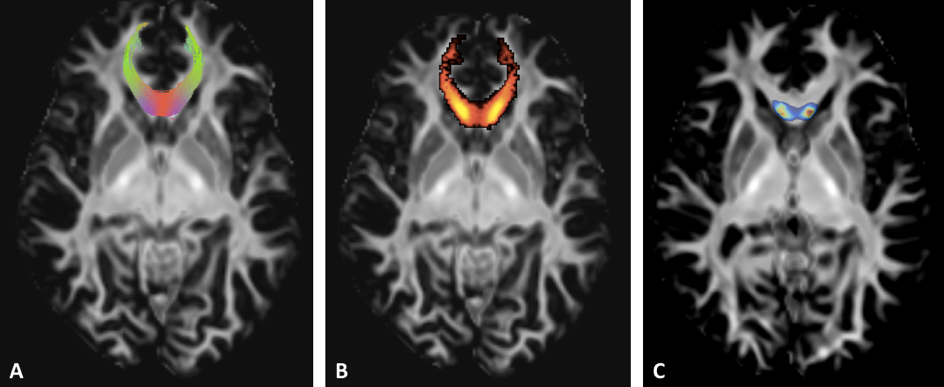
69 of 72 brain bundles were successfully-reconstructed in all subject using TractSeg. We have then extracted voxel values from 69 tract masks in all subject to project in the manifold subspace (Figure 2).Using TractLearn, the distance in the geodesic space for one bundle was significantly shorter between the test and the retest procedure (same subject) than between two different subjects (p<0.001) (Figure 3). In the mTBI cohort, we have identified significantly altered Z-Score in 3 out of 5 subjects. Subjects 1 and 2 presented voxels alterations in Corpus Callosum sub-divisions 1 (CC1), CC2 and CC5 for the former (figure 4); CC2 and CC3 for the latter. Subject 5 presented alterations in left corticospinal tract (p<0.01).
DISCUSSION
TractLearn demonstrates high test-retest values, and allowed detecting white matter abnormalities in the corpus callosum of 2 mTBI subjects, and in the corticospinal tract of a further patient. The injuries location are compatible with the known pathophysiology of mTBI [12, 13].In addition, we propose a new statistical test for the evaluation of a collection of biomarkers extracted from brain bundles, here employed to demonstrate the reliability of both TractSeg and the track-weighted contrast of each fascicle over time.
The demonstration relies on the vicinity of each manifold point (ie. Test and Retest points) using a bootstrap method. TWI has proved to be powerful in mapping fascicles alterations in neurodegenerative diseases [14, 15] or mild traumatic brain injury (mTBI) preclinical imaging [16] to cite a few. Yet other DWI markers could be also tested with the same framework as it only needs a collection of quantitative metrics as input.
U-map [11] has been developed to merge the visualization power of t-SNE algorithm [3] with more respect to the global structure, in our case the brain white matter bundle voxels. We also propose a generalization of the classical z-score where f(x) corresponds to the mean value. We have modeled the population by a regression function instead of a unique sample [4].
Acknowledgements
The Grenoble MRI facility IRMaGe was partly funded by the French program “Investissement d’Avenir” run by the “Agence nationale pour la recherche” (grant number: ANR-11-INBS-0006).References
1.Wasserthal J, Neher P, Maier-Hein KH (2018) TractSeg - Fast and accurate white matter tract segmentation. NeuroImage 183:239–253. https://doi.org/10.1016/j.neuroimage.2018.07.070
2.Calamante F (2017) Track-weighted imaging methods: extracting information from a streamlines tractogram. Magma N Y N. https://doi.org/10.1007/s10334-017-0608-1
3.Tenenbaum JB, de Silva V, Langford JC (2000) A global geometric framework for nonlinear dimensionality reduction. Science 290:2319–2323. https://doi.org/10.1126/science.290.5500.2319
4.Tilquin F, Faisan S, Heitz F, et al (2019) Anomaly Detection in Single Subject vs Group Using Manifold Learning. In: ICASSP 2019 - 2019 IEEE International Conference on Acoustics, Speech and Signal Processing (ICASSP). pp 2867–2871
5.Veraart J, Novikov DS, Christiaens D, et al (2016) Denoising of diffusion MRI using random matrix theory. NeuroImage 142:394–406. https://doi.org/10.1016/j.neuroimage.2016.08.016
6.Andersson JLR, Skare S, Ashburner J (2003) How to correct susceptibility distortions in spin-echo echo-planar images: application to diffusion tensor imaging. NeuroImage 20:870–888. https://doi.org/10.1016/S1053-8119(03)00336-7
7.Tustison NJ, Avants BB, Cook PA, et al (2010) N4ITK: improved N3 bias correction. IEEE Trans Med Imaging 29:1310–1320. https://doi.org/10.1109/TMI.2010.2046908
8.Raffelt D, Tournier J-D, Crozier S, et al (2012) Reorientation of fiber orientation distributions using apodized point spread functions. Magn Reson Med 67:844–855. https://doi.org/10.1002/mrm.23058
9.Jeurissen B, Tournier J-D, Dhollander T, et al (2014) Multi-tissue constrained spherical deconvolution for improved analysis of multi-shell diffusion MRI data. NeuroImage 103:411–426. https://doi.org/10.1016/j.neuroimage.2014.07.061
10.Vik T, Heitz F, Charbonnier P (2007) Robust pose estimation and recognition using non-gaussian modeling of appearance subspaces. IEEE Trans Pattern Anal Mach Intell 29:901–905. https://doi.org/10.1109/TPAMI.2007.1028
11.McInnes L, Healy J, Melville J (2018) UMAP: Uniform Manifold Approximation and Projection for Dimension Reduction. ArXiv180203426 Cs Stat
12.Delouche A, Attyé A, Heck O, et al (2016) Diffusion MRI: Pitfalls, literature review and future directions of research in mild traumatic brain injury. Eur J Radiol 85:25–30. https://doi.org/10.1016/j.ejrad.2015.11.004
13.Stokum JA, Sours C, Zhuo J, et al (2015) A longitudinal evaluation of diffusion kurtosis imaging in patients with mild traumatic brain injury. Brain Inj 29:47–57. https://doi.org/10.3109/02699052.2014.947628
14.Bozzali M, Parker GJM, Serra L, et al (2011) Anatomical connectivity mapping: a new tool to assess brain disconnection in Alzheimer’s disease. NeuroImage 54:2045–2051. https://doi.org/10.1016/j.neuroimage.2010.08.069
15.Ziegler E, Rouillard M, André E, et al (2014) Mapping track density changes in nigrostriatal and extranigral pathways in Parkinson’s disease. NeuroImage 99:498–508. https://doi.org/10.1016/j.neuroimage.2014.06.033
16.Tan XL, Wright DK, Liu S, et al (2016) Sodium selenate, a protein phosphatase 2A activator, mitigates hyperphosphorylated tau and improves repeated mild traumatic brain injury outcomes. Neuropharmacology 108:382–393. https://doi.org/10.1016/j.neuropharm.2016.05.001
Figures