0847
Characterizing extracellular diffusion properties using diffusion-weighted MRS of sucrose injected in the mouse brain1Molecular Imaging Research Centre (MIRCen), Commissariat à l'Energie Atomique et aux Energies Alternatives (CEA), Fontenay-aux-Roses, France, 2UMR 9199, Neurodegenerative Diseases Laboratory, Centre National de la Recherche Scientifique (CNRS), Université Paris-Sud, Université Paris-Saclay, Fontenay-aux-Roses, France, 3NIMBE/ Laboratoire de Structure et Dynamique par Résonance Magnétique (LSDRM), Commissariat à l'Energie Atomique et aux Energies Alternatives (CEA), Gif-sur-Yvette, France
Synopsis
Diffusion in the extracellular space is assessed by state-of-the-art diffusion-weighted MRS techniques following intracerebral injection of sucrose, which predominantly remains in the extracellular space. Sucrose diffusion appears to be not strictly Gaussian and different from intracellular metabolites diffusion. Signal attenuation is stronger and deviates from mono-exponential attenuation at very high b-values, suggesting the presence of some highly restricted pool. The ADC is higher and decreases when augmenting td, indicating that the tortuosity regime is not reached yet. Lastly, unlike intracellular metabolites, sucrose diffusion does not exhibit microstructural anisotropy in double-diffusion-encoding experiments.
Introduction
Unveiling tissue microstructure by diffusion-weighted MRI is fundamentally limited by the ubiquitous nature of water. How do diffusion properties in the extracellular space (ECS) differ from those in the intracellular space? Is extracellular diffusion faster or slower? Can it be considered Gaussian or not?Unlike water, most endogenous brain metabolites are intracellular, yielding specific information about intracellular diffusion when using diffusion-weighted magnetic resonance spectroscopy (DW-MRS)1. Unfortunately, no endogenous metabolite is specific of ECS. However, pioneer works proposed to inject molecules in the ECS and to measure their apparent diffusion coefficient (ADC) by DW-MRS2,3. These works concluded that extracellular and intracellular ADC were similar (for molecules of similar size).
Here we revisit extracellular diffusion using modern in vivo DW-MRS techniques. Sucrose (for which no known transporter exists in the mammal brain) is injected in the mouse brain and its diffusion properties are characterized across different diffusion modalities: high b-value attenuation, ADC up to ultra-long td, and double-diffusion encoding (DDE). DW-MRS reveals that sucrose diffusion drastically differs from intracellular metabolites diffusion.
Methods
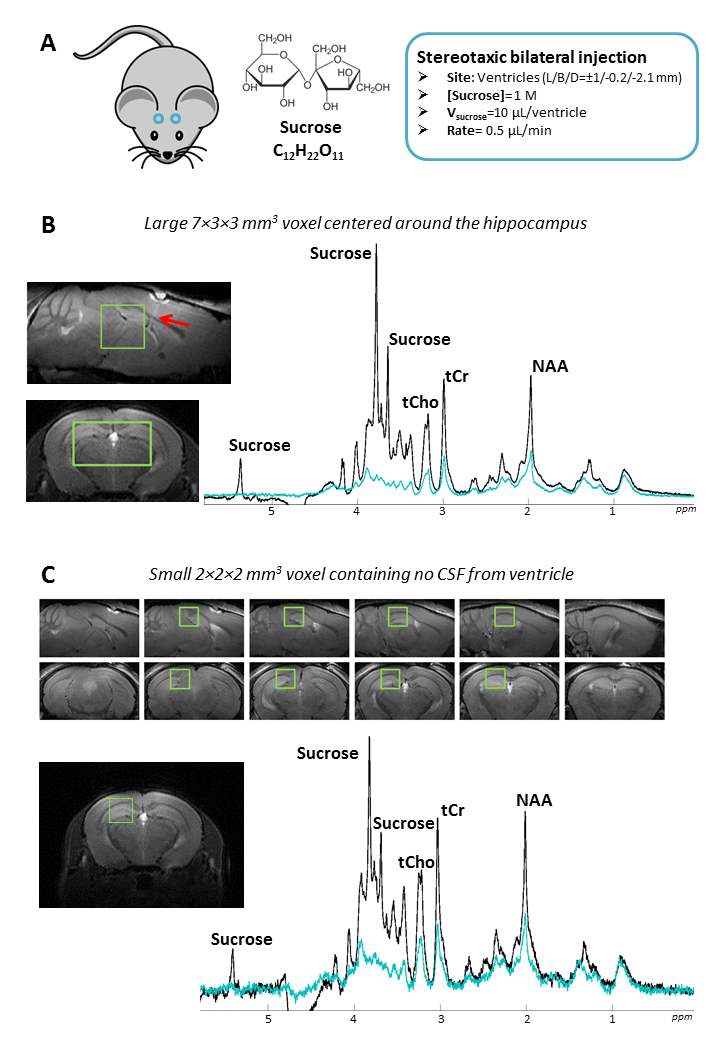
C57BL/6J mice were anesthetized and immobilized in a stereotaxic frame. Two cannulas loaded with 1M sucrose solution were inserted in the ventricles (Figure 1-A). One hour after injection, mice were scanned on an 11.7 T Bruker Scanner (Gmax=752 mT/m) using a cryoprobe. DW-MRS was performed in a 63-µL voxel carefully positioned in the hippocampus to exclude injection sites and minimize ventricle contribution. A STE-LASER sequence4 was used to measure signal up to b=20 ms/µm² at fixed td=53 ms (N=4 mice) and to measure ADC up to td=1 s (at b=3 ms/µm²) (N=4 mice). DDE was acquired using a DDE-LASER sequence5 (Δ/δ/TM=30/4.5/5.5 ms, b=2.5 ms/µm² per diffusion block) (N=4 mice). Sucrose and metabolite signals were quantified using LCModel, with experimental macromolecule signal included in the basis-set.Results
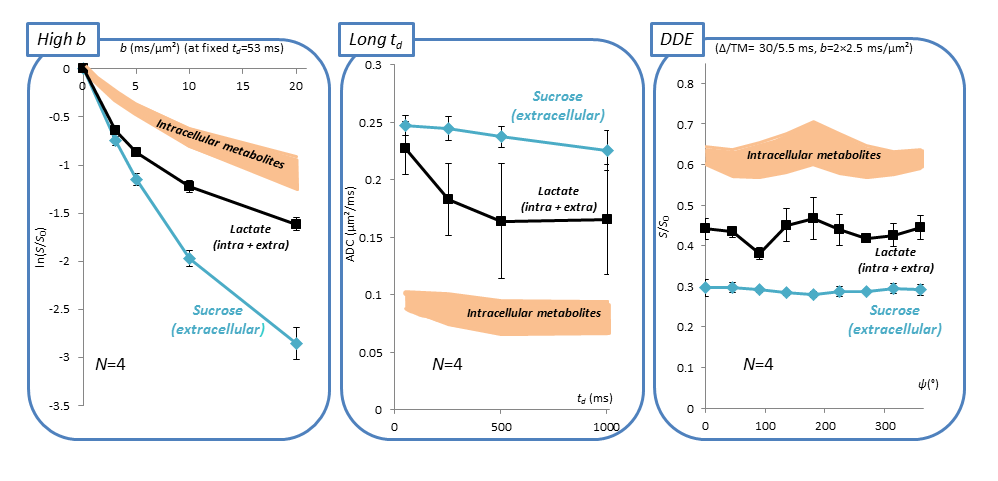
Efficient sucrose injection, fast sucrose diffusion, and limited contamination by ventricles. Figure 1-B shows the hippocampal voxel and corresponding spectra at b=0.02 and 20 ms/µm². Intense sucrose resonances are observed at 3.60-3.75-5.35 ppm. Strikingly, sucrose signal almost vanishes at b=20 ms/µm² while endogenous metabolites are still measurable, demonstrating faster diffusion of sucrose. To rule out contamination from ventricles, we acquired signal in a small 8-µL voxel far from injection sites and ventricles (Figure 1-C). Despite lower SNR, similar sucrose signal and signal drop relative to intracellular metabolites were observed, suggesting that sucrose has spread far from injection sites, and that contamination from ventricles does not bias results in the large voxel.Diffusion properties of sucrose. Figure 2 displays results for all DW-MRS experiments. At high b-values, signal attenuation is much stronger for sucrose than for intracellular metabolites. Interestingly, while sucrose signal attenuates close to mono-exponentiality at low-b, it seems to strongly deviate from mono-exponentiality at high-b, suggesting some restricted sucrose (in ECS deadspace microdomains?). Lactate, which is both intracellular and extracellular, displays some intermediate behavior. ADC values up to long td are remarkably higher for sucrose (>0.2 µm²/ms) than for intracellular metabolites (~0.1 µm²/ms). Sucrose ADC seems to decrease as td is increased, suggesting it has not reached tortuosity regime yet. Again, lactate exhibits an intermediate behavior. Finally, unlike metabolites, sucrose DDE signal does not exhibit any angular modulation, i.e. it does not exhibit microscopic anisotropy.
Discussion
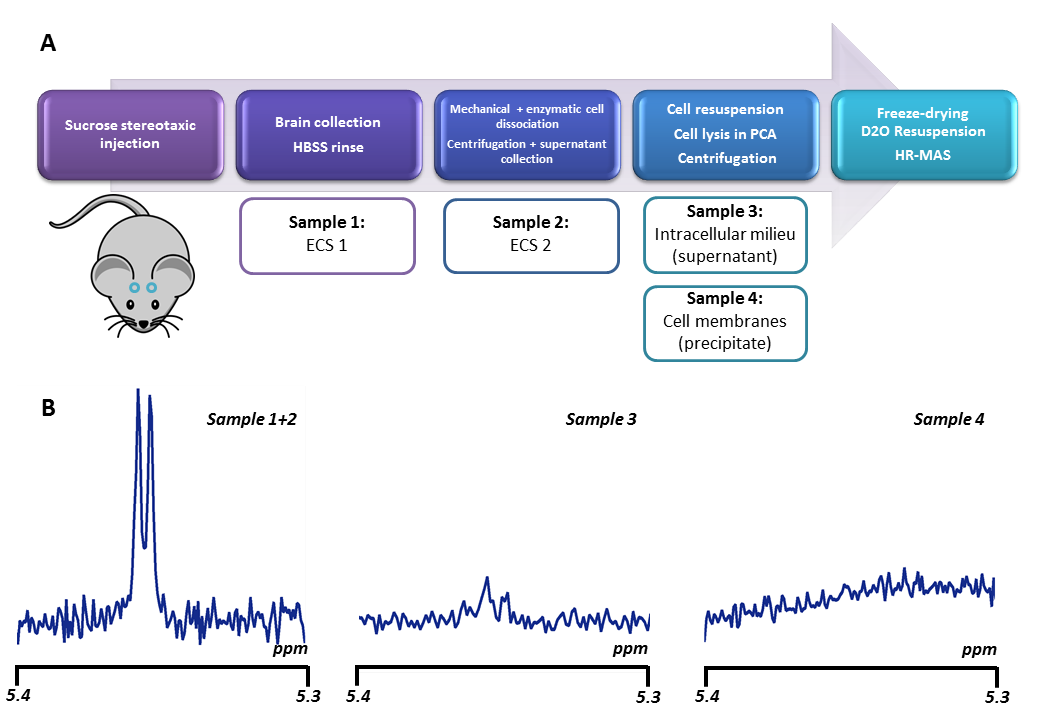
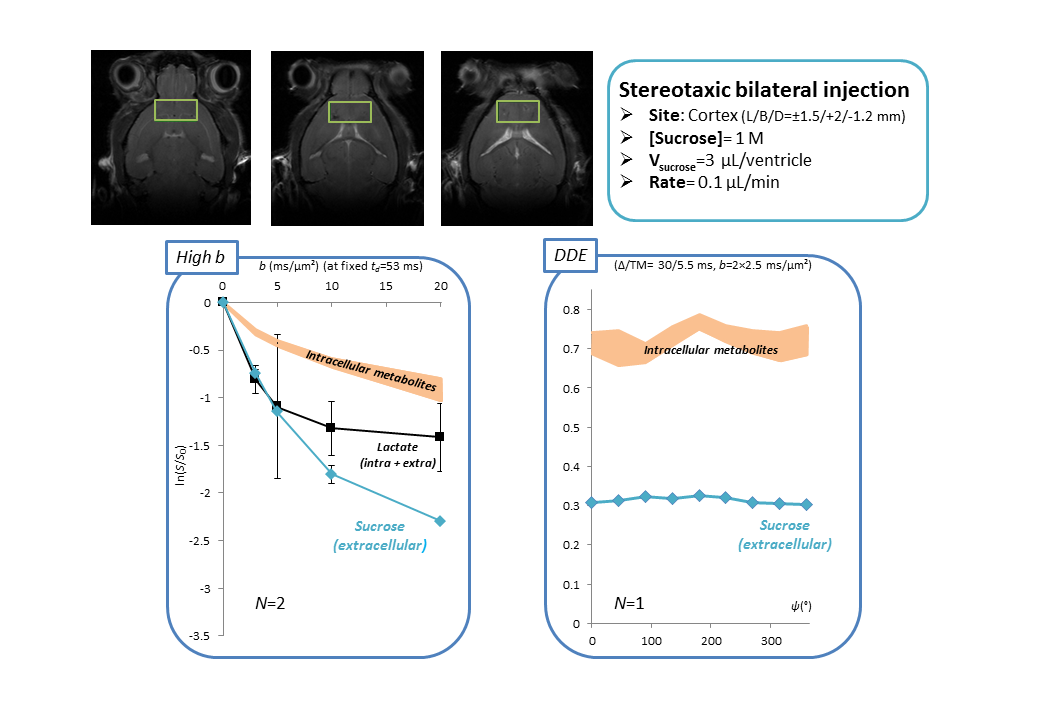
Is sucrose specific to ECS? To confirm ECS-specificity of sucrose, one mouse was sacrificed one hour following sucrose injection, and its brain dissected around the hippocampus. ECS fluid from this extract was separated from the cytosol and cell membranes thanks to a cell dissociation protocol (Figure 3). HR-MAS revealed much larger sucrose signal in the ECS, confirming that sucrose essentially remains there.Alternative injection site. To further rule out any potential contribution of ventricles, in some additional experiments (still on-going) we directly injected sucrose in a pre-frontal cortical area with no ventricle. Preliminary results indicate similar outcomes for high b-values and DDE measurements (Figure 4).
Extracellular versus intracellular ADC. While sucrose is a slightly larger molecule than intracellular metabolites, its ADC is higher. This contrasts with early works reporting similar intracellular and extracellular ADC. However we are quite confident in our results, considering the high quality of our data and the experiments we have performed to confirm that sucrose signal essentially arises from ECS fluid. Furthermore, the fact that intracellular metabolites exhibit “normal” diffusion properties (as compared to published results4-6) suggests that no major cellular alteration (e.g. due to osmotic perturbation) is induced by sucrose injection. Also, DTI maps (not shown) look normal, providing additional arguments in favor of preserved tissue microstructure.
Conclusion
Besides ADC measurement at fixed td, our study explores new territories, revealing intriguing properties for diffusion in ECS: while signal attenuation up to high b and ADC up to long td does not strictly correspond to Gaussian diffusion (in a manner that remains to be fully characterized), it appears that DDE signal modulation is flat, suggesting total loss of correlation between diffusion directions even at short TM=5.5 ms. Despite intrinsic sensitivity limitations, measuring the diffusion properties of extracellular probes using DW-MRS appears to be very fruitful and invites further research.Acknowledgements
This project has received funding from the European Research Council (ERC) under the European Union’s FP7 and Horizon 2020 research and innovation programmes (grant agreements No 336331 and 818266). The 11.7 T MRI scanner was funded by a grant from “Investissements d'Avenir - ANR-11-INBS-0011 - NeurATRIS: A Translational Research Infrastructure for Biotherapies in Neurosciences".References
1 Palombo, M., Shemesh, N., Ronen, I. & Valette, J. Insights into brain microstructure from in vivo DW-MRS. NeuroImage 182, 97-116, doi:10.1016/j.neuroimage.2017.11.028 (2018).
2 Duong, T. Q. et al. Extracellular apparent diffusion in rat brain. Magnetic resonance in medicine 45, 801-810, doi:10.1002/mrm.1108 (2001).
3 Duong, T. Q., Ackerman, J. J., Ying, H. S. & Neil, J. J. Evaluation of extra- and intracellular apparent diffusion in normal and globally ischemic rat brain via 19F NMR. Magnetic resonance in medicine 40, 1-13, doi:10.1002/mrm.1910400102 (1998).
4 Ligneul, C., Palombo, M. & Valette, J. Metabolite diffusion up to very high b in the mouse brain in vivo: Revisiting the potential correlation between relaxation and diffusion properties. Magnetic resonance in medicine 77, 1390-1398, doi:10.1002/mrm.26217 (2017).
5 Vincent, M., Palombo, M. & Valette, J. Revisiting double diffusion encoding MRS in the mouse brain at 11.7 T: which microstructural features are we sensitive to? . arXiv: 1908.00317 (2019).
6 Palombo, M. et al. New paradigm to assess brain cell morphology by diffusion-weighted MR spectroscopy in vivo. Proc Natl Acad Sci U S A 113, 6671-6676, doi:10.1073/pnas.1504327113 (2016).
Figures