0846
Characterizing the fine microstructure of cerebellar and cerebral cortex non-invasively with metabolite diffusion-weighted MRS1Centre for Medical Image Computing, Department of Computer Science, University College London, London, United Kingdom, 2Team "Movement Investigations and Therapeutics", Brain and Spine Institute - ICM, Paris, France, 3INSERM U 1127, CNRS UMR 7225, Sorbonne University, Paris, France, 4Brain and Spine Institute - ICM, Centre for NeuroImaging Research - CENIR, Paris, France
Synopsis
Diffusion-weighted magnetic resonance spectroscopy (DW-MRS) performed at ultra-high b-values enables the quantification of fine cell microstructural features such as dendritic spine density. Here, we measured in-vivo the diffusion of total N-acetyl-aspartate (tNAA) and choline compounds (tCho) in the human cerebellar and cerebral cortex at 3 T, up to a b-value of 24 ms/μm2. We used biophysical modelling and numerical simulations to interpret the metabolite signal attenuation with the b-value. The diffusion of tNAA, a mostly neuronal metabolite, is compatible with a larger presence of spines and highly restricting granular cell soma in cerebellar compared to cerebral cortex.
Introduction
This work aims at characterizing fine microstructural features of cerebellar and cerebral cortex non-invasively through diffusion-weighted spectroscopy (DW-MRS).The cerebellar cortex comprises granule and Purkinje cells, which present two microstructural features different from the cells of the cerebral cortex. Granule cells have cell bodies, namely soma, of small radius Rsoma~3 µm, while Purkinje cells have complex dendritic trees with high spine density ρspine>~2 spines/μm1,2. In contrast, the cerebral cortex is mostly characterized by pyramidal cells with bigger Rsoma>~5 µm and lower ρspine<~1 spines/μm3, and less abundant stellate/granule cells with smaller soma.
Currently, this structural complexity can be quantified in post-mortem brain using invasive techniques. These measurements have shown that fine morphological features as ρspine play an important role for synapse development/plasticity in healthy brain and diseases like autism4, essential tremor2, dementia5. However, there is still an unmet need for non-invasive techniques enabling the in-vivo quantification of such fine morphological features.
DW-MRS is a non-invasive technique able to quantify the complexity of cell morphologies with higher specificity than diffusion-weighted MRI6-16. Here, we show in-vivo DW-MRS data of the mostly neuronal metabolite N-acetyl-aspartate (tNAA) and the glial choline compounds (tCho)10,17,18 at ultra-high b-values in human cerebellar and cerebral cortex. Using biophysical and computational modelling, we provide evidence supporting DW-MRS as a potential method to quantify disease-related changes in fine cell microstructures like rspine.
Methods
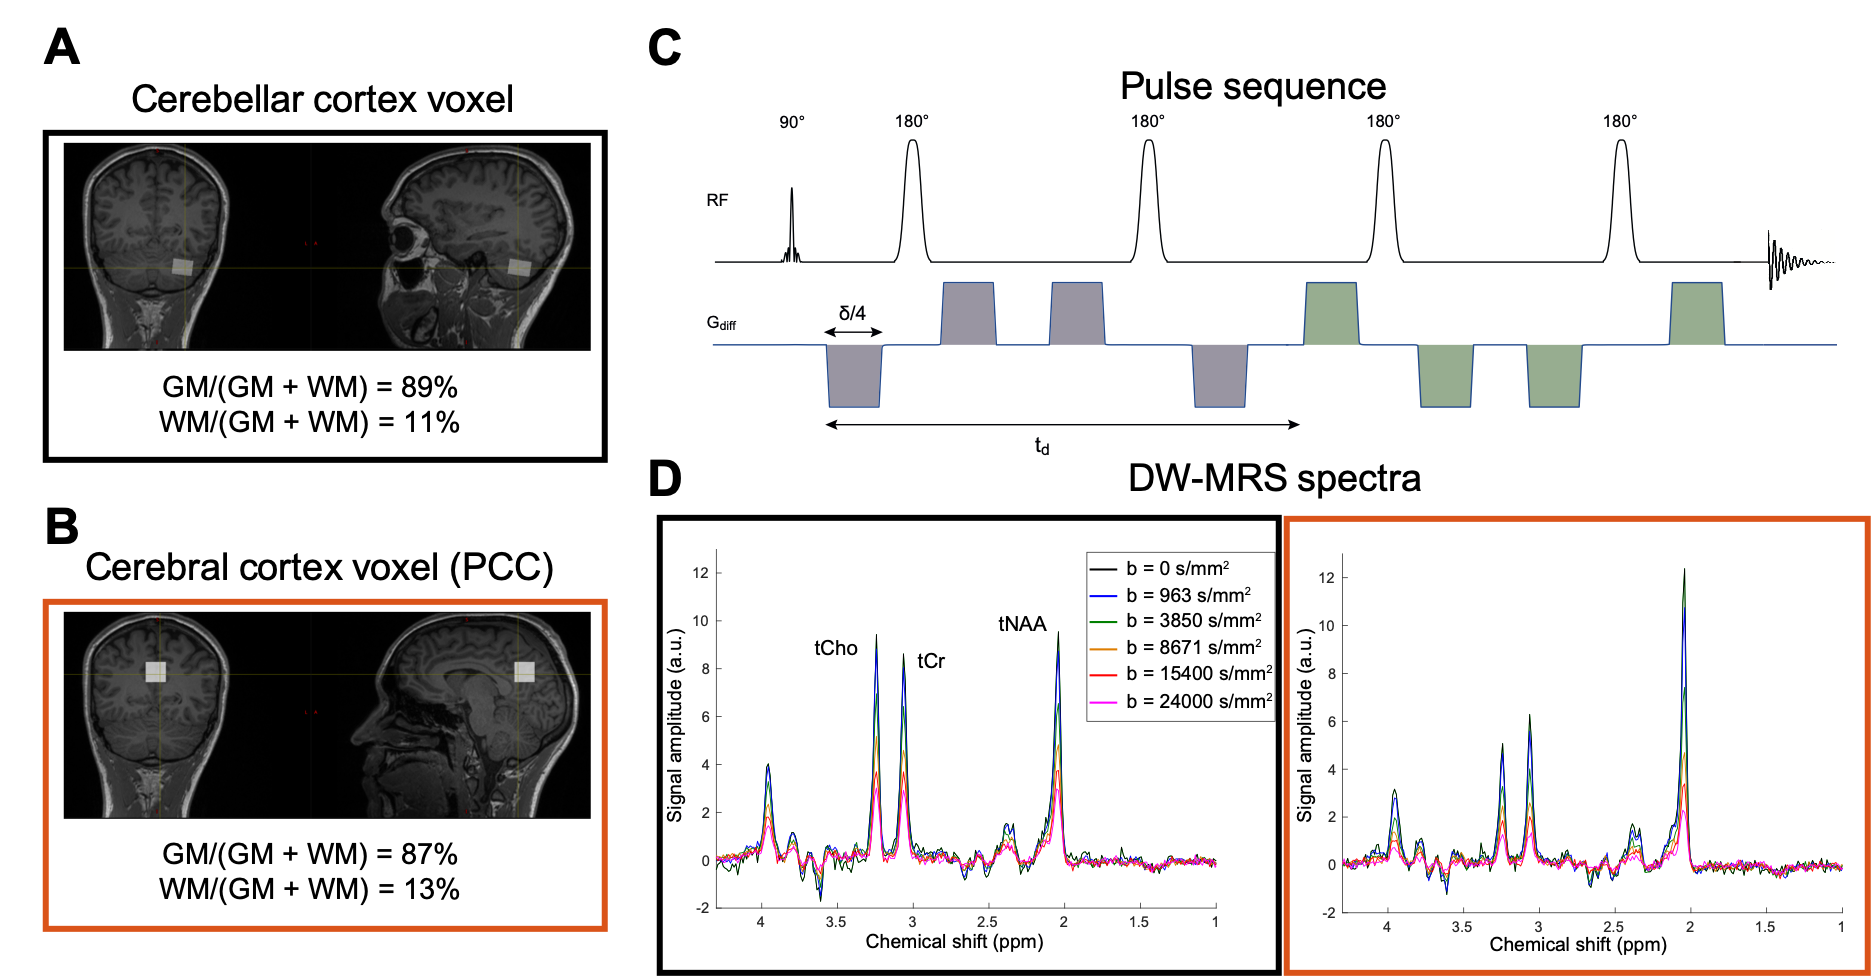
DW-MRS acquisition/processing. DW-MRS data were acquired in 4 healthy subjects using a DW-semi-LASER19(Fig.1-C) (TE/TR=125 ms/3 cardiac-cycles) at 3T (Siemens/PRISMA). Volumes-of-interest (VOI) were placed in the cerebellum (15x16x22 mm3) and in the posterior cingulate cortex (PCC, 20x20x20 mm3) (Fig.1-A,B). Diffusion weighting was applied in 4 tetrahedral directions with diffusion-time=62.5 ms and b-values=[0,0.9,3.8,8.6,15.4,24] ms/μm2 (24 averages). Unsuppressed-water data were acquired for eddy-current corrections. At each b-value, frequency/phase corrections were performed on single spectra, then averaged (Fig.1-D) before quantification using LCModel20. Signal amplitudes at each b were direction-averaged and analysed.Data analysis. To characterize metabolite diffusion, we used a model inspired by7,21-23: the DW-MRS signal from a macroscopic voxel results from metabolite protons diffusing in randomly oriented infinitely-long cylinders of diameter d, with apparent intracellular diffusivity D(D0,β,b)=D0(1-βD0b), where D0 is the metabolite intracellular diffusivity, and β a parameter similar to kurtosis introduced to account for non-Gaussian diffusion due to the presence of hindering/restricting intracellular structures21,22. Therefore:
$$S(b)/S(0)=S_{cylinder}[D(D_0,\beta,b),d,b],[1] $$
where Scylinder is given by Gaussian-phase approximation24.
To estimate D0, d and β associated with glial and neuronal compartments, we fitted Eq.[1] to the measured tCho and tNAA DW-MRS signals as functions of b-value.
Our working-hypothesis is that, given a root-mean-squared-displacement~6 μm for the diffusion time of our experiments, the cellular structures that may induce non-Gaussian effects are dendritic spines and/or soma. Other relevant features, like cell fibres’ undulation, curvature and branching occur on length scales ~10-100 μm, and should have lower impact, at least for neurons (hence tNAA). For smaller glial structures (hence tCho), these other features may contribute significantly.
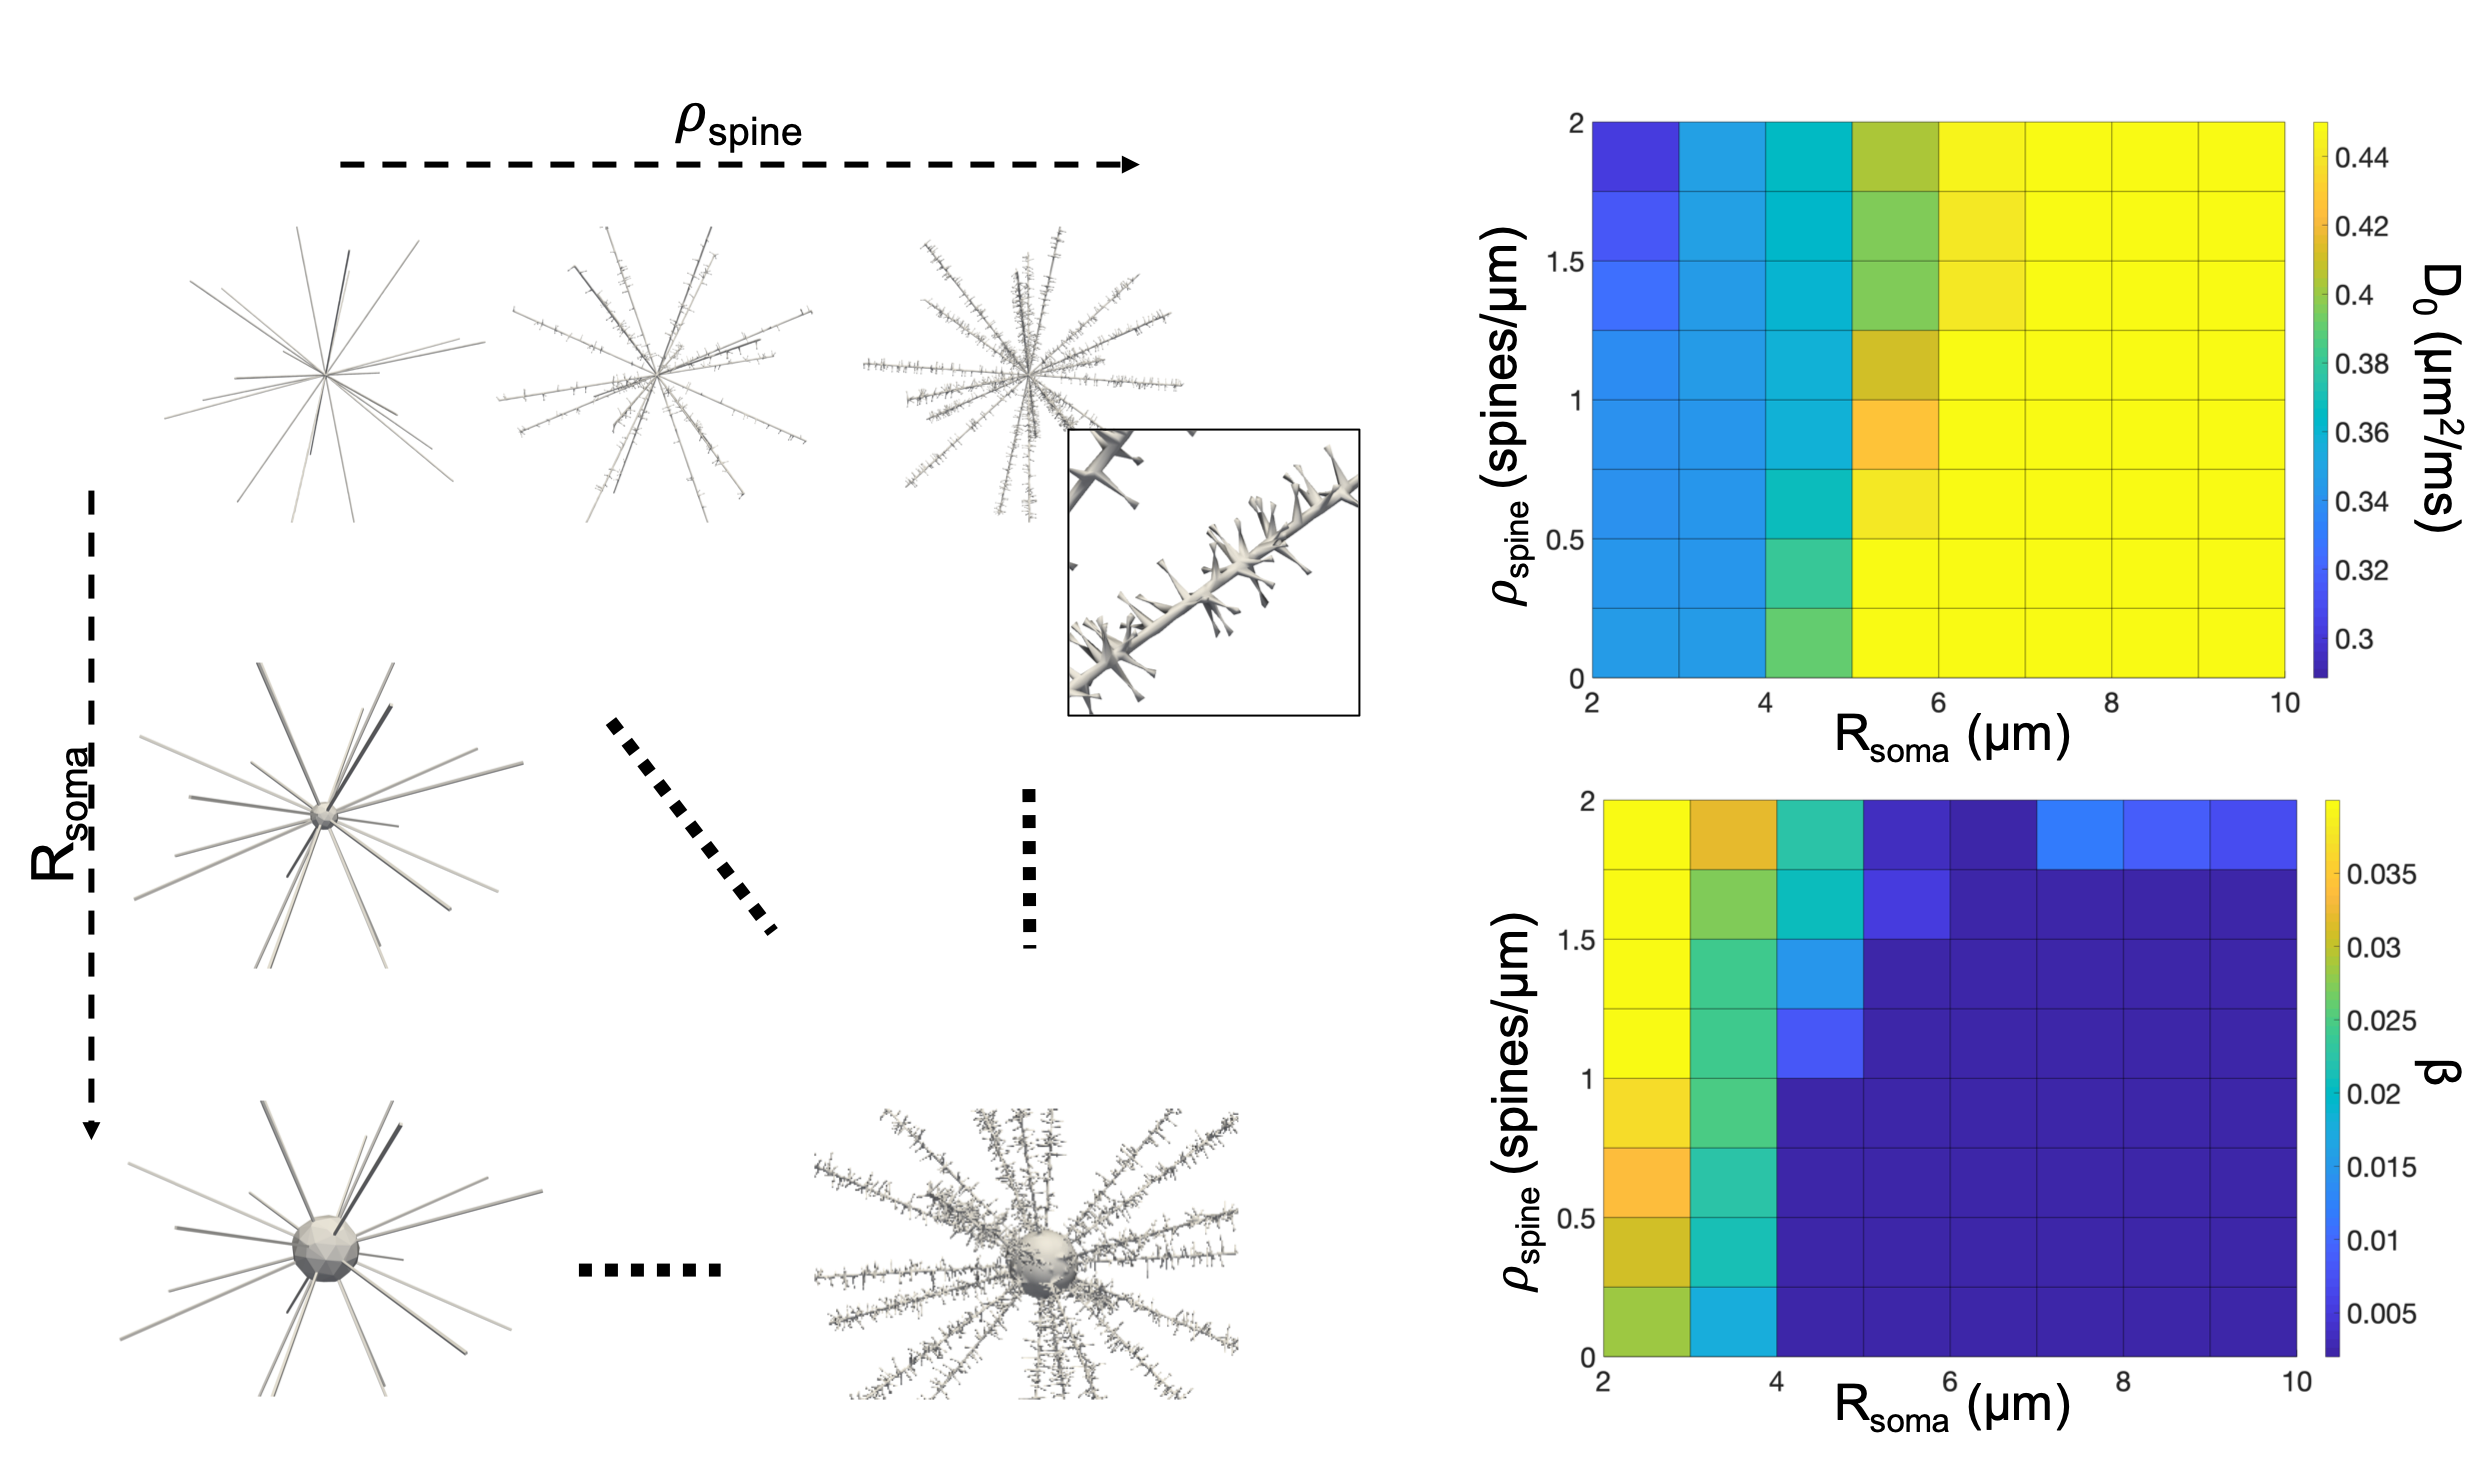
Simulations. To support our working-hypothesis, we compared tNAA and tCho experimental data with Monte-Carlo simulations. We used the advanced computational models from25 and CAMINO26 to investigate the effect of different combination of ρspine=[0–2] spines/μm and Rsoma=[2–10] μm on the diffusion of 104 particles with D0=0.45 µm2/ms and cell fibre’s d=1 μm (time-step=25 μs). From spin trajectories, the diffusion-weighted MR signal was computed by phase-accumulation using the experimental protocol and analysed using Eq.[1].
Results
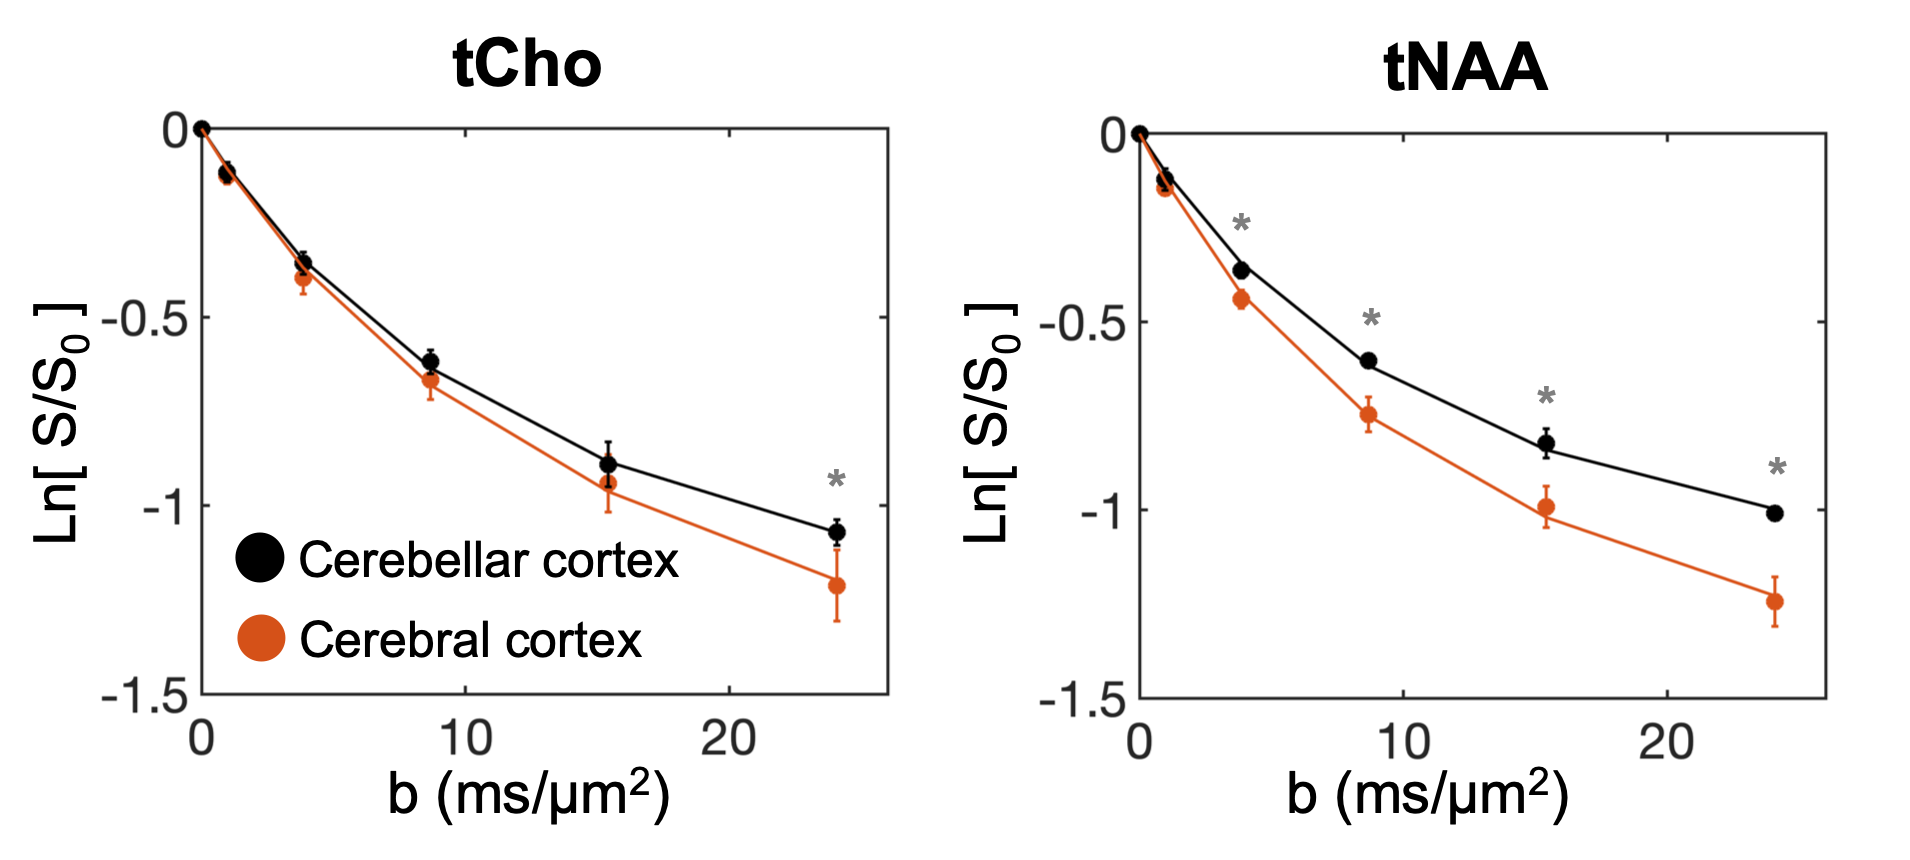
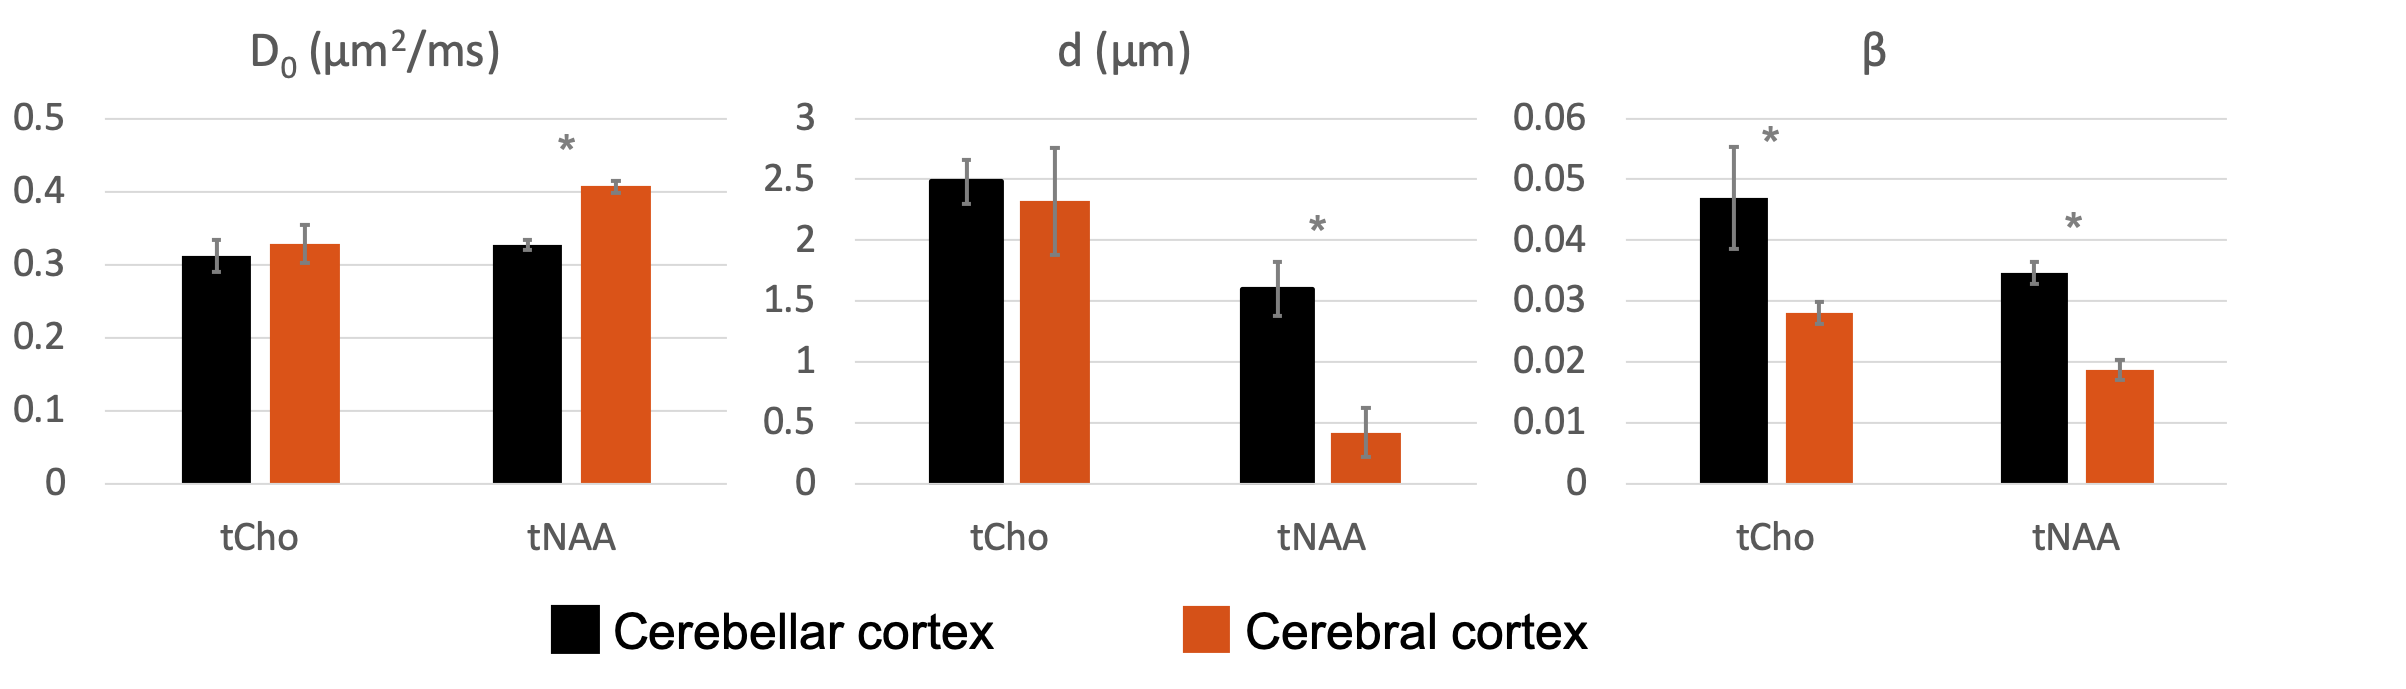
Fig.1-D shows DW spectra acquired from each VOI in one subject. We found a stronger signal attenuation (Fig.2) in the cerebral than in the cerebellar cortex for both metabolites, but significant only for tNAA.Fig.3 shows the results of our biophysical model fitting. In cerebellar compared to cerebral cortex, we estimated significantly lower D0 (P<0.001) and larger d (P<0.001) for tNAA and larger β (P<0.001) values for tNAA and tCho (paired two-tail t-test).
Fig.4 shows the simulated computational models and the predicted dependence of D0 and β on Rsoma and ρspine. We found that the combinations [ρspine~0.8 spines/μm,Rsoma~6 µm] and [ρspine~2 spines/μm,Rsoma~3 μm] can explain the estimated D0 and β values for tNAA in cerebral and cerebellar cortex, respectively.
Discussion and Conclusion
Our findings suggest that the non-gaussian diffusion of tNAA may be a marker of neuronal ρspine. Indeed, estimated D0 and β values for tNAA data are compatible with the larger ρspine and highly restricting granular soma in cerebellar compared to cerebral cortex. Furthermore, comparison with simulations suggests Rsoma compatible with cerebral pyramidal and cerebellar granule cells, and typical ρspine of cerebral pyramidal3 and cerebellar Purkinje1,2 cells. Noticeably, we also measured larger β values for tCho in cerebellar compared to cerebral cortex, which could be due to the presence of highly-arborized Bergmann glia27, specifically cerebellar. Also, estimated tNAA and tCho β values agree with other recent estimates of non-gaussianity in cerebral cortex28.Future study will aim at addressing several limitations of this work, from more simulations and histological validation to sensitivity analysis to further support DW-MRS of tNAA at high b-value as non-invasive method to estimate ρspine indices in-vivo in human.
Potential for clinical applications are many and important, from early diagnosis to informed treatment planning for diseases like essential tremor2, whose hallmarks are indeed ρspine changes in cerebellum.
Acknowledgements
This project has received funding d from Engineering and Physical Sciences Research Council (EPSRC EP/N018702/1); FB and CG acknowledge support from the programs 'Institut des neurosciences translationnelle' ANR-10-IAIHU-06 and 'Infrastructure d’avenir en Biologie Santé' ANR-11-INBS-0006. The authors would like to thank Dr. Edward J. Auerbach and Dr. Małgorzata Marjańska for providing us the DW-MRS sequence for the Siemens platform.References
1. Hoxha E, et al. (2017) Motor Deficits and Cerebellar Atrophy in Elovl5 Knock Out Mice. Front Cell Neurosci11:343.
2. Louis ED, et al. (2014) Reduced Purkinje cell dendritic arborization and loss of dendritic spines in essential tremor. Brain 137(Pt 12):3142-3148.
3. Holtmaat AJ, et al. (2005) Transient and persistent dendritic spines in the neocortex in vivo. Neuron45(2):279-291.
4. Hutsler JJ & Zhang H (2010) Increased dendritic spine densities on cortical projection neurons in autism spectrum disorders. Brain Res 1309:83-94.
5. Perez-Cruz C, et al. (2011) Reduced Spine Density in Specific Regions of CA1 Pyramidal Neurons in Two Transgenic Mouse Models of Alzheimer's Disease. Journal of Neuroscience 31(10):3926-3934.
6. Palombo M, et al. (2016) New paradigm to assess brain cell morphology by diffusion-weighted MR spectroscopy in vivo. Proc Natl Acad Sci U S A 113(24):6671-6676.
7. Palombo M, Ligneul C, & Valette J (2017) Modeling diffusion of intracellular metabolites in the mouse brain up to very high diffusion-weighting: Diffusion in long fibers (almost) accounts for non-monoexponential attenuation. Magnet Reson Med 77(1):343-350.
8. Vincent M, Palombo M, & Valette J (2019) Revisiting double diffusion encoding MRS in the mouse brain at 11.7 T: which microstructural features are we sensitive to? arXiv preprint.
9. Kroenke CD, Ackerman JJ, & Yablonskiy DA (2004) On the nature of the NAA diffusion attenuated MR signal in the central nervous system. Magn Reson Med 52(5):1052-1059.
10. Palombo M, Shemesh N, Ronen I, & Valette J (2017) Insights into brain microstructure from in vivo DW-MRS. Neuroimage.
11. Branzoli F, et al. (2016) Differentiating between axonal damage and demyelination in healthy aging by combining diffusion-tensor imaging and diffusion-weighted spectroscopy in the human corpus callosum at 7 T. Neurobiol Aging 47:210-217.
12. Ercan E, et al. (2016) Glial and axonal changes in systemic lupus erythematosus measured with diffusion of intracellular metabolites. Brain 139(Pt 5):1447-1457.
13. Lundell H, Ingo C, Dyrby TB, & Ronen I (2017) Accurate estimation of intra-axonal diffusivity and anisotropy of NAA in humans at 7T. Proc. Intl. Soc. Mag. Reson. Med. 25.
14. Najac C, Branzoli F, Ronen I, & Valette J (2016) Brain intracellular metabolites are freely diffusing along cell fibers in grey and white matter, as measured by diffusion-weighted MR spectroscopy in the human brain at 7 T. Brain Struct Funct 221(3):1245-1254.
15. Ronen I, Ercan E, & Webb A (2013) Axonal and glial microstructural information obtained with diffusion-weighted magnetic resonance spectroscopy at 7T. Front Integr Neurosci 7:13.
16. Ronen I, et al. (2014) Microstructural organization of axons in the human corpus callosum quantified by diffusion-weighted magnetic resonance spectroscopy of N-acetylaspartate and post-mortem histology. Brain Struct Funct 219(5):1773-1785.
17. Cao P & Wu EX (2017) In vivo diffusion MRS investigation of non-water molecules in biological tissues. Nmr Biomed 30(3).
18. Ronen I & Valette J (2015) Diffusion-weighted magnetic resonance spectroscopy. eMagRes 4:733–750.
19. Genovese G et al. (2018) Reproducibility and clinical feasibility of diffusion-weighted MRS using DW-sLASER and DW-STEAM in the human brain in vivo at 3T. Proceedings of the 26th Annual Meeting of ISMRM, 4447.
20. Provencher SW (1993) Estimation of metabolite concentrations from localized in vivo proton NMR spectra. Magn Reson Med 30(6):672-679.
21. Sukstanskii AL & Yablonskiy DA (2008) In vivo lung morphometry with hyperpolarized He-3 diffusion MRI: Theoretical background. J Magn Reson 190(2):200-210.
22. Yablonskiy DA & Sukstanskii AL (2010) Theoretical models of the diffusion weighted MR signal. Nmr Biomed 23(7):661-681.
23. Palombo M, Ligneul C, Hernandez-Garzon E, & Valette J (2017) Can we detect the effect of spines and leaflets on the diffusion of brain intracellular metabolites? Neuroimage.
24. Balinov B, Jonsson B, Linse P, & Söderman O (1993) The NMR Self-Diffusion Method Applied to Restricted Diffusion. Simulation of Echo Attenuation from Molecules in Spheres and between Planes J Magn Reson, Series A 104:17-25.
25. Palombo M, Alexander DC, & Zhang H (2019) A generative model of realistic brain cells with application to numerical simulation of the diffusion-weighted MR signal. Neuroimage 188:391-402.
26. Cook PA, et al. (2006) Camino: open-source diffusion-MRI reconstruction and processing. In 14th scientific meeting of the international society for magnetic resonance in medicine (Vol. 2759, p. 2759). Seattle WA, USA.
27. Sild M & Ruthazer ES (2011) Radial Glia: Progenitor, Pathway, and Partner. Neuroscientist 17(3):288-302.
28. Ingo C, Brink W, Ercan E, Webb AG, & Ronen I (2018) Studying neurons and glia non-invasively via anomalous subdiffusion of intracellular metabolites. Brain Structure & Function 223(8):3841-3854.
Figures