0843
Non-invasive mapping of non-parametric cell size distributions using MRI-cytometry
Junzhong Xu1, Xiaoyu Jiang1, Sean P Devan2, Lori R Arlinghaus1, Eliot T McKinley1, Jingping Xie1, Zhongliang Zu1, Qing Wang3, A Bapsi Chakravarthy1, Yong Wang3, and John C Gore1
1Vanderbilt University Medical Center, Nashville, TN, United States, 2Vanderbilt University, Nashville, TN, United States, 3Washingon University, St. Louis, MO, United States
1Vanderbilt University Medical Center, Nashville, TN, United States, 2Vanderbilt University, Nashville, TN, United States, 3Washingon University, St. Louis, MO, United States
Synopsis
Non-invasive mapping of cell size distribution provides a unique means to probe biological tissues. We introduce a diffusion MRI based framework that does not require prior assumptions on distribution functions to provide tissue microstructural properties including non-cell-volume-weighted cell size distributions. We validated this approach, which we call MRI-cytometry, comprehensively using computer simulations in silico, cultured cells in vitro, and animal xenografts in vivo. We then demonstrate the implementation of MRI-cytometry in imaging breast cancer patients using clinical 3T MRI, indicating its potential clinical application such as more specific assessments of tumor status and therapeutic responses.
Introduction
At the organ level, biological tissues contain a large variety of cells with distributed cell sizes. Characterizing cell sizes and their distributions provide important information on tissue status, for diagnosis of disorders, and monitoring therapeutic response. Cell size measurements by current MRI methods either provide cell-volume-weighted mean cell sizes1-3 or require special hardware to measure cell size distributions, which is usually not achievable on clinical scanners4, 5. We introduce a diffusion MRI based framework termed MRI-cytometry that does not require prior assumptions about distribution functions and provides non-parametric distributions of microstructural properties including non-cell-volume-weighted cell size distributions. We validated this method comprehensively using computer simulations in silico, cultured cells in vitro, and animal xenografts in vivo, and showed the first clinical application of MRI-cytometry in breast cancer patients.Theory
Assumptions: DWI signals arise from intra- and extracellular spaces with negligible transcytolemmal water exchange. Different from simpler models that assume single mean values of relevant properties, all microstructural parameters, including cell size $$$d$$$, intracellular diffusivity $$$D_{in}$$$, and time-dependent extracellular diffusivity ($$$D_{ex} = D_{ex0} + \beta_{ex} f $$$, where $$$f$$$ is inversely related to diffusion time) can each be distributed with arbitrary probability functions. Therefore, the signals can be written as a sum of intra- and extra-cellular signals. Note that signals from intracellular space are cell-volume-weighted. We propose a two-step fitting approach to solve this problem.MRI-cytometry step 1: We create a dictionary containing possible intra- and extracellular signal forms. Similar to previous methods5-7, we use the regularized non-negative least-squares (NNLS) analysis, namely
$$\mathop {}\nolimits_{{w_l} \ge 0}^{\arg \min } \left\{ {\sum\limits_{k = 1}^K {\sum\limits_{l = 1}^{N \times M + P \times Q} {{{\left| {{M_{kl}}{{w'}_l} - {S_k}} \right|}^2} + \xi } } \sum\limits_{l = 1}^{N \times M + P \times Q} {{{\left| {{{w'}_l}} \right|}^2}} } \right\}$$
where $$$\xi$$$ is a regularization factor empirically determined as 0.1. After the fitting, we obtain the cell-volume-weighted cell size distribution $$$P_{vw}(d)$$$ and intracellular volume fraction $$$v_{in}$$$.
MRI-cytometry step 2: Because simply converting volume-weighted $$$P_{vw}(d)$$$ to $$$P(d)$$$ is affected by noise (see Figure 2), we propose a 2nd step using NNLS to fit intracellular signals only. Another regularization factor $$$\xi_2$$$ = 0.0005 was determined empirically in step 2. After fitting, we obtain the non-volume-weighted cell size distribution $$$P({d})$$$ and other parameters such as the mean $$$\bar{d}$$$ and standard deviation $$$\sigma_d$$$ of cell size. Figure 1 shows the diagram of the two-step MRI-cytometry fitting of a simulated tissue characterized by a Gaussian cell size distribution.
Methods
MRI-cytometry is a framework that can use different diffusion acquisitions. As a proof of concept, we focused on solid tumors and used experimental parameters available on clinical MRI scanners8 to include a broad range of diffusion times and b values. All experimental parameters are the same across all three studies below.Computer simulations in silico: Monte Carlo simulations were performed on a model tissue with distributions of $$$d$$$, $$$D_{in}$$$, $$$D_{ex0}$$$, and $$$\beta_{ex}$$$ at different signal-to-noise ratios (SNR). For each SNR, the fittings were repeated 100 times each with different noise samples but at the same SNR level.
Cultured cells in vitro: Five different cell lines, i.e., MDA-MB-231, MCF7, and MDA-MB-453, Jurkat, and lymphocytes were cultured to form cell pellets for imaging. Cell size distributions obtained from MRI-cytometry and light microscopy were compared.
Animal xenografts in vivo: MDA-MB-231 and MCF-7 xenografts were induced in female Athymic nude mice and imaged on a 4.7T Varian/Agilent scanner. Histology was performed with Na+/K+-ATPase staining to obtain quantitative cell sizes to compare with imaging results.
Cancer patients in vivo: Seven breast cancer patients were scanned on a 3T Philips Achieva MRI scanner.
Results
Figure 2 shows the simulated influence of noise, at different SNR levels, on MRI-cytometry fitted distributions of microstructural parameters. Except the $$$\beta_{ex}$$$ distribution, MRI-cytometry provides reasonable estimations of parametric distributions. At lower SNRs, the calculated cell size $$$d_{cal}$$$ distribution from $$$P_{vw}(d)$$$ was significantly biased at smaller cell sizes due to the influence of noise. This bias was corrected in the $$$d$$$ distribution obtained by MRI-cytometry step 2.Figure 3 shows a comparison of MRI-cytometry and light microscopy derived $$$d$$$ distributions using cultured cells in vitro. The mean cell sizes $$$\bar{d}$$$ obtained using the two methods show good agreement while the standard deviations of cell sizes $$$\sigma_d$$$ show some discrepancies.
Figure 4 shows s comparison of MRI-cytometry and histology-derived cell size distributions of mouse MDA-MB-231 and MCF-7 tumors. The Bland-Altman plots show the agreement of MRI-cytometry and light microscopy derived $$$\bar{d}$$$ and $$$\sigma_d$$$, with limits of agreement (1.96SD) 2.2 μm and 1.4 μm, respectively.
Figure 5 shows the cell size distributions of seven breast tumors obtained in breast cancer patients in vivo. There is a good correlation between the cell-volume-weighted mean cell size $$$d_{vw}$$$ obtained using IMPULSED8 and MRI-cytometry.
Discussion and Conclusion
Using an acquisition protocol available on commercial 3T scanners and reasonable SNRs, MRI-cytometry can provide the mapping of non-parametric cell size distributions and other microstructural properties. This avoids previous oversimplified assumptions made by cell size imaging methods and provides more comprehensive information about tissue status. Potential applications of this method include a more specific assessment of tumor status and therapeutic response.Acknowledgements
The authors thank MR technologists Clair Jones, Leslie McIntosh, Christopher Thompson, and Fuxue Xin for assistance in data acquisitions, Drs. Katy Beckermann and Kirsten Young for collecting lymphocytes. This work was funded by NIH grants K25CA168936, R01CA109106, R01CA173593, UL1TR002243, S10OD021771, U01CA142565, F32CA216942, UL1TR000445, P30 CA068485, and American Cancer Society grant IRG#58-009-56.References
- E. Panagiotaki et al., Noninvasive quantification of solid tumor microstructure using VERDICT MRI. Cancer Res 74, 1902-1912 (2014).
- X. Jiang et al., Quantification of cell size using temporal diffusion spectroscopy. Magn Reson Med 75, 1076-1085 (2016).
- O. Reynaud et al., Pulsed and oscillating gradient MRI for assessment of cell size and extracellular space (POMACE) in mouse gliomas. NMR in biomedicine 29, 1350-1363 (2016).
- N. Shemesh, G. A. Alvarez, L. Frydman, Size Distribution Imaging by Non-Uniform Oscillating-Gradient Spin Echo (NOGSE) MRI. PloS one 10, e0133201 (2015).
- D. Benjamini, M. E. Komlosh, L. A. Holtzclaw, U. Nevo, P. J. Basser, White matter microstructure from nonparametric axon diameter distribution mapping. NeuroImage 135, 333-344 (2016).
- Y. Wang et al., Quantification of increased cellularity during inflammatory demyelination. Brain 134, 3590-3601 (2011).
- A. Daducci et al., Accelerated Microstructure Imaging via Convex Optimization (AMICO) from diffusion MRI data. NeuroImage 105, 32-44 (2015).
- J. Xu et al., Magnetic resonance imaging of mean cell size in human breast tumors. arXiv preprint arXiv:1905.07818, (2019).
Figures
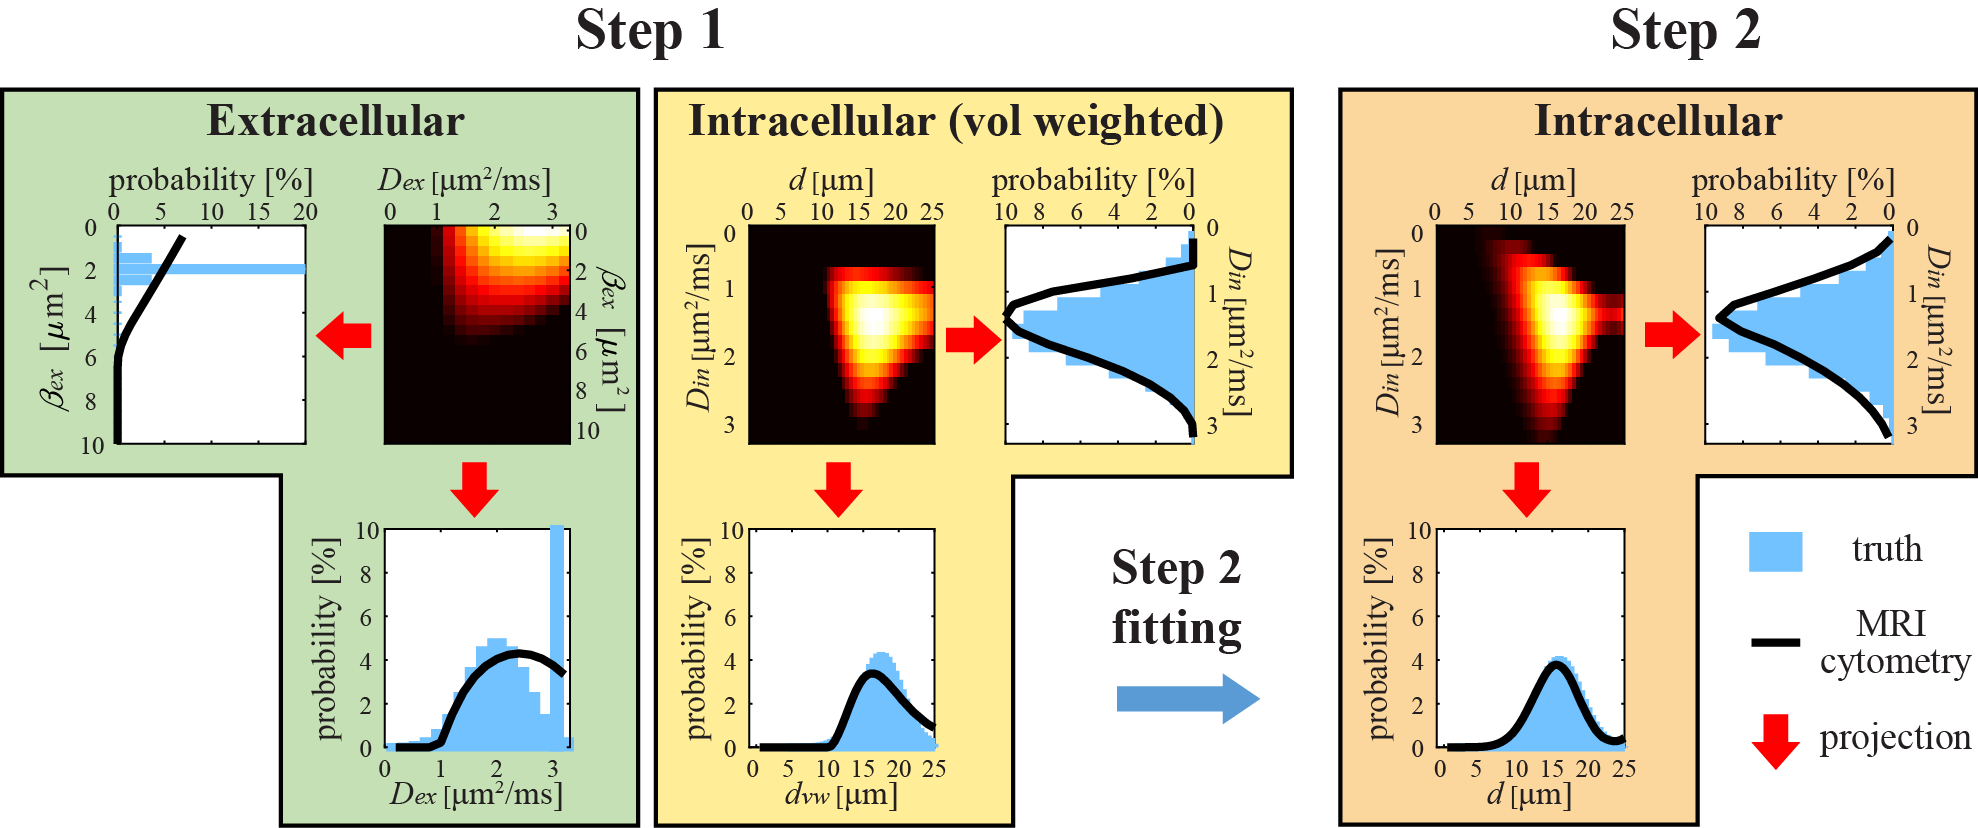
Figure 1 Diagram of two-step MRI-cytometry
fitting of a simulated tissue with a Gaussian cell size distribution
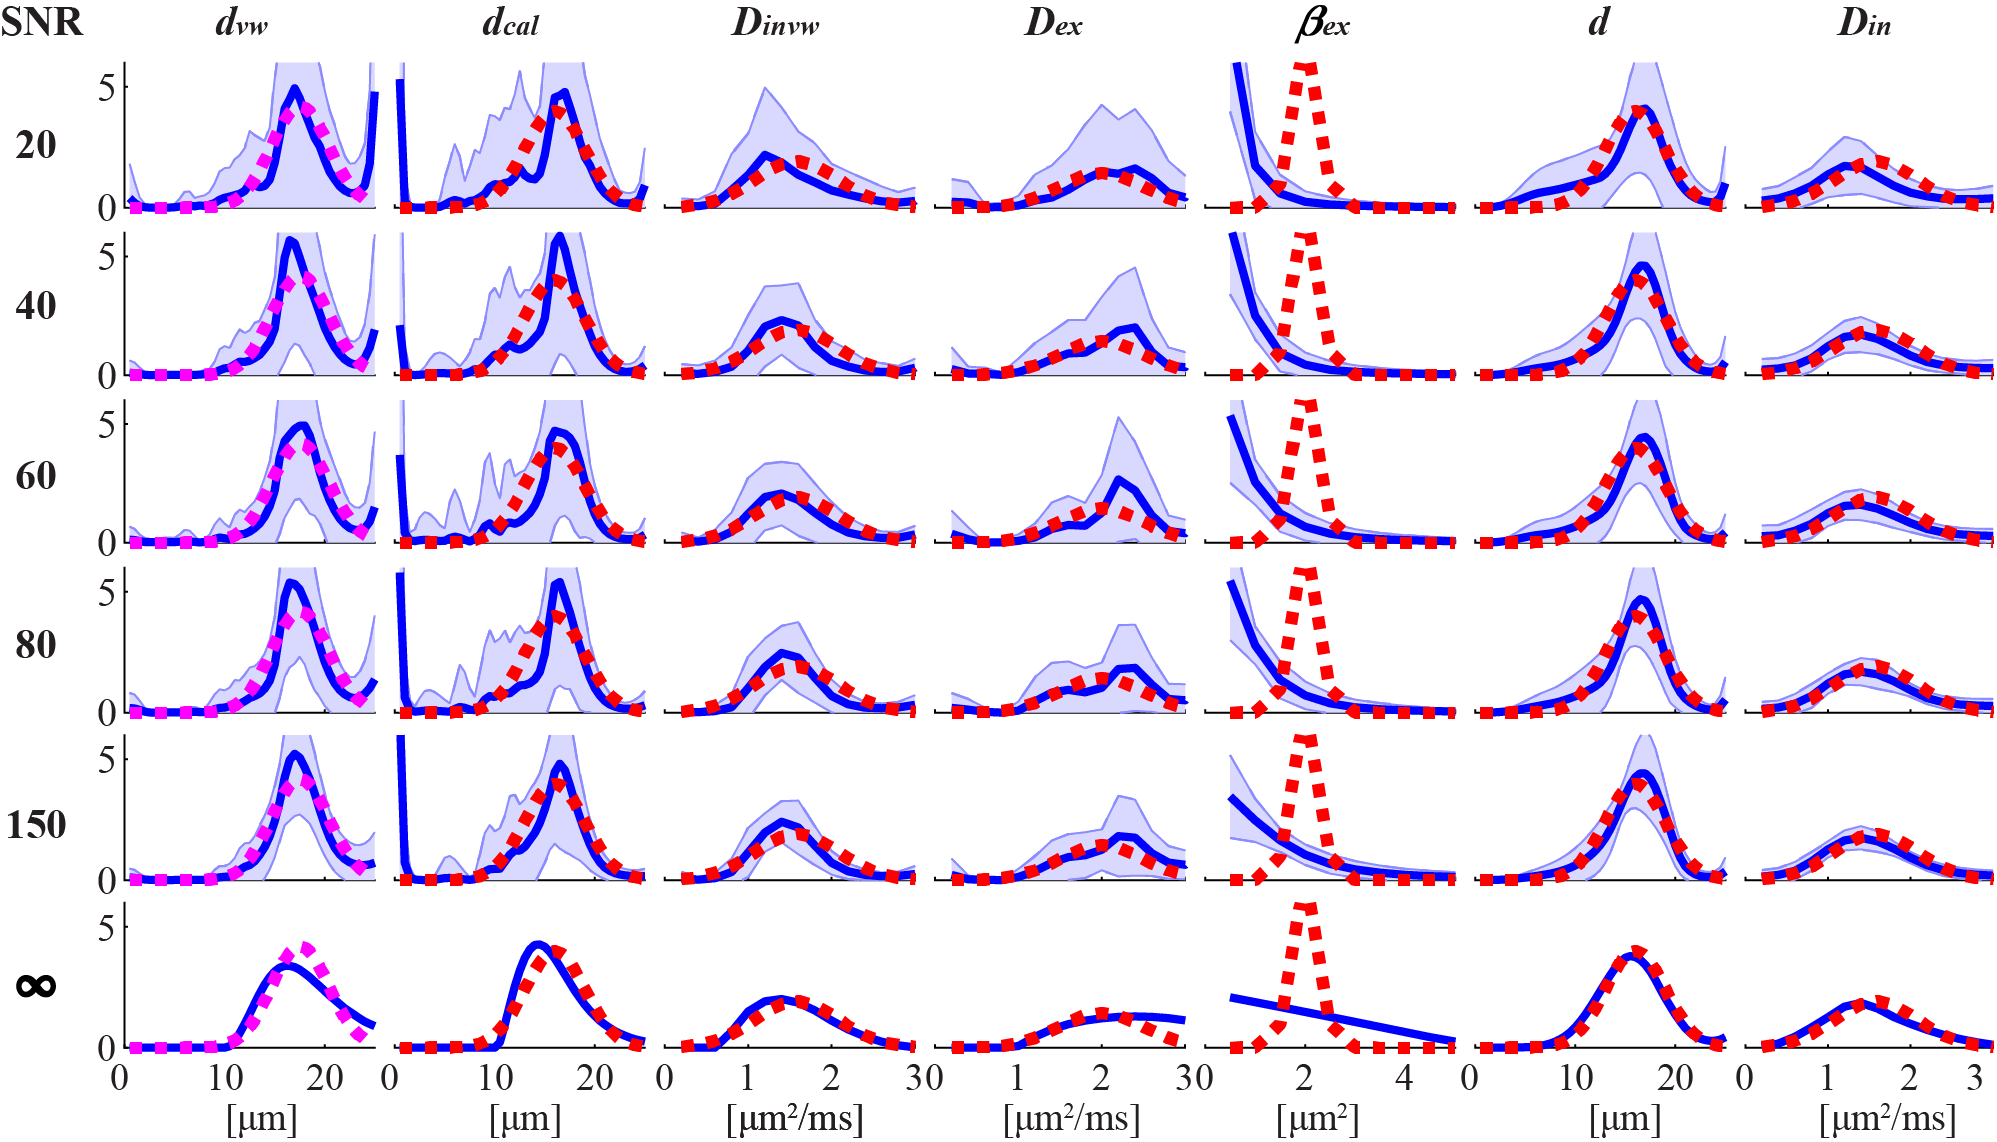
Figure 2 Simulated influence of
noise at different SNR levels on MRI-cytometry fitted distributions of
microstructural parameters. For each SNR, the fittings were repeated 100 times
each with different noise samples but with the same SNR level. The red dashed
lines represent the ground truth, blue solid lines represent the mean fitted
distributions and shaded areas represent standard deviations.
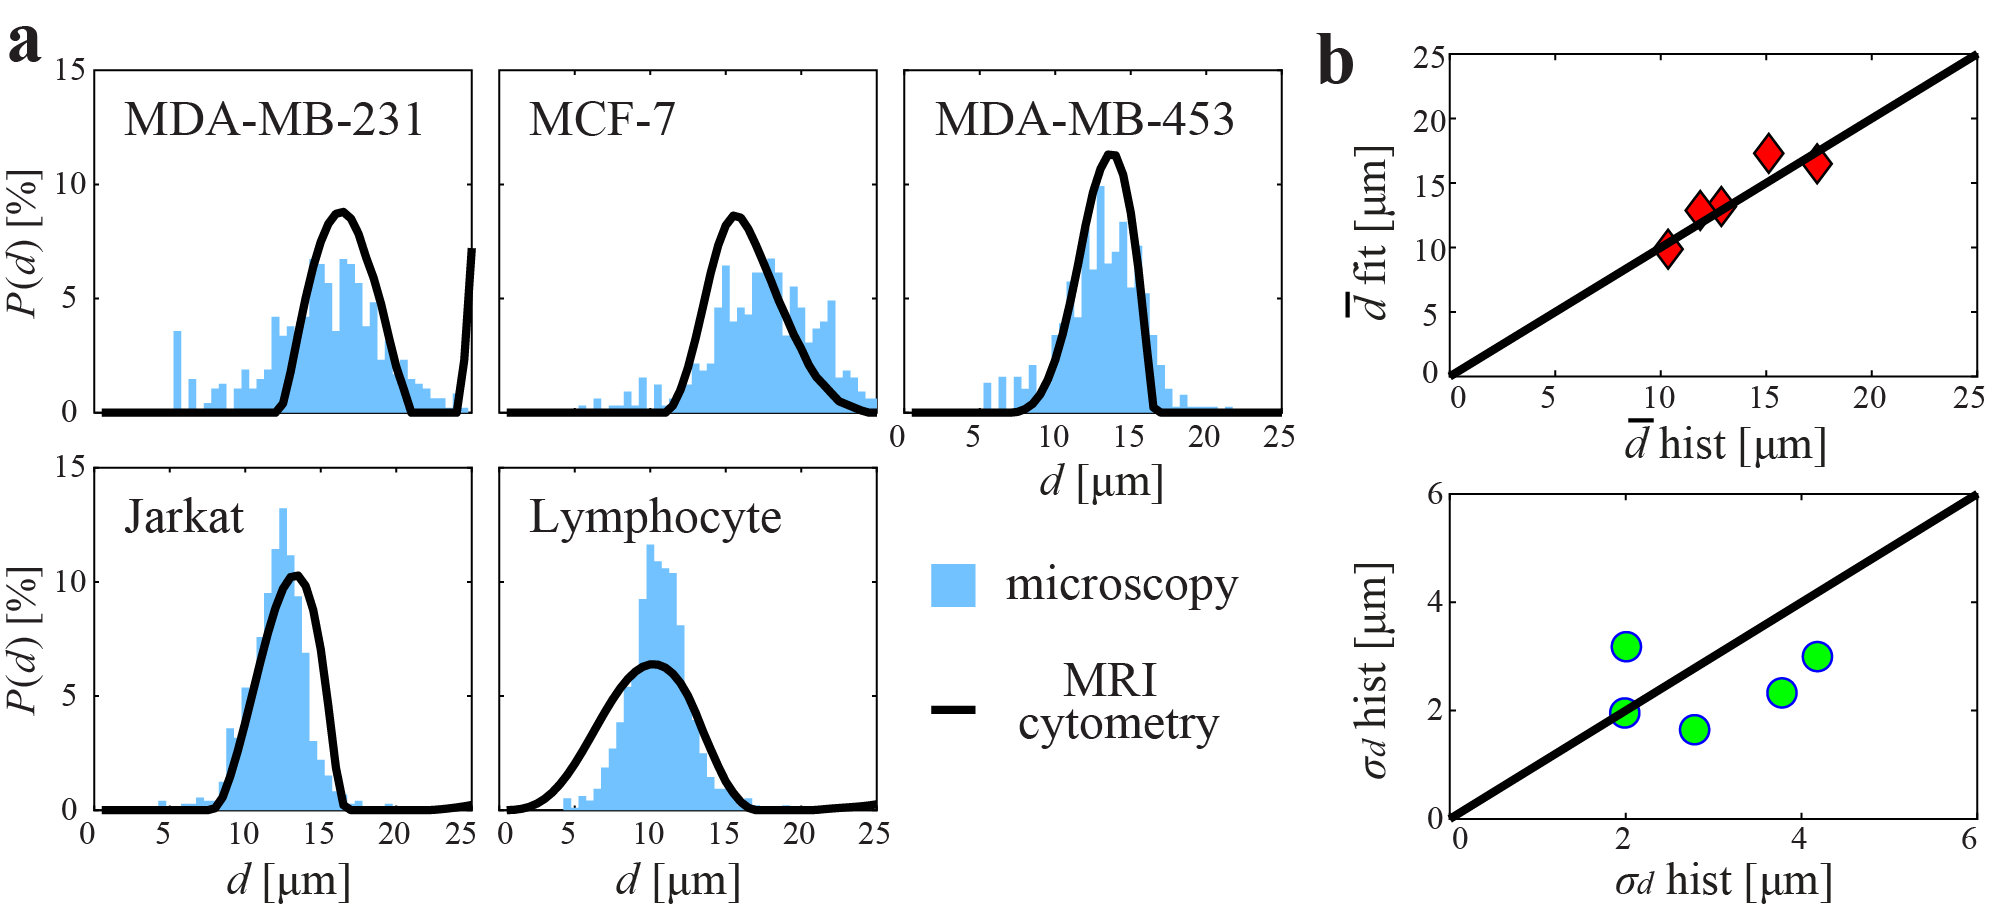
Figure 3 Comparison of MRI-cytometry
and light microscopy derived cell size distributions using cultured cells in
vitro. (a) comparison of distributions of five different cell samples. (b)
correlations of MRI-cytometry and light microscopy derived mean $$$\bar{d}$$$ and standard deviation $$$\sigma_d$$$ of cell sizes.
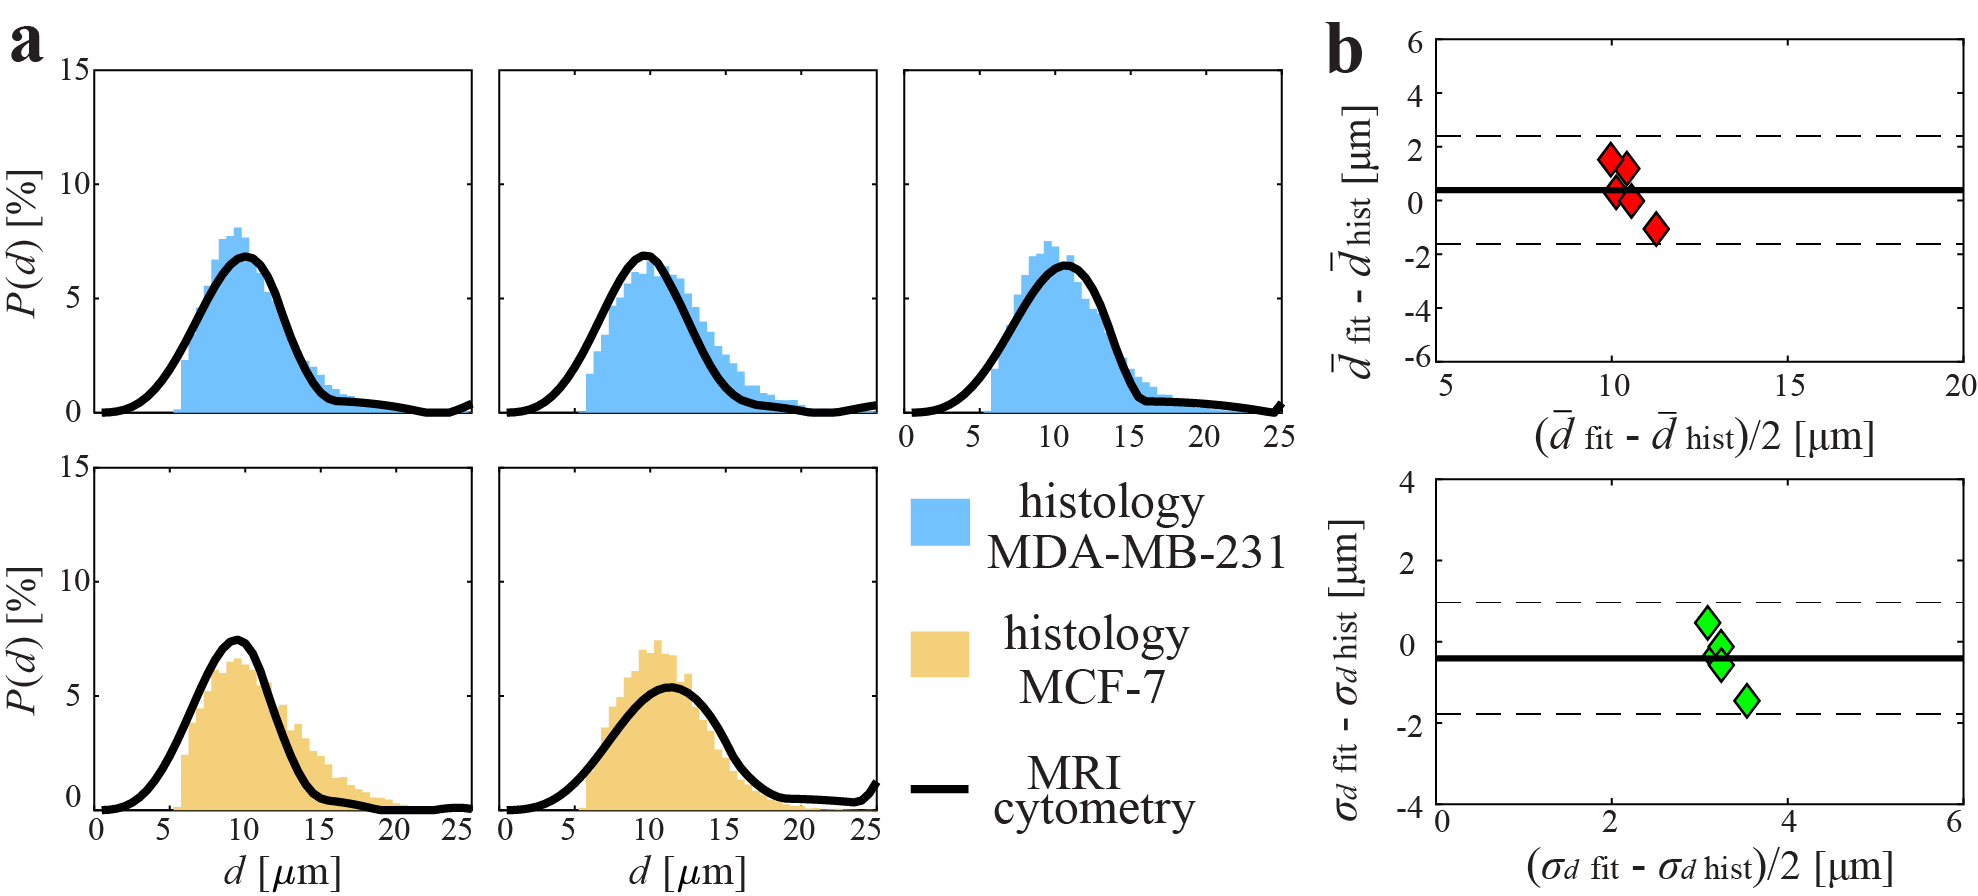
Figure 4 Comparison of MRI-cytometry
and histology derived cell size distributions of mouse tumors in vivo. (a)
comparison of distributions of five tumors (top: MDA-MB-231. Bottom: MCF-7).
(b) Bland-Altman plots show the agreement of MRI-cytometry and light microscopy
derived mean $$$\bar{d}$$$ and standard deviation $$$\sigma_d$$$ of cell sizes.
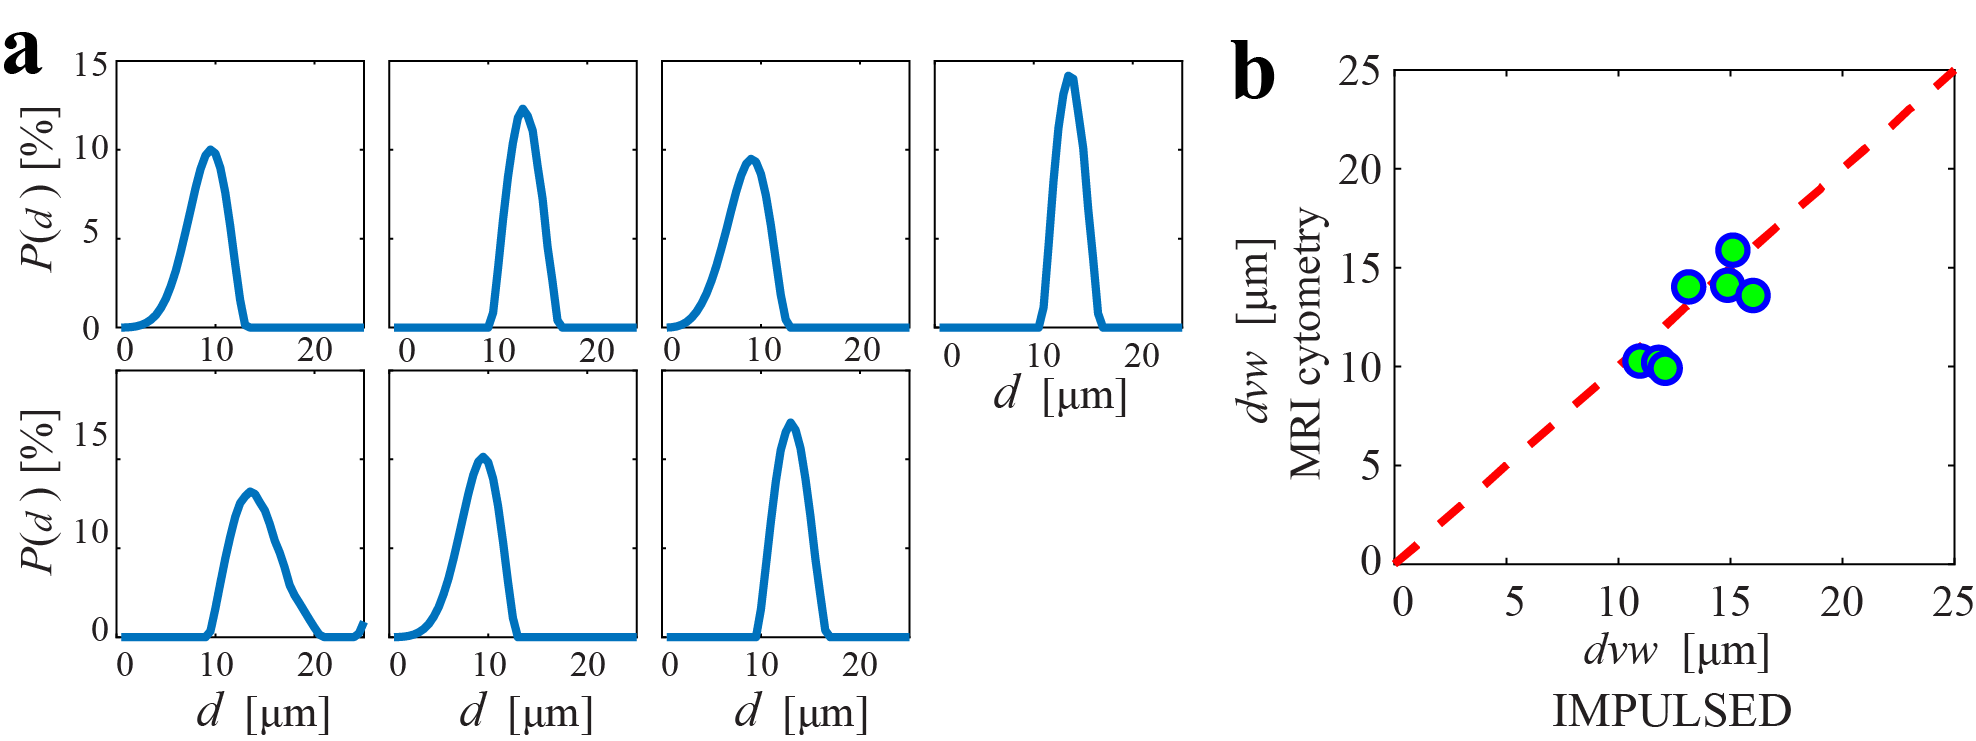
Figure 5 (a) cell size distributions
of seven breast tumors obtained in cancer patients in vivo. (b) The correlation
between cell-volume-weighted mean cell sizes obtained using IMPULSED and MRI-cytometry.