0839
Value of quantitative DCE and DW-MRI in predicting extramural venous invasion in locally advanced gastric cancer and the prognostic significance1Department of Imaging Diagnosis, National Cancer Center/National Clinical Research Center for Cancer/Cancer Hospital, Chinese Academy of Medical Sciences and Peking Union Medical College, Beijing, China, 2Department of Pathology, National Cancer Center/National Clinical Research Center for Cancer/Cancer Hospital, Chinese Academy of Medical Sciences and Peking Union Medical College, Beijing, China, 3GE healthcare, China, Beijing, China
Synopsis
Extramural vascular invasion (EMVI) has been found as an independent risk factor for recurrence and distant metastasis in patients with gastric cancer. Dynamic contrast-enhanced magnetic resonance imaging (DCE-MRI) and diffusion weighted imaging (DWI) has been applied in diagnosis of different cancers. In this study, we research into the value of DCE-MRI parameters and ADC in predicting EMVI and the prognostic significant. It was found that Ktrans, Ve and ADC are independent predictors of pathological EMVI in LAGC, and MRI-predicted EMVI (mrEMVI) confirmed to be a poor prognosis predictor in terms of 2-year recurrence-free survival (RFS).
Purpose
Extramural vascular invasion (EMVI) has been found to be related to poor prognosis in gastric cancer [1]. Preoperative diagnosis of EMVI is difficult because it can only be detected by surgery pathology. The aim of this study was to investigate the value of quantitative DCE-MRI and DWI in predicting EMVI preoperatively, and to determine the relationship between prediction results and prognosis in locally advanced gastric cancer (LAGC) patients.Materials and Methods
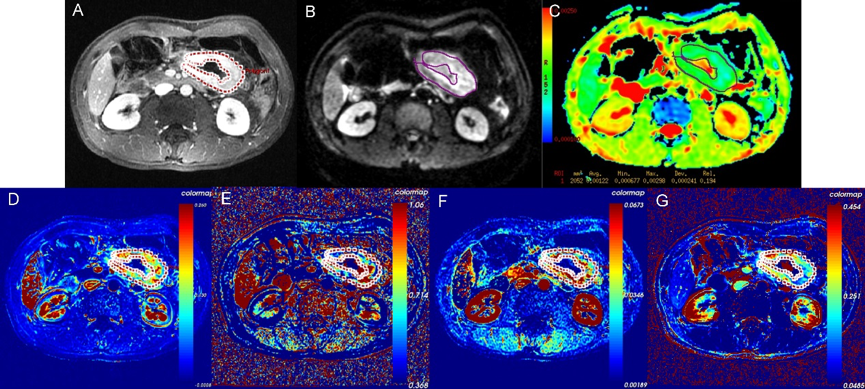
From January 2015 to June 2017, 79 LAGC patients underwent MRI preoperatively were enrolled in the study. All patients underwent D2 radical gastrectomy within 30 days after MRI examination, and received adjuvant chemotherapy. Follow-ups after radical gastrectomy were performed in the outpatient interviews every 3-6 months, recurrence-free survival (RFS) was recorded. The DCE-MRI was performed on 3.0T MRI scanner (Discovery MR750 3.0 T, GE, USA) with an 8-channel Body Coil. T1 mapping with four different flip angle (3°, 6°, 9°, 12°) and DCE with 42 phases were scanned using LAVA sequence. Quantitative parameters, including volume transfer constant (Ktrans), rate constant (Kep), volume fraction of extravascular extracellular space (Ve) and volume fraction of plasma (Vp) were calculated by Omni Kinetics 2.0.10 (Life Science, GE Healthcare, China). DWI was performed using a spin-echo echo-planar imaging by a respiratory-gating mode with b-values of 0, 800 s/mm2. ADC maps were generated by the Function Tool software on GE ADW4.6 workstation (GE, USA). Interobserver agreements for DCE-MRI parameters and ADC values were assessed using intraclass correlation coefficients (ICCs) with two-way random method. The differences in quantitative DCE-MRI and DWI parameters between different pathological EMVI (pEMVI) status groups were analyzed. The model for pEMVI prediction was built using multivariate logistic regression with the statistically significant parameters. The pEMVI predictive performance was evaluated using ROC analysis using prediction probability. Then, the patients were divided into MRI-predicted EMVI (mrEMVI) positive and negative groups. The RFS between two groups was estimated using the Kaplan-Meier method, and their differences were compared by log-rank test.Results
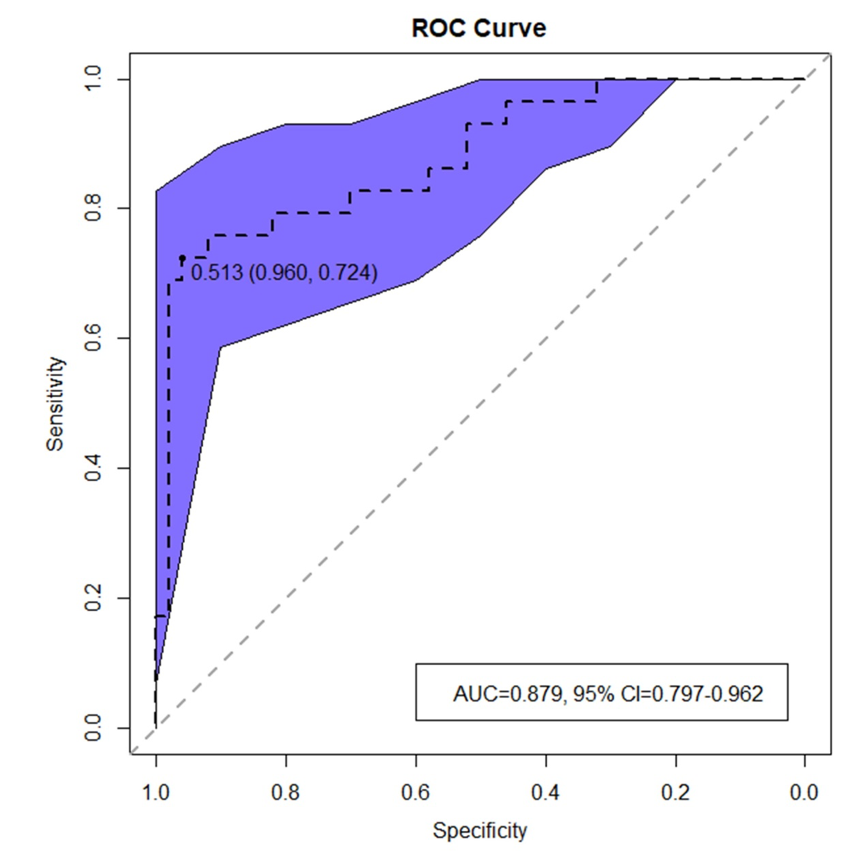
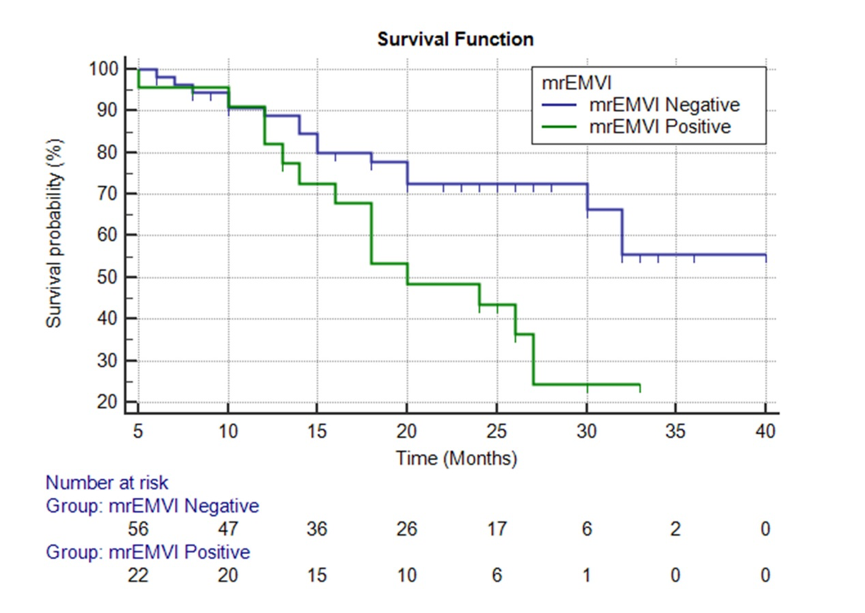
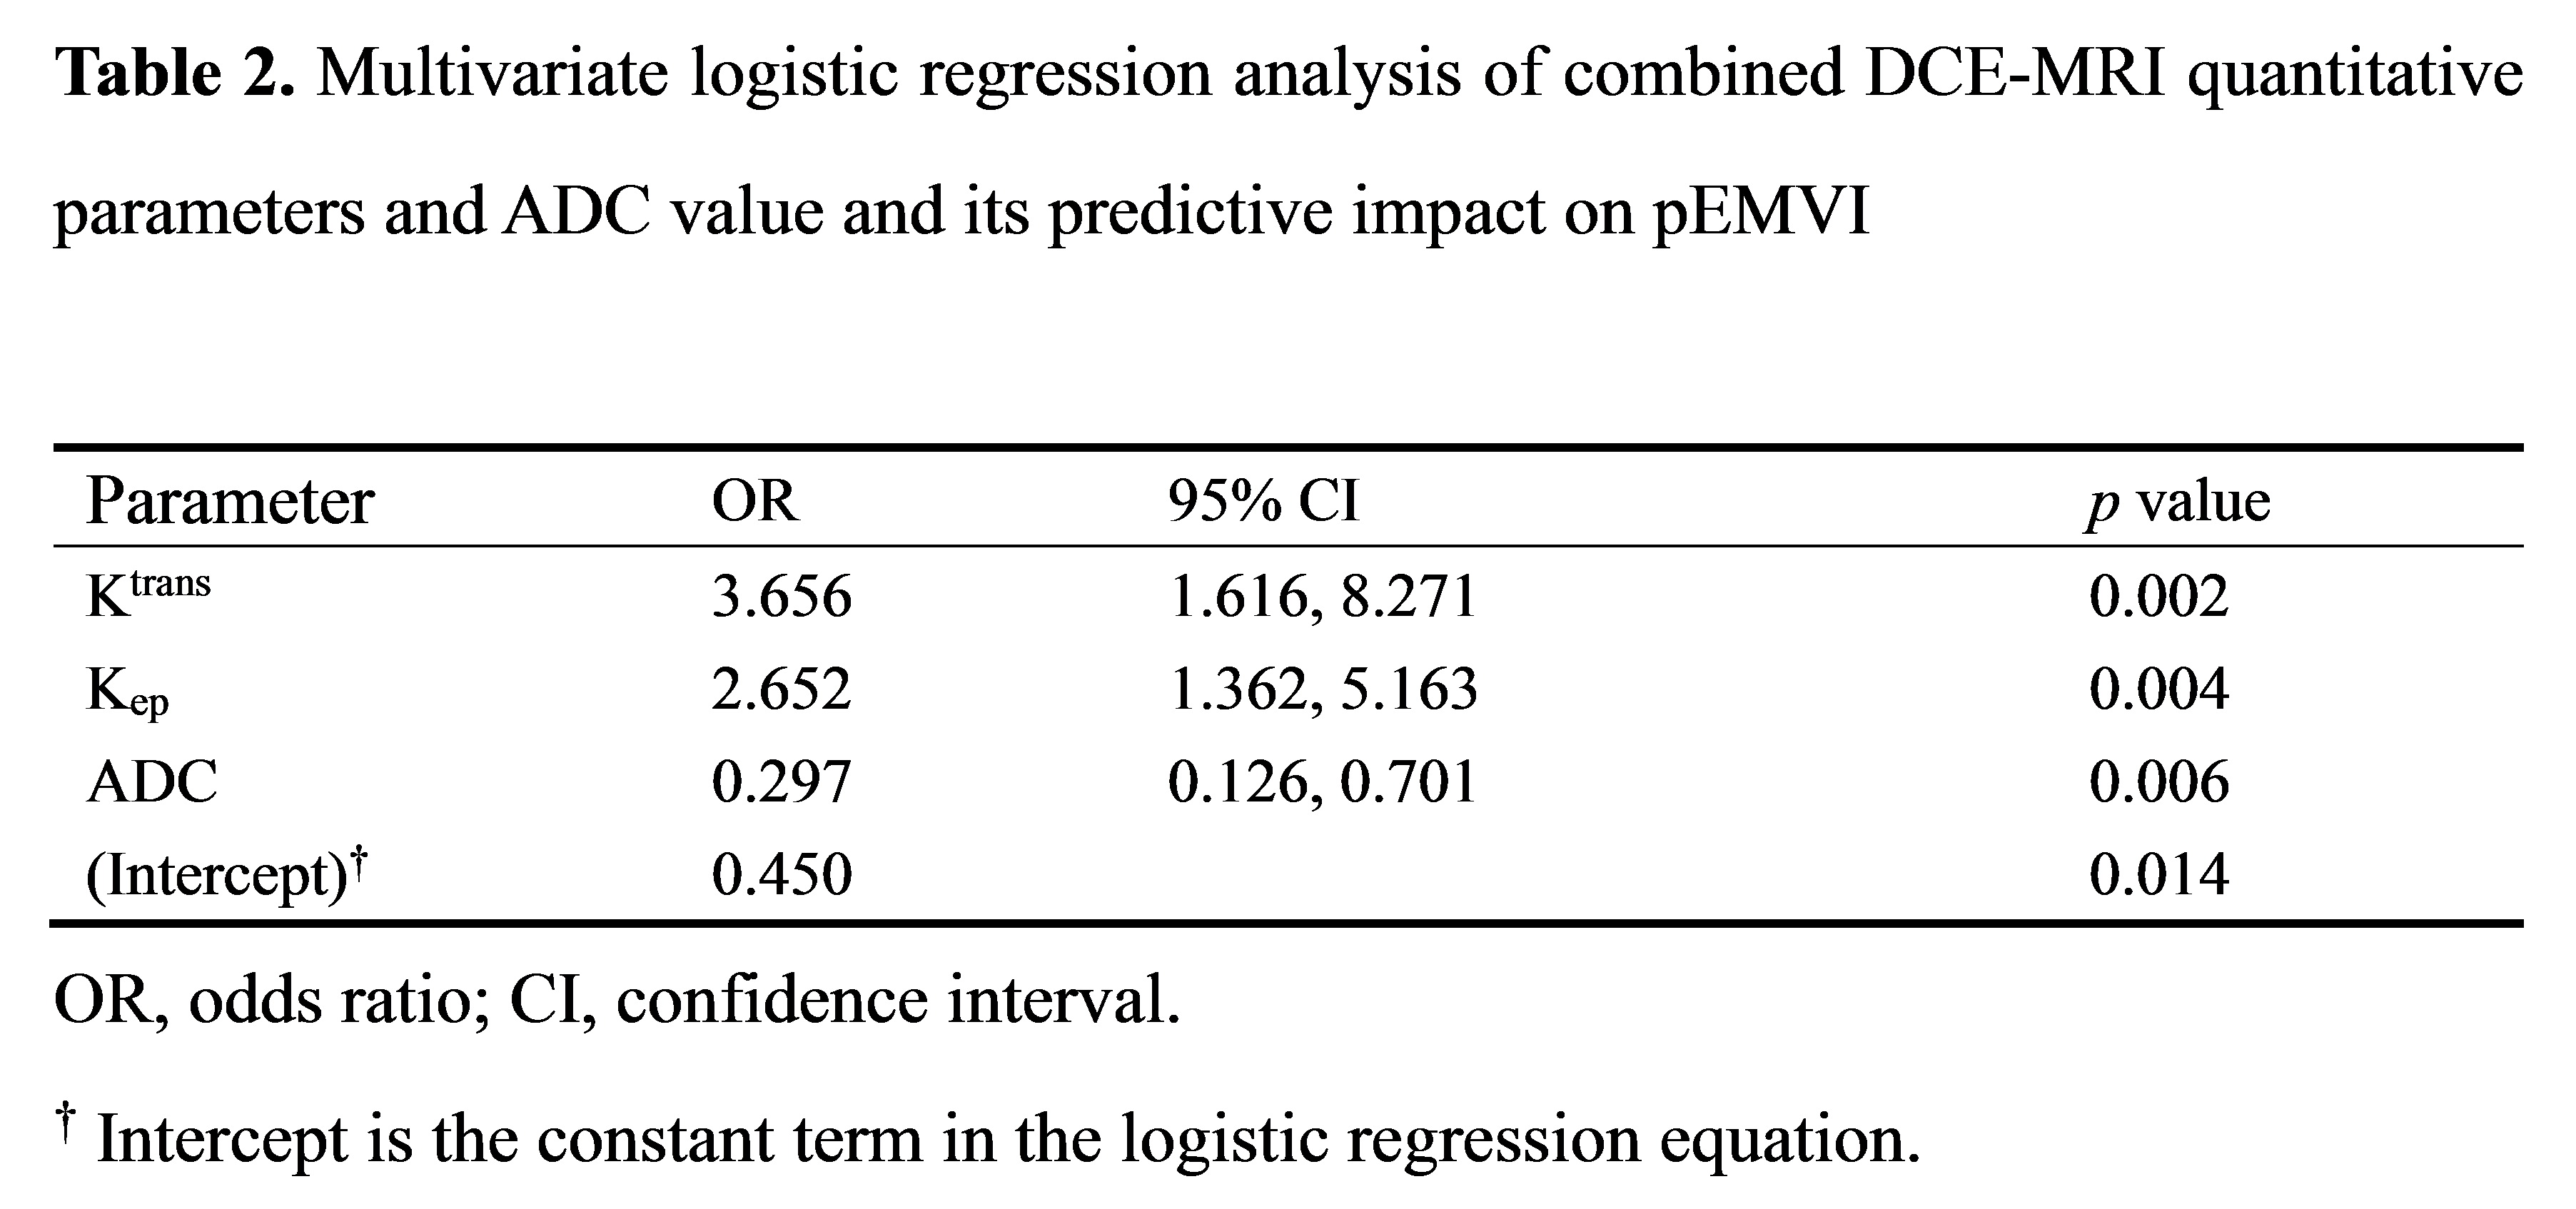
Of the 79 patients, 29 were pEMVI positive and 50 were pEMVI negative. The ICC values between the two radiologists for Ktrans, Kep, Ve, Vp and ADC were 0.877-0.930, indicating almost excellent agreement. The comparison of DCE-MRI parameters and ADC values between pEMVI positive and negative groups are shown in Table 1. The results showed that in the pEMVI positive group (Figure 1), Ktrans and Kep values were significantly higher than those in the pEMVI negative group, and ADC values were significantly lower (p<0.05), while Ve and Vp showed no significant difference (p>0.05). Multivariate logistic regression analysis showed that Ktrans, Kep and ADC values were independently associated with pEMVI with OR values of 3.66, 2.65, and 0.30 (all p<0.05) (Table 2). ROC analysis (Figure 2) showed the AUC, accuracy, sensitivity, specificity, PPV, and NPV were 0.879, 87.3%, 72.4%, 96.0%, 91.3%, and 85.7% respectively. Classified according to the predictive results, 23 cases were mrEMVI positive and 56 were mrEMVI negative. Kaplan-Meier survival analysis showed that the median RFS of the mrEMVI positive group was 21.7 months (95%CI 18.0-25.4), and the 2-year RFS rate was 43.6%. The median RFS of mrEMVI negative group was 31.2 months (95%CI 27.6-34.9), and the 2-year RFS rate was 72.5%. The 2-year RFS rates were significantly associated with mrEMVI, according to the log-rank test (p=0.010) (Figure 3).Discussion
This study shown that the combined prediction model based on quantitative DCE parameters and ADC values has a better prediction efficiency for pEMVI, with an AUC value of 0.879. The RFS of the mrEMVI positive group was significantly shorter than that of the mrEMVI negative group. Although some researchers proposed some general CT imaging features of EMVI [2, 3], while the above studies were all based on morphological diagnosis and more depending on the experience of the radiologist. Our study found that higher Ktrans and Kep values in the pEMVI positive group suggest higher tumor angiogenesis permeability and blood perfusion, which could promote hematogenous metastasis, leading to the occurrence of EMVI and postoperative tumor recurrence [4]. Multivariate logistic regression results revealed that the OR value of pEMVI was 0.297, indicating that patients with low ADC values were more likely to develop pEMVI. The results showed that the tumor recurrence rate in the mrEMVI positive group was significantly higher than in the mrEMVI negative group (60.9% vs. 26.8%), and the RFS in the mrEMVI positive group was significantly shorter than in the mrEMVI negative group (21.9 months vs. 31.2 months). This may be caused by tumor cells entering blood circulation derived from the primary lesion, and resulting in distant organ metastasis. MrEMVI makes it possible to predict pEMVI preoperatively, which is an important stratified risk factor and can provide a basis for the selection of individualized treatment plan in LAGC patients.Acknowledgements
This study was supported by the Beijing Hope Run Special Fund of Cancer Foundation of China (LC2016A06).References
[1] Messenger DE, Driman DK, Kirsch R (2012). Developments in the assessment of venous invasion in colorectal cancer: implications for future practice and patient outcome. Hum Pathol 43:965-73.
[2] Tan CH, Vikram R, Boonsirikamchai P, et al (2011). Extramural venous invasion by gastrointestinal malignancies: CT appearances. Abdom Imaging 36:491-502.
[3] Kim TU, Kim S, Lee NK, et al (2017). Prognostic Value of Computed Tomography-Detected Extramural Venous Invasion to Predict Disease-Free Survival in Patients With Gastric Cancer. J Comput Assist Tomogr 41:430-6.
[4] Yu J, Xu Q, Huang DY, et al (2017). Prognostic aspects of dynamic contrast-enhanced magnetic resonance imaging in synchronous distant metastatic rectal cancer. Eur Radiol 27:1840-7.
Figures