0838
Synthetic magnetic resonance imaging-derived histogram metrics for prediction of lymph node metastasis in rectal cancer1Diagnostic Radiology, Cancer Hospital, Chinese Academy of Medical Sciences and Peking Union Medical College, Beijing, China, 2MR Research, GE Healthcare, Beijing, China
Synopsis
The aim of this study was to evaluate the feasibility of quantitative synthetic magnetic resonance imaging (SyMRI)-derived histogram of the primary tumor for predicting the regional lymph node (LN) metastasis in patients with rectal cancer (RC). Our study indicated that histogram parameters of primary tumor on T1 mapping and T2 mapping were associated with regional LN status in RC. Moreover, the combination of the quantitative SyMRI parameters, pathological extramural venous invasion (EMVI), and maximum tumor diameter may significantly improve the predictive performance of LN metastasis.
Introduction
An accurate evaluation of LN metastasis is essential for treatment planning [1, 2] and is an important prognostic factor for evaluating the local recurrence and overall survival in patients with RC [3]. MRI is the standard diagnostic method for examining the preoperative tumor staging. Yet, it shows limited accuracy in assessing LN metastasis with conventional morphological criteria [4, 5]. Most of previous studies to identify LN by functional sequences were performed on a node-by-node basis to match the nodes on MRI with pathological specimen correctly, which still remains the largest challenge in nodal research nowadays. Moreover, studies have shown a potential association between primary tumor characteristics and LN metastasis.Purpose
To explore if there is a correlation between synthetic magnetic resonance imaging (SyMRI)-derived histogram features of the primary tumor and the regional lymph node (LN) metastasis in rectal cancer.Material and Methods
Fifty-six patients with pathologically proven rectal adenocarcinoma who underwent preoperative rectal MRI including synthetic MRI and consequently received direct surgical resection were enrolled in this prospective study. Based on pathological analysis of surgical specimen, patients were classified into negative LN (LN-) and positive LN (LN+) groups. Whole-tumor histogram analysis was independently performed by two radiologists on T1, T2 and PD mapping, including mean, median, minimum, maximum, range, skewness, kurtosis, energy, entropy, and uniformity. The clinical, pathological characteristics and histogram features were compared using univariate analysis. Receiver operating characteristic curves and Spearman's correlation were used for statistical analysis.Results
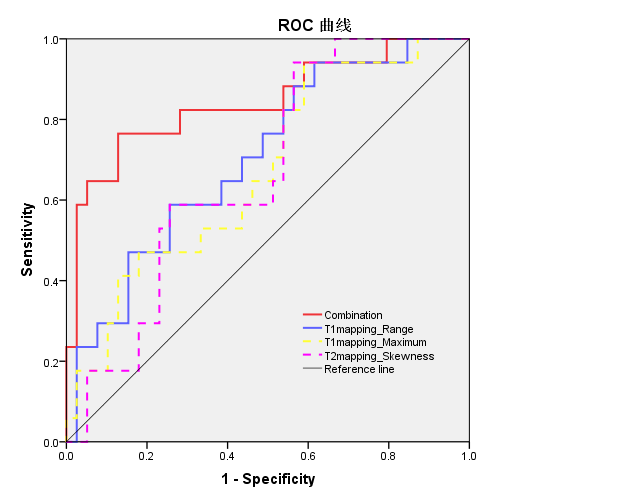
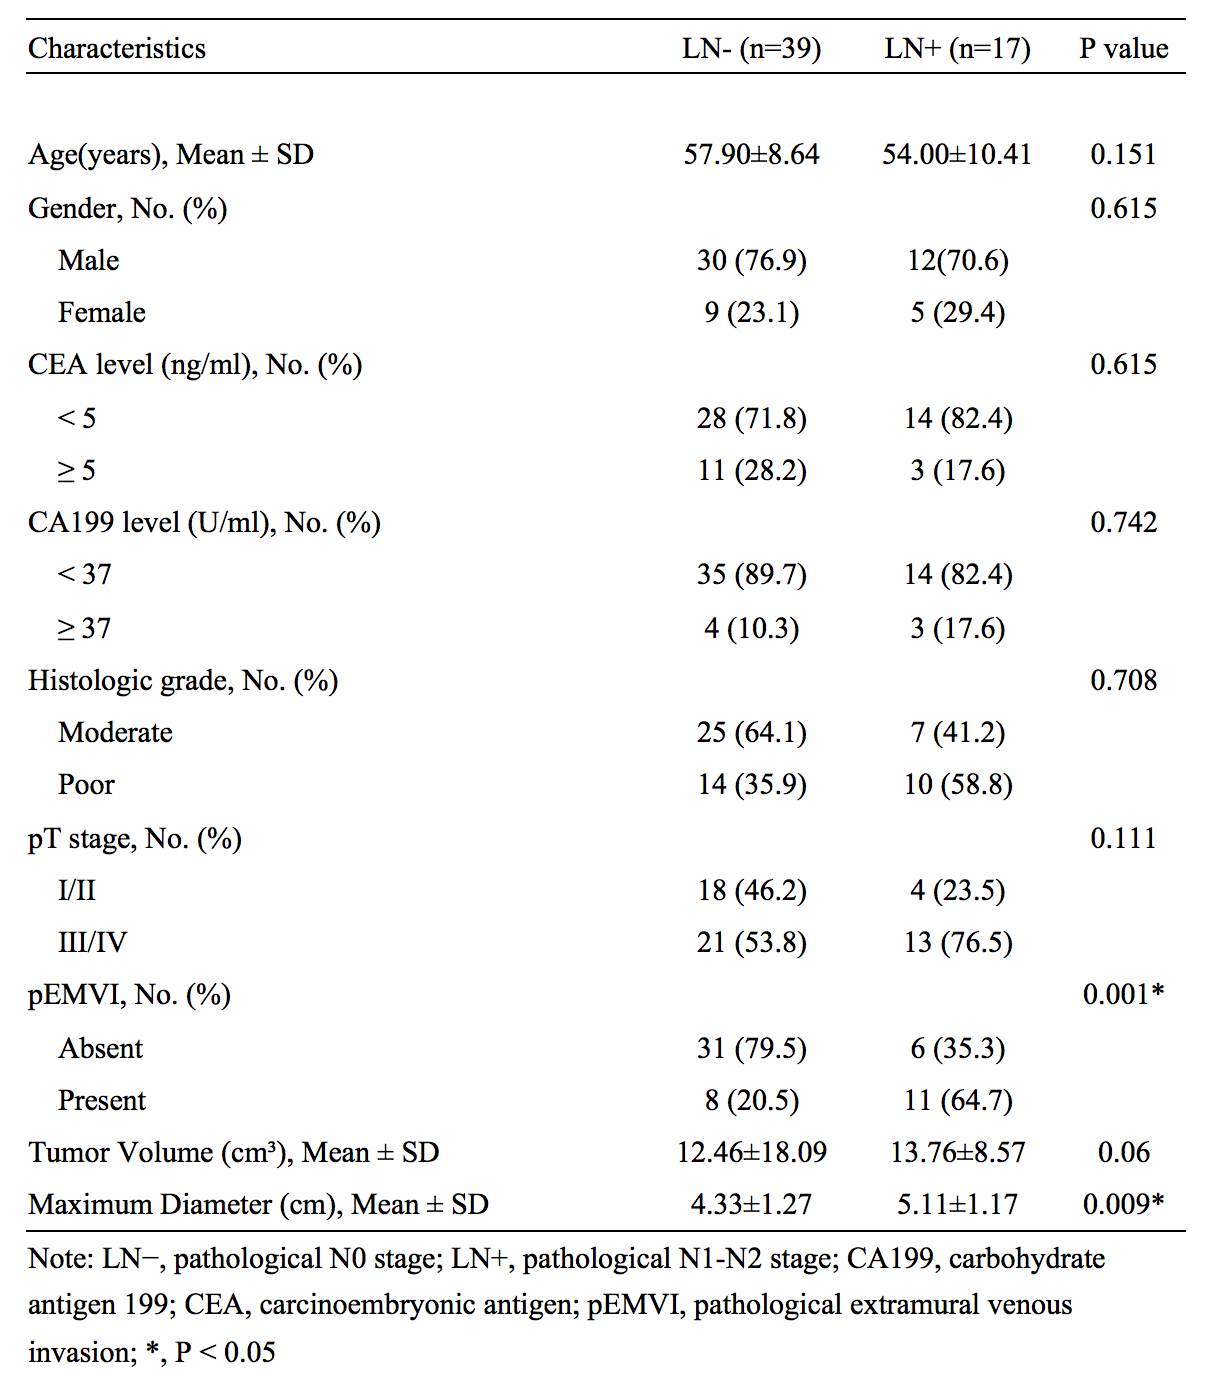
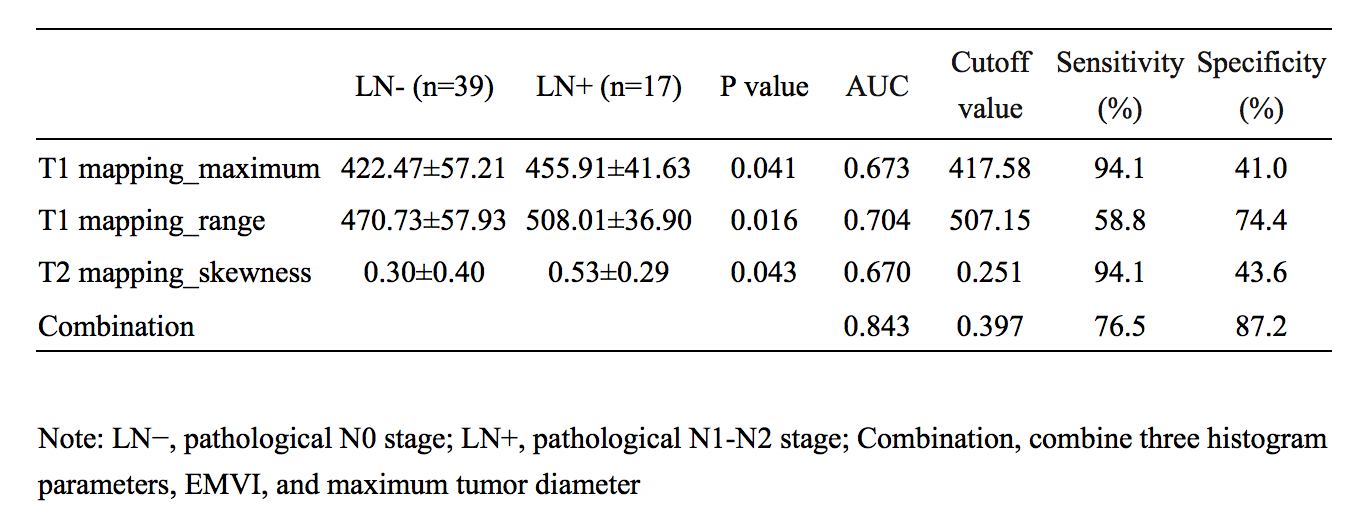
EMVI and maximum tumor diameter showed significant differences between the LN- group and LN+ group (P=0.001 and 0.009, respectively) (Tab.1). The interobserver agreement was overall good for histogram analysis between two radiologists, with intraclass correlation coefficients (ICCs) ranging from 0.633 to 0.845. The LN+ group had a significantly higher maximum (p =0.041) and range (p =0.016) on T1 mapping compared to the LN- group, and a higher skewness (p = 0.043) on T2 mapping. These three parameters had moderate to good diagnostic power for predicting LN metastasis with AUC of 0.673, 0.704, and 0.670, respectively (Tab.2), and were correlated with LN metastasis. Moreover, combining EMVI, maximum tumor diameter, and three statistically significant histogram parameters showed preferable predictive performance on LN metastasis with AUC, sensitivity and specificity of 0.843, 0.765 and 0.872, respectively (Fig.1).Discussion and Conclusions
In this study, we discovered that histogram parameters of primary tumor on T1 mapping and T2 mapping were associated with regional LN status in RC, which may help improve the prediction of nodal stage. In addition, combining the histogram parameters, EMVI, and maximum tumor diameter could significantly improve the AUC, sensitivity, and specificity for predicting LN metastasis compared to histogram parameters alone, which indicates that combination of qualitative, quantitative MRI features may maximize the predictive performance of LN status.Acknowledgements
No acknowledgement found.References
1. Glynne-Jones R, Wyrwicz L, Tiret E et al (2017) Rectal cancer: ESMO Clinical Practice Guidelines for diagnosis, treatment and follow-up. Ann Oncol 4:iv22–iv40
2. Beets GL, Figueiredo NF, Beets-Tan RGH (2017) Management of rectal cancer without radical resection. Annu Rev Med 1:169–182
3. Valentini V, van Stiphout RG, Lammering G et al (2011) Nomograms for predicting local recurrence, distant metastases, and overall survival for patients with locally advanced rectal cancer on the basis of European randomized clinical trials. J Clin Oncol 23:3163–3172
4. Brouwer NPM, Stijns RCH, Lemmens VEPP et al (2018) Clinical lymph node staging in colorectal cancer; a flip of the coin? Eur J Surg Oncol 8:1241–1246
5. Beets-Tan RGH, Lambregts DMJ, Maas M et al (2018) Magnetic resonance imaging for clinical management of rectal cancer: up dated recommendations from the 2016 European Society of Gastrointestinal and Abdominal Radiology (ESGAR) consensus meeting. Eur Radiol 4:1465–1475
Figures