0834
Quantitative multi-parametric MRI of the prostate reveals differences between ethnicities1Department of Radiology, University of Chicago, Chicago, IL, United States, 2Department of Pathology, University of Chicago, Chicago, IL, United States
Synopsis
This study investigates whether quantitative MRI of the prostate reveals differences between ethnicities that can affect diagnosis. This study shows that the different ethnicities, specifically AAs and CAs have different quantitative MRI values that affects the utility of MRI in the diagnosis of PCa. Different thresholds are needed for PCa diagnosis for different ethnicities. Despite more high grade lesions in AA, the ADC and T2 for lesions in AA were nominally higher than in CA. DCE-MRI significantly improves differentiation of PCa from benign tissue in AA, due to significantly higher cancer signal enhancement rate in AA compared to CA.
Introduction
Men with a family history of prostate cancer (inherited risk factors), genetic risk factors (germline mutations – BRCA2 gene), and specific race (African ancestry) have an elevated risk for developing prostate cancer (1). African Americans (AA) have higher risk for prostate cancer (PCa) compared to Caucasian Americans (CA). In addition, the mortality rate is also higher in AAs even after adjusting for prognostic factors (2,3). A recent study found that racial disparities were greatest in non-clinically significant low-grade Gleason 6 disease, in which AA men were twice as likely to die of PCa compared with men from other ethnicities (4).MRI has the potential to play an important role in the diagnosis and management of prostate cancer (PCa). A recent study by Mahran et. al. (5) showed racial disparity in the utility of qualitative multi-parametric MRI for the diagnosis for PCa. However, high inter-observer variability in the qualitative interpretation of prostate mpMRI remains a concern (6). There are no studies that have evaluated quantitative MRI as a biomarker to identify the racial differences in PCa biology and determine the utility of MRI specifically for different populations. Whether PCa’s have different biology and MR characteristics in AA versus CA men has yet to be determined. Therefore, this study investigates whether quantitative MRI of the prostate reveals differences between ethnicities that can affect diagnosis.
Materials and Methods
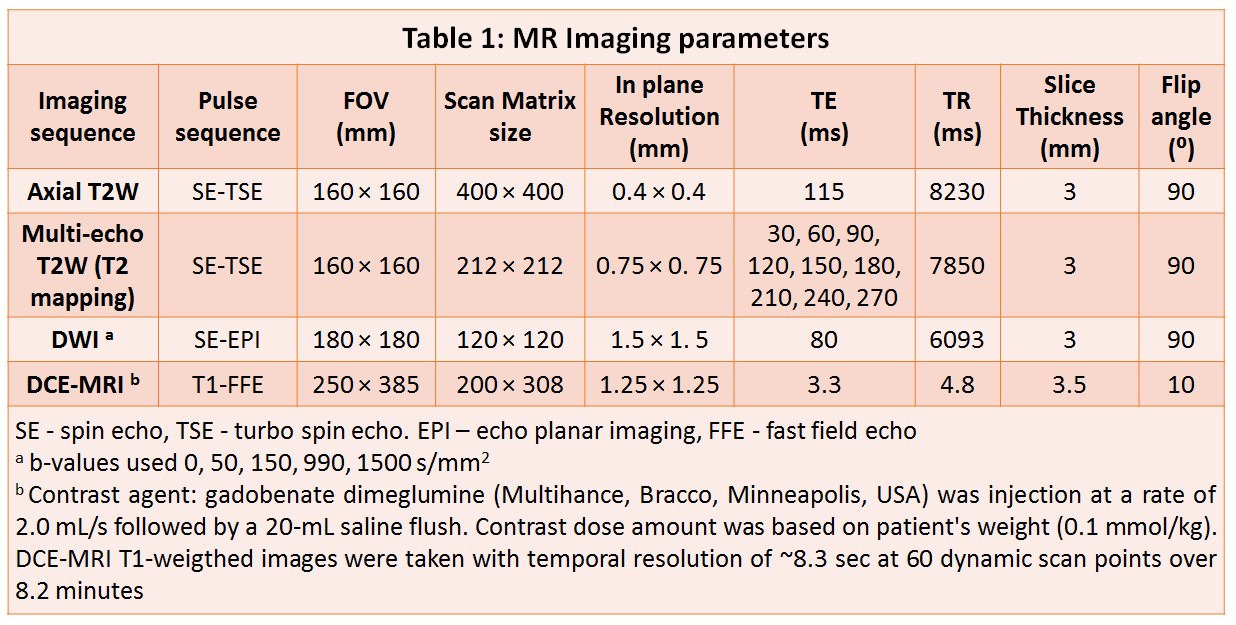
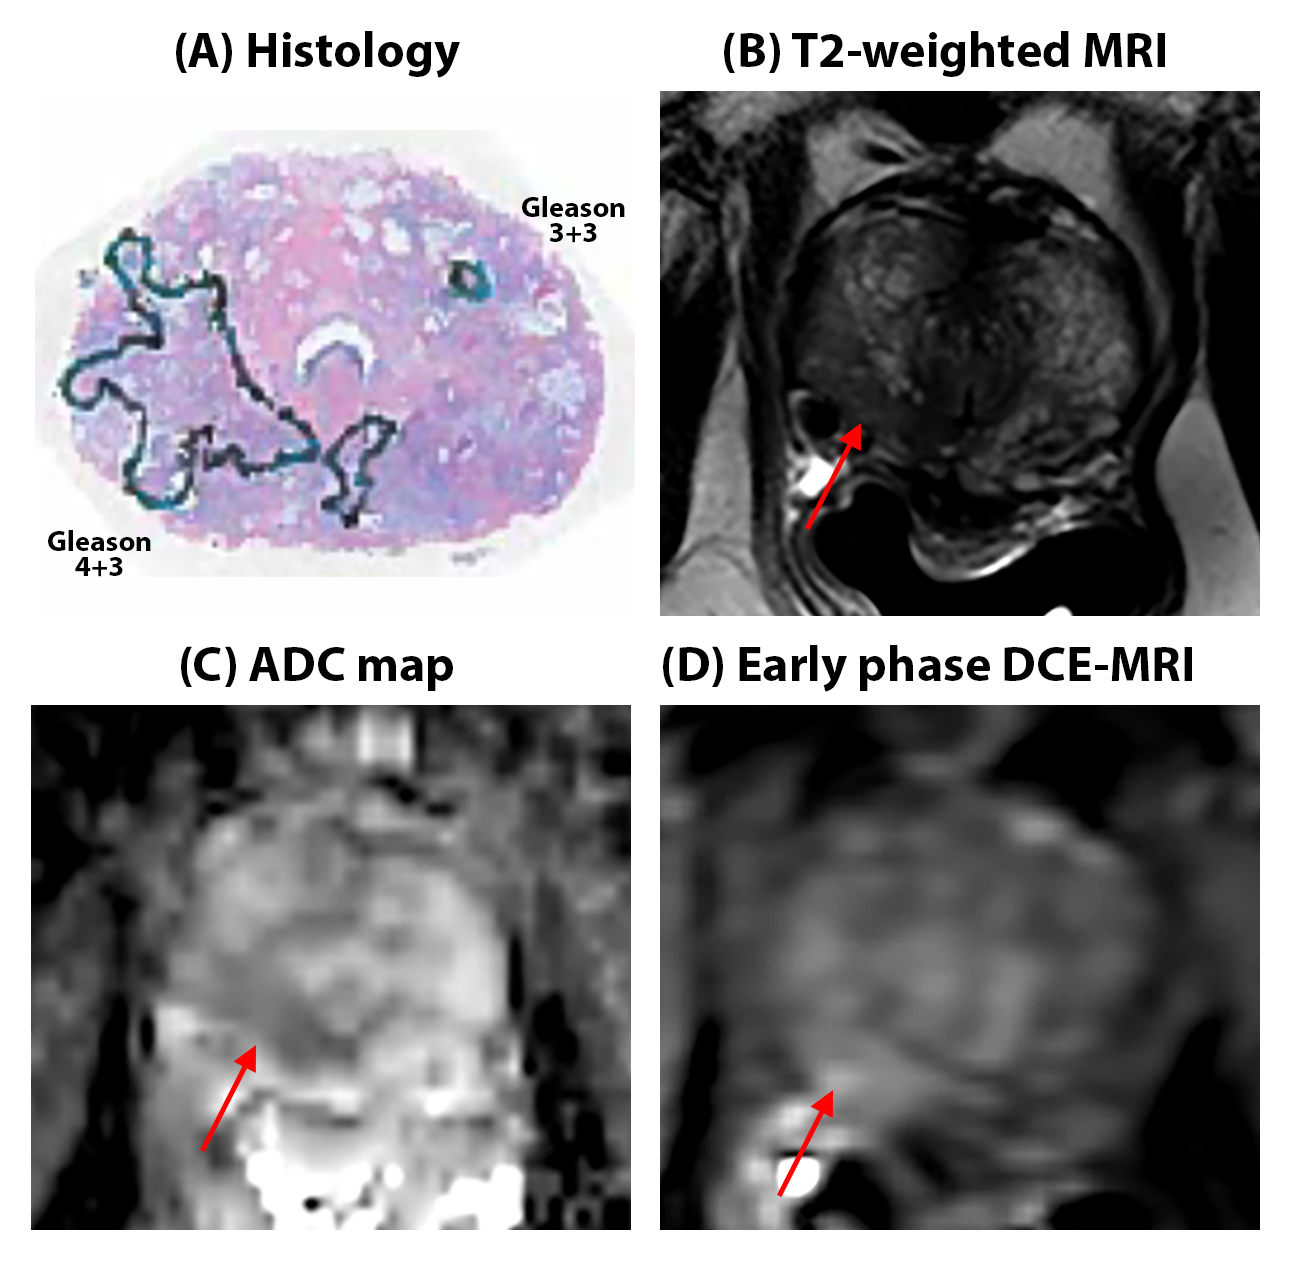
This IRB approved study involved retrospective analysis of prospectively acquired data. Patients (47 CA, 12 AA) with biopsy confirmed PCa underwent preoperative prostate mpMRI on 3T Philips Achieva scanner using a 6-channel cardiac phased array coil placed around the pelvis combined with an endorectal coil (Medrad, Bayer Healthcare) prior to undergoing radical prostatectomy. The protocol included T2-weighted (T2W), multi-echo T2-weighted, diffusion weighted and dynamic contrast enhanced (DCE) images (see Table 1). Quantitative mpMRI metrics: ADC, T2 and DCE-MRI parameters from empirical mathematical model (7) parameters: signal enhancement (α) and washout rates (β) were calculated for ROIs on sites of prostatectomy-verified PCa and normal tissue (peripheral and transition zone). Lesions smaller than 5mm on pathology were excluded. The difference between means of measured mpMRI parameters for AAs and CAs was assessed by t-test. Receiver operating characteristic (ROC) analysis was used to evaluate the performance of the quantitative mpMRI parameters in diagnosing PCa, and ideal cutoff point (Youdens index) with associated sensitivity and specificity were reported.Results
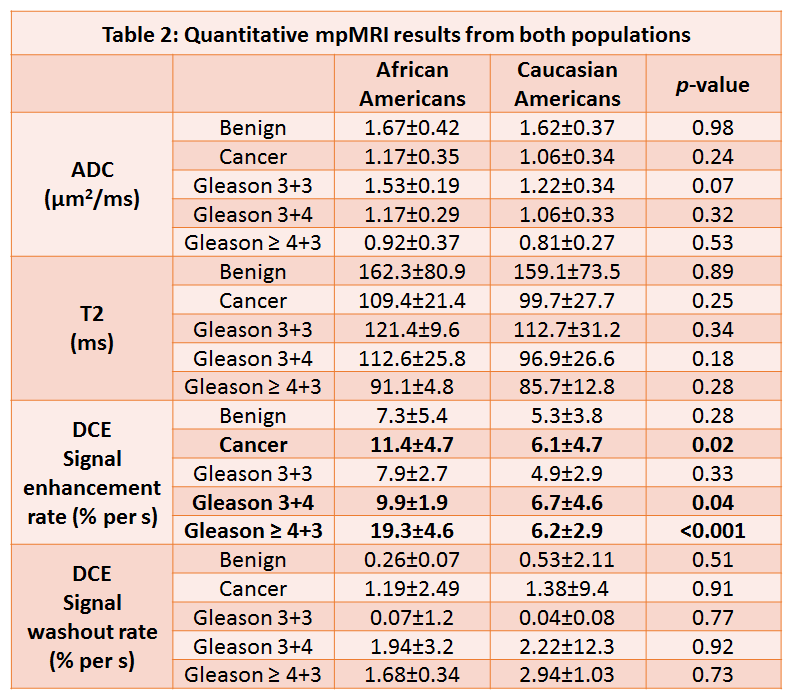
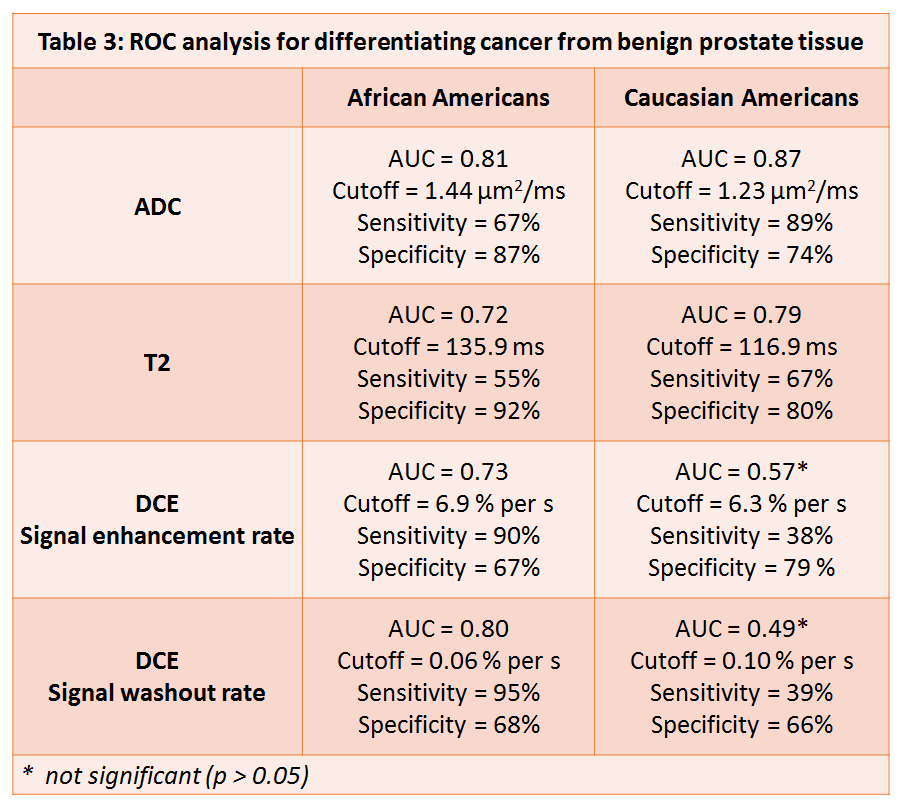
AA (20% G3+3, 53% G3+4, 27% ≥G4+3) had a greater percentage of higher Gleason grade lesions compared to CAs (29% G3+3, 58% G3+4, 14% ≥G4+3). Despite more high grade lesions in AA, the ADC (1.17±0.35 vs 1.06±0.34 µm2/ms, p=0.24) and T2 (109.4±21.4 vs 99.7±27.7 ms, p=0.25) for lesions in AA were nominally higher than in CA. Cancer signal enhancement rate was significantly higher for AA compared to CA (11.4±4.7 vs 6.1±4.7 % per s, p=0.02), while no differences in benign tissue was found (7.3±5.4 vs 5.3±3.8 % per s, p=0.28).ROC analysis for differentiating PCa from benign tissue shows that ADC (0.81 vs 0.87, p=0.12) and T2 (0.72 vs 0.79, p=0.13) are slightly (nominally) less effective in AA compared to CA, while DCE (AUC using α: 0.73 vs 0.57, p<0.05; β: 0.80 vs 0.49, p<0.05) significantly improved the differentiation of PCa from benign in AA. The cutoff (Youden’s index) for quantitative mpMRI parameters were different (by >10%) for the 2 ethnicities.
Discussion
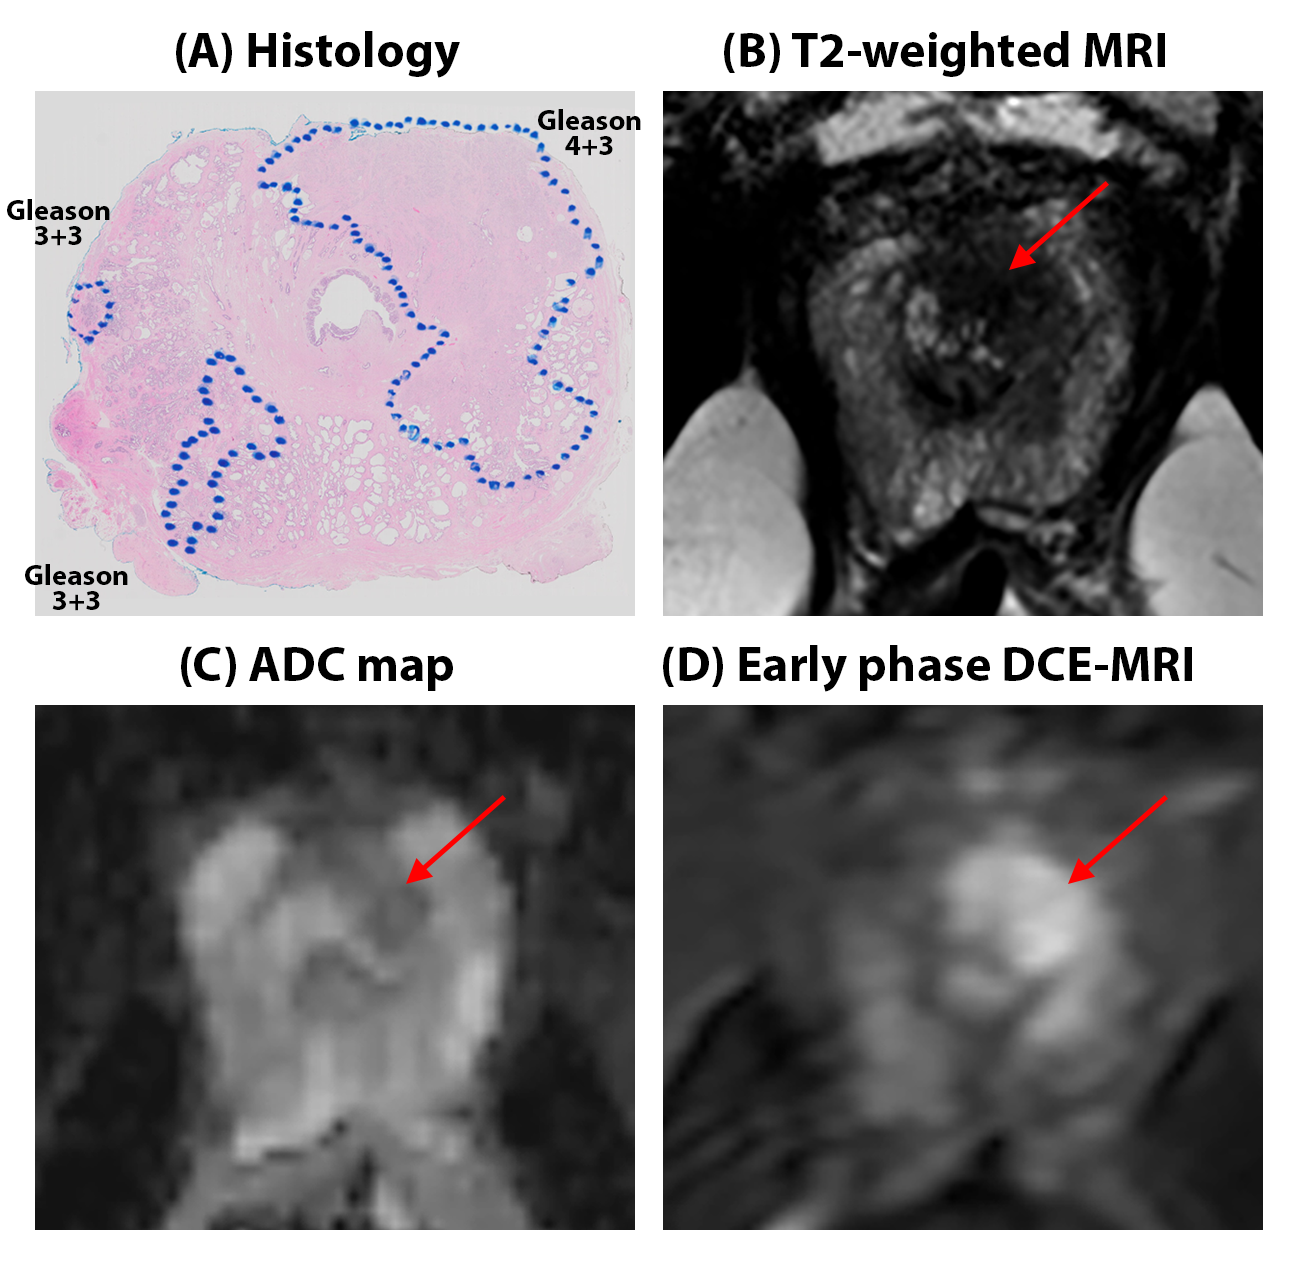
This study shows that different ethnicities: AAs and CAs have different quantitative MRI values, specifically for DCE-MRI that affects the utility of MRI in the diagnosis of PCa. Despite having more high grade lesions in AA, cancers in AA tend to have nominally higher ADC and T2 values than those in CA, suggest that cancers in AA are likely to appear as less hypointense or isointense regions with respect to surrounding benign tissue on ADC and T2W images (dominant sequences as per PI-RADS) and are more likely to be missed by radiologists. This is in agreement with qualitative mpMRI results from Mahran et. al. where negative predictive value for AA using mpMRI is lower than that for CA (5).With quantitative DCE-MRI using EMM, cancers and more specifically clinically significant cancers (≥ Gleason 3+4) tends to have significantly higher signal enhancement rate in AA vs CA, with similar rates for benign tissue in both cohorts. Therefore, quantitative DCE-MRI can improve PCa diagnosis in AAs, evidenced by higher AUCs in AA compared to CA.
Since, the ideal cutoff values for quantitative mpMRI parameters were different (>10%), the optimal thresholds for PCa diagnosis for different ethnicities using quantitative MRI should be determined independently. If these results are verified in a larger cohort in a multi-center setting, PI-RADS guidelines with a larger emphasis on DCE-MRI for AAs may be recommended. We are trying to compare these results with an Asian population, the ethnicity with the lowest incidences of PCa. This will be step towards improved PCa diagnosis based on personalized diagnosis.
Conclusion
This study shows that the AA and CA have different quantitative MRI values with different thresholds needed for PCa diagnosis. Importantly, quantitative DCE-MRI can improve PCa diagnosis in African Americans.Acknowledgements
No acknowledgement found.References
1. Mahal BA, Alshalalfa M, Spratt DE, Davicioni E, Zhao SG, Feng FY, Rebbeck TR, Nguyen PL, Huang FW. Prostate Cancer Genomic-risk Differences Between African-American and White Men Across Gleason Scores. European Urology 2019.
2. Tolcher A, Moinpour CM, Tangen CM, Crawford ED, Thompson IM, Eisenberger M. Association of African-American Ethnic Background With Survival in Men With Metastatic Prostate Cancer. JNCI: Journal of the National Cancer Institute 2001;93(3):219-225.
3. Rebbeck TR. Prostate Cancer Genetics: Variation by Race, Ethnicity, and Geography. Seminars in radiation oncology 2017;27(1):3-10.
4. Mahal BA, Berman RA, Taplin M-E, Huang FW. Prostate Cancer–Specific Mortality Across Gleason Scores in Black vs Nonblack MenProstate Cancer–Specific Mortality Across Gleason Scores in Black and Nonblack MenLetters. JAMA 2018;320(23):2479-2481.
5. Mahran A, Mishra K, Bukavina L, Schumacher F, Quian A, Buzzy C, Nguyen CT, Gulani V, Ponsky LE. Observed racial disparity in the negative predictive value of multi-parametric MRI for the diagnosis for prostate cancer. International Urology and Nephrology 2019.
6. Niaf E, Lartizien C, Bratan F, Roche L, Rabilloud M, Mège-Lechevallier F, Rouvière O. Prostate Focal Peripheral Zone Lesions: Characterization at Multiparametric MR Imaging—Influence of a Computer-aided Diagnosis System. Radiology 2014;271(3):761-769. 7. Fan X, Medved M, River JN, Zamora M, Corot C, Robert P, Bourrinet P, Lipton M, Culp RM, Karczmar GS. New model for analysis of dynamic contrast-enhanced MRI data distinguishes metastatic from nonmetastatic transplanted rodent prostate tumors. Magnetic Resonance in Medicine 2004;51(3):487-494.
Figures