0832
Added Value of DCE in Machine Learning-based Tumor Probability Maps for Predicting Clinically Significant Cancer Foci in Pre-biopsy MR images1Circulation and Medical Imaging, Norwegian University of Science and Technology, Trondheim, Norway, 2Department of Digital Science, CPE Lyon, Lyon, Norway, 3Sylvester Comprehensive Cancer Center, University of Miami, Miami, FL, United States, 4Clinic of Radiology and Nuclear Medicine, St. Olavs University Hospital, Trondheim, Norway
Synopsis
The utility of multiparametric (mp) versus biparametric (bp) MRI protocol in prostate cancer diagnosis has been compared in several large studies, but mainly using manual qualitative evaluation. In this study we employed machine learning models to investigate the added value of DCE (i.e. mpMRI) in predicting significant cancer foci in pre-biopsy MR images. Whereas both protocols had comparable results in the whole prostate and transition zone analyses, we found mpMRI model to be more useful in the peripheral zone, where significant differences (p < 0.05) were found for all performance measures i.e. area under the curve, accuracy, sensitivity and specificity.
Background
Multiparametric magnetic resonance imaging (mpMRI) of the prostate is the standard recommendation to detect cancer before initial prostate biopsy 1,2. However, the added diagnostic value of dynamic contrast-enhanced imaging (DCE) in prostate mpMRI when compared to its cost efficacy and potential associated risk remains a discussion. Some studies suggest the omission of DCE has minimal or no effect on detecting clinically significant prostate cancer, and to this effect recommend a biparametric MRI (bpMRI) approach involving T2-weighted and Diffusion-weighted imaging 3–5. These studies employed qualitative evaluation by expert radiologist, in accordance to current clinical practice. However, with the recent advent of computer-aided support tools based on machine learning 6,7, the goal of this study was to investigate the added value of DCE in machine learning-based tumor probability maps for predicting and visualizing potential biopsy targets representing clinically significant cancer foci.Materials and Methods
The PROSTATEx challenge 8 training dataset was used in this study. It consists of pre-biopsy mpMR (3T Magnetom Trio or Skyra; Siemens Medical Solutions, Erlangen, Germany) images of 188 men who underwent routine clinical diagnosis of prostate cancer. An expert radiologists (at Miller School of Medicine, Miami, FL, USA) delineated the whole prostate, peripheral zone, and cancer-suspicious volumes of interest (VOIs) on T2-weighted images guided by targeted biopsy locations provided by the challenge organizers, but blinded to biopsy results. The presence of clinically significant prostate cancer (Grade Group ≥ 2) 9 in the biopsy results was then used to label each cancer-suspicious VOI as true positive (TP) and false positive (FP) radiological findings. N4 bias field correction 10 was applied to the T2-weighted images, to which the diffusion-weighted and DCE images were subsequently co-registered 11. Standardized (by Gaussian normalization) T2-weighted image intensities, calculated high b-value (b = 1500 s/mm2) image intensities, apparent diffusion coefficient (ADC), and volume transfer constant (Ktrans) were extracted from the TP and FP VOIs and from randomly sampled healthy voxels (≈500 per patient). Three different models were trained respectively on the whole prostate, transition zone and peripheral zone to predict the probability of voxels being clinically significant cancer or not. Each model compared the utility of mpMRI (T2-weighted, b1500, ADC, and Ktrans) versus bpMRI (without Ktrans). A partial least squares-discriminant analysis (PLS-DA) classifier was embedded in 100 iterations with random data splits of a nested cross-validation scheme for the training and testing. In the outer cross-validation loop, 20% of the data were held-out for testing, whereas a 5-fold cross-validation was used for hyperparameter optimization in the inner loop (training). Receiver-operating characteristic analysis was used to calculate the area under the curve, accuracy, sensitivity and specificity at each iteration, which were then compared via paired t-test. The tumor probability maps were also back projected onto the T2-weighted image space to visualize the correspondence with the annotations.Results
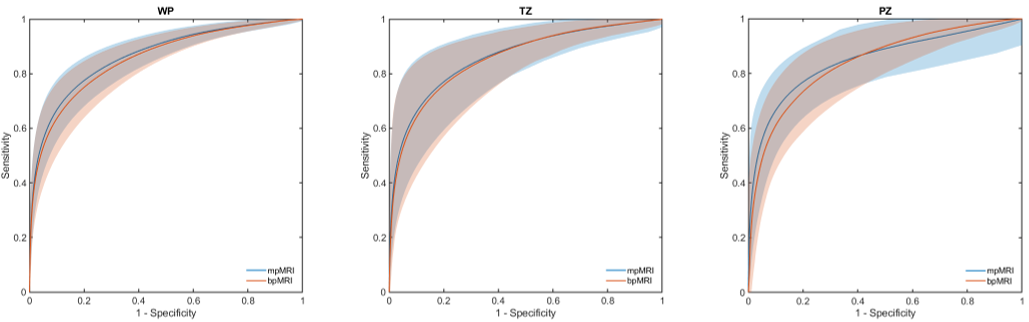
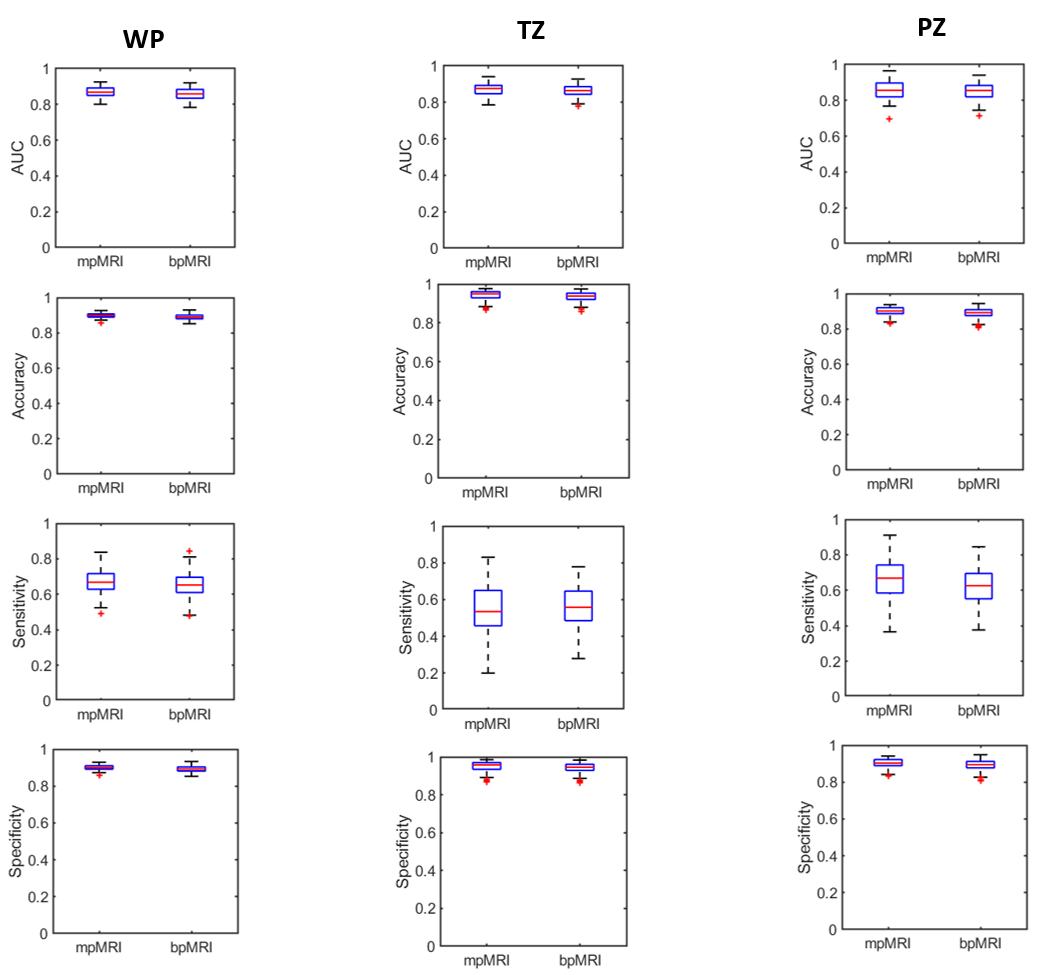
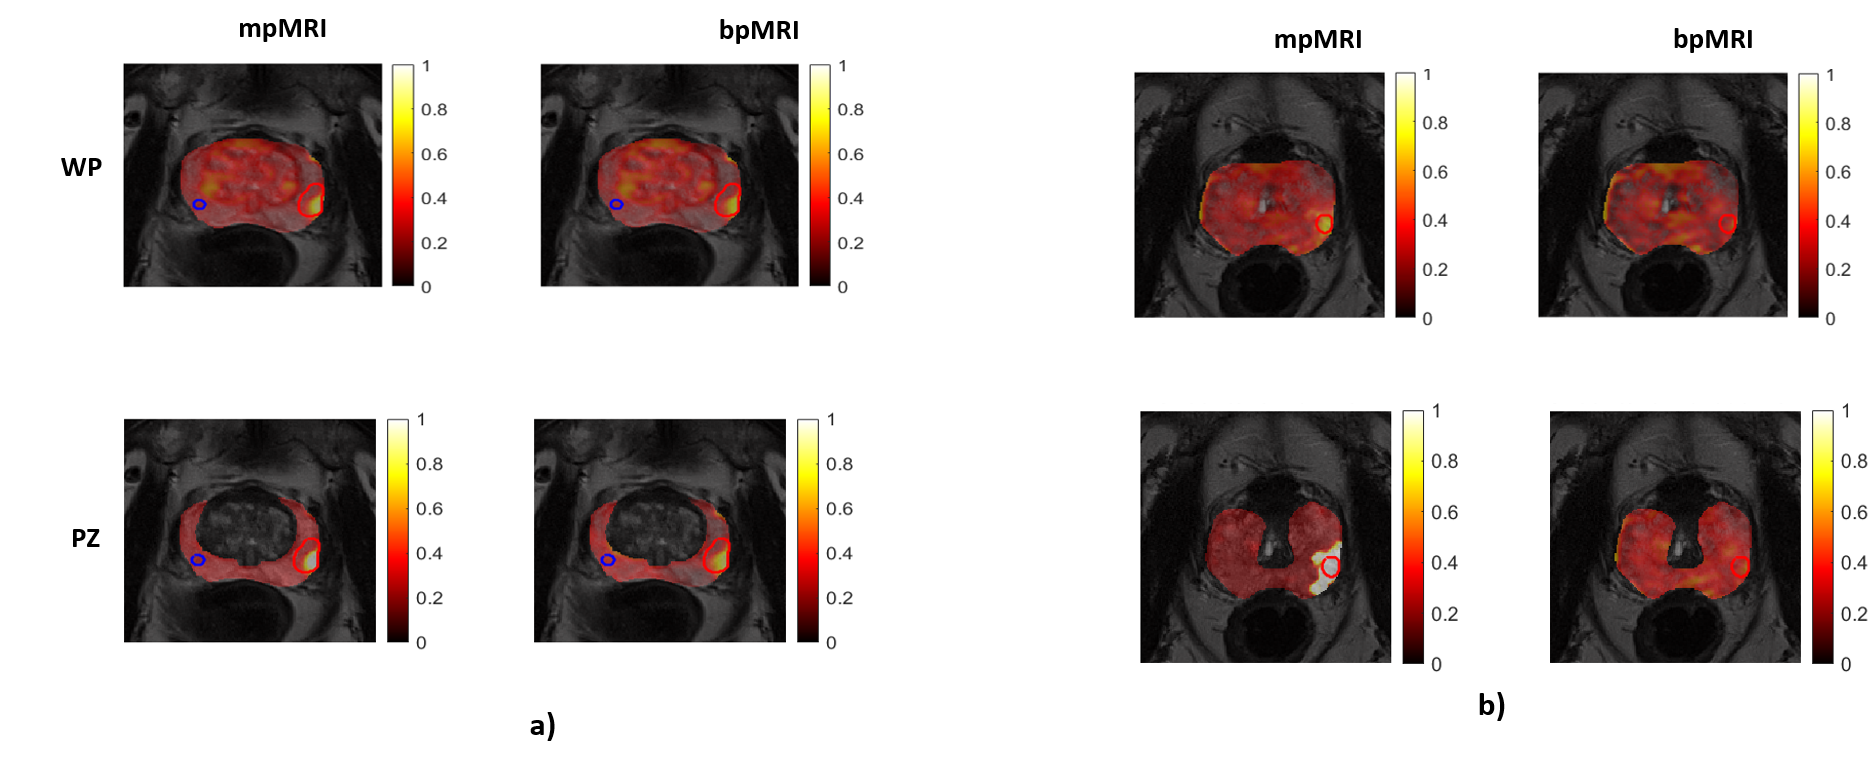
A total of 296 suspicious VOIs were annotated and targeted for biopsy in the 188 patients; 132 in the transition zone (114 patients) and 164 in the peripheral zone (120 patients). TP cancer was found in 58 men, constituting 71 of the annotations (39 transition zone and 32 peripheral zone cancers). Figure 1 presents the ROC curves for the three models. DCE had no added value in the whole prostate or transition zone analysis. The mean AUCs were comparable among all the models. The added value of DCE MRI was slightly apparent in the peripheral zone model (Figure 2), where small but significant differences (p < 0.05) were found for all performance measures (i.e. area under the curve, accuracy, sensitivity and specificity). A practical implication of this is shown Figure 3b, where for instance the mpMRI model could accurately detect significant foci in both whole prostate and peripheral zone, which otherwise would be missed by bpMRI.Discussion
Although several large studies have been conducted to compare to utility of mpMRI and bpMRI in prostate cancer diagnosis, all of them to our knowledge employed manual qualitative evaluation approach. Recently, predictive machine learning models have shown promise for prostate cancer diagnosis 12,13. In our study, we found the omission of DCE had no impact on predicting clinically significant cancers either the whole prostate or transition zone analysis. However, our results confirm findings from other studies 14 that DCE could be beneficial for some few special cases or patients, especially in peripheral cancer detection. The machine leaning models in this study were limited to only the images intensity values. Further studies including extensive radiomic features should be performed in future studies.Conclusion
The exclusion of DCE imaging from pre-biopsy MRI machine learning-based models did not have significant effect on predicting clinically significant cancer foci in whole prostate and transition zones; but had a marginal effect in the peripheral zone.Acknowledgements
No acknowledgement found.References
1. N. Mottet van den B, E. Briers PC, M. De Santis, et al. EAU Guidelines: Prostate Cancer | Uroweb.
2. Turkbey B, Rosenkrantz AB, Haider MA, et al. Prostate Imaging Reporting and Data System Version 2.1: 2019 Update of Prostate Imaging Reporting and Data System Version 2. Eur Urol. September 2019.
3. Knaapila J, Jambor I, Perez IM, et al. Prebiopsy IMPROD Biparametric Magnetic Resonance Imaging Combined with Prostate-Specific Antigen Density in the Diagnosis of Prostate Cancer: An External Validation Study. Eur Urol Oncol. September 2019.
4. van der Leest M, Israël B, Cornel EB, et al. High Diagnostic Performance of Short Magnetic Resonance Imaging Protocols for Prostate Cancer Detection in Biopsy-naïve Men: The Next Step in Magnetic Resonance Imaging Accessibility. Eur Urol. November 2019.
5. Woo S, Suh CH, Kim SY, et al. Head-to-Head Comparison Between Biparametric and Multiparametric MRI for the Diagnosis of Prostate Cancer: A Systematic Review and Meta-Analysis. Am J Roentgenol. 2018;211(5):W226-W241.
6. Stoyanova R, Takhar M, Tschudi Y, et al. Prostate cancer radiomics and the promise of radiogenomics. Transl Cancer Res. 2016;5(4):432-447.
7. Gillies RJ, Kinahan PE, Hricak H. Radiomics: Images Are More than Pictures, They Are Data. Radiology. 2016;278(2):563-577.
8. Geert Litjens, Oscar Debats, Jelle Barentsz, Nico Karssemeijer HH. ProstateX Challenge data. The Cancer Imaging Archive (2017).
9. Epstein JI, Zelefsky MJ, Sjoberg DD, et al. A Contemporary Prostate Cancer Grading System: A Validated Alternative to the Gleason Score. Eur Urol. 2015;69(3):428-435.
10. Tustison NJ, Avants BB, Cook PA, et al. N4ITK: improved N3 bias correction. IEEE Trans Med Imaging. 2010;29(6):1310-1320.
11. Klein S, Staring M, Murphy K, et al. elastix: a toolbox for intensity-based medical image registration. IEEE Trans Med Imaging. 2010;29(1):196-205.
12. Schelb P, Kohl S, Radtke JP, et al. Classification of Cancer at Prostate MRI: Deep Learning versus Clinical PI-RADS Assessment. Radiology. October 2019:190938.
13. Chen T, Li M, Gu Y, et al (2019) Prostate Cancer Differentiation and Aggressiveness: Assessment With a Radiomic-Based Model vs. PI-RADS v2. J Magn Reson Imaging 49:875–884
14. Greer MD, Shih JH, Lay N, et al. Validation ofthe dominant sequence paradigm and role of dynamic contrast-enhanced imaging in PI- RADS version 2. Radiology 2017;285:859–69.
Figures