0831
T2*-weighted MRI as a non-contrast enhanced method for assessment of focal laser ablation zone extent in prostate cancer thermotherapy1Radiology, University of Chicago, Chicago, IL, United States, 2Radiology, The First Affiliated Hospital of Guangzhou Medical University, Guangzhou, China, 3Medical Physics, University of Missouri, Columbia, MO, United States, 4Urology, University of Chicago, Chicago, IL, United States
Synopsis
This study evaluated the utility of T2*-weighted (T2*W) MRI for intra-operative identification of ablation zone extent during focal laser ablation (FLA) of prostate cancer. Ablation zone ROI sizes and contrast-to-background ratio (CBR) were calculated on T2*W and apparent diffusion coefficient (ADC) maps and compared to those in the reference standard subtracted contrast-enhanced T1-weighted (sceT1W) images. CBRs on T2*W (TE=32,63 ms) did not differ significantly from those in sceT1W, and ROI sizes in T2*W (TE=63 ms) and sceT1W were well-correlated and differed by only 15%. Therefore, T2*W MRI with long TE visualizes post-procedure ablation zone comparably to contrast-enhanced T1W MRI.
Introduction
Prostate cancer (PCa) is the most common non-cutaneous cancer in men. However, many patients undergo aggressive treatment such as radical prostatectomy for indolent disease,1 with numerous side effects.2, 3 MRI-guided focal laser ablation (FLA) is a novel technique for focal therapy of prostate cancer and involves thermal destruction of PCa tissue by laser, reducing the risk of healthy adjacent normal tissue damage relative to conventional treatments. Presently, gadolinium-based contrast-enhanced T1-weighted (T1W) imaging is used to assess the extent of coagulated necrosis caused by thermal therapy, but this can only be done once at the end of the ablation treatment. Gadolinium-based contrast agents can be retained in the ablated tissue for several hours, which not only makes repeated evaluation ineffective, but additional ablation sessions could result in toxicity if the stability of the contrast chelate is compromised by highly increased tissue temperatures. The purpose of this study is to evaluate the feasibility of using single-TE T2*W MR imaging for identification of acute ablation zone extent following FLA of PCa, as compared to apparent diffusion coefficient (ADC) mapping and contrast-enhanced T1W MRI.Methods
Fourteen patients with biopsy-confirmed low- to intermediate-risk localized PCa received MRI-guided (1.5T) FLA thermotherapy. Following FLA, axial multiple-TE T2*W images and diffusion-weighted images (DWI) were acquired. Following the procedure, pre- and post-contrast T1W images were also acquired to assess ablation zone (n=14) extent, as a reference standard. ADC maps and subtracted contrast-enhanced T1W (sceT1W) images were calculated. Ablation zone regions of interest (ROIs) were outlined manually on T2*W images acquired at TE=3.4, 32 and 63 ms (T2*W3.4, T2*W32, and T2*W63) and sceT1W images by a radiologist with 10 years of prostate MRI experience. The ROIs from sceT1W images were propagated to ADC maps. The ROI sizes were calculated in the slices with largest ablation zone cross-section. The contrast-to-background ratio (CBR) of ablated ROIs was calculated on T2*W images, ADC maps, and sceT1W images: the difference in signal intensity between the ablated ROI and that in an ROI in untreated peripheral zone prostate tissue contralateral to the ablation site was normalized to the standard deviation of the signal intensity in the untreated prostate ROI. The non-parametric Friedman’s test with post-hoc two-tailed Wilcoxon signed-rank test was performed to compare CBRs of T2*W images, ADC maps, and sceT1W images, and to compare ROI sizes on T2*W32, T2*W63 and sceT1W images. Bland-Altman analysis was performed to evaluate the agreement between ROI sizes and CBRs of T2*W32 and T2*W63 vs sceT1W images. The correlation between ROI sizes measured in T2*W63 and sceT1W images was evaluated using the Pearson correlation coefficient. The difference between ROI sizes measured in T2*W32 and T2*W63 vs sceT1W images was tested using the two-tailed Wilcoxon signed-rank test.Results
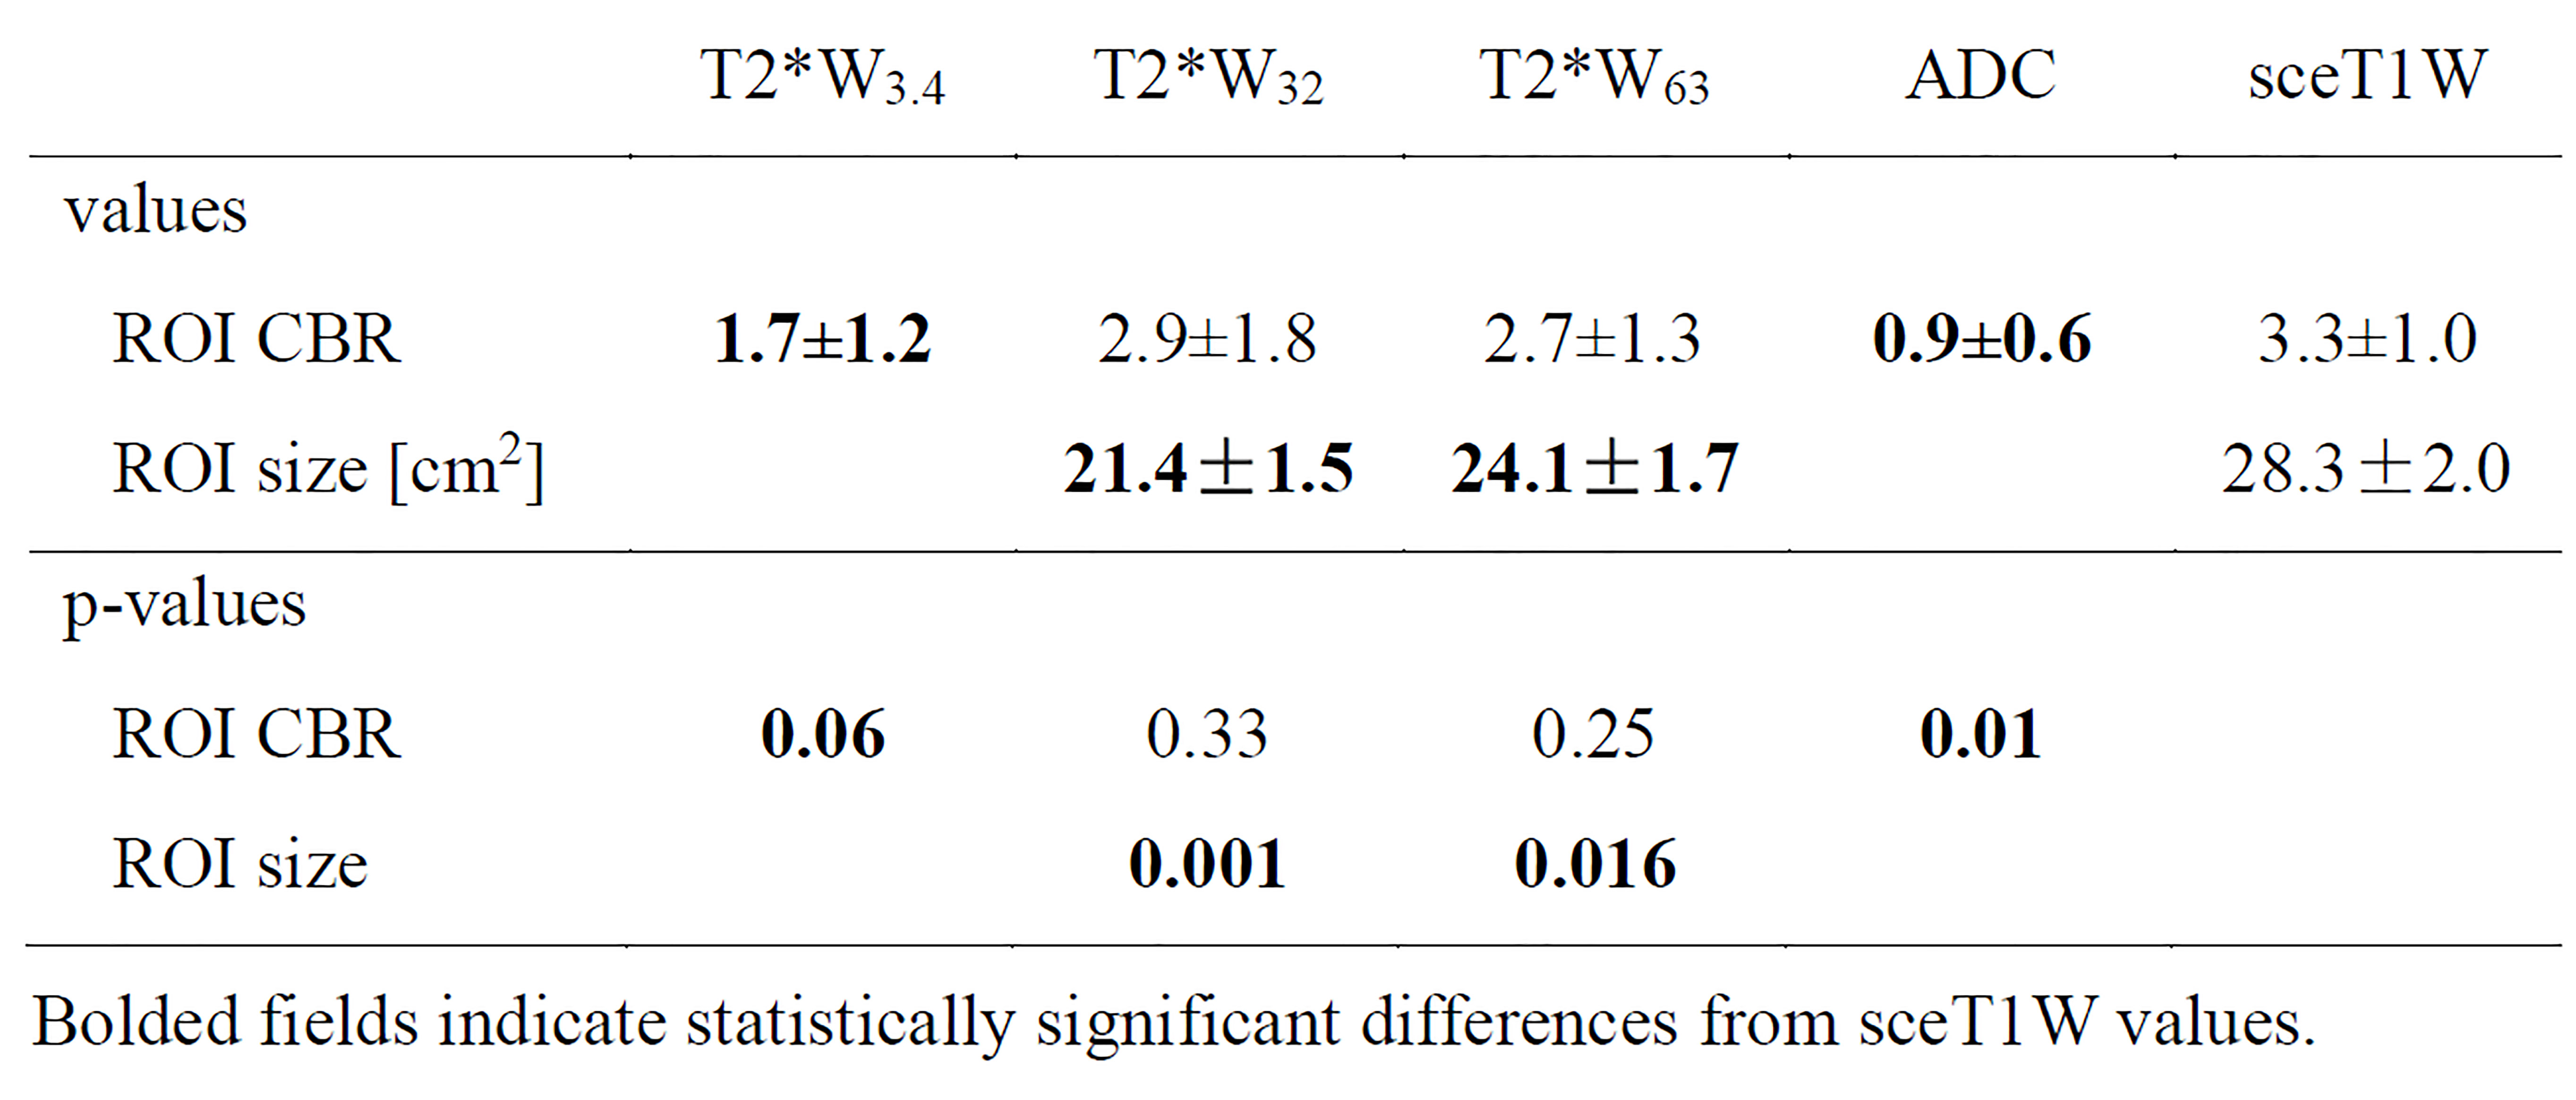
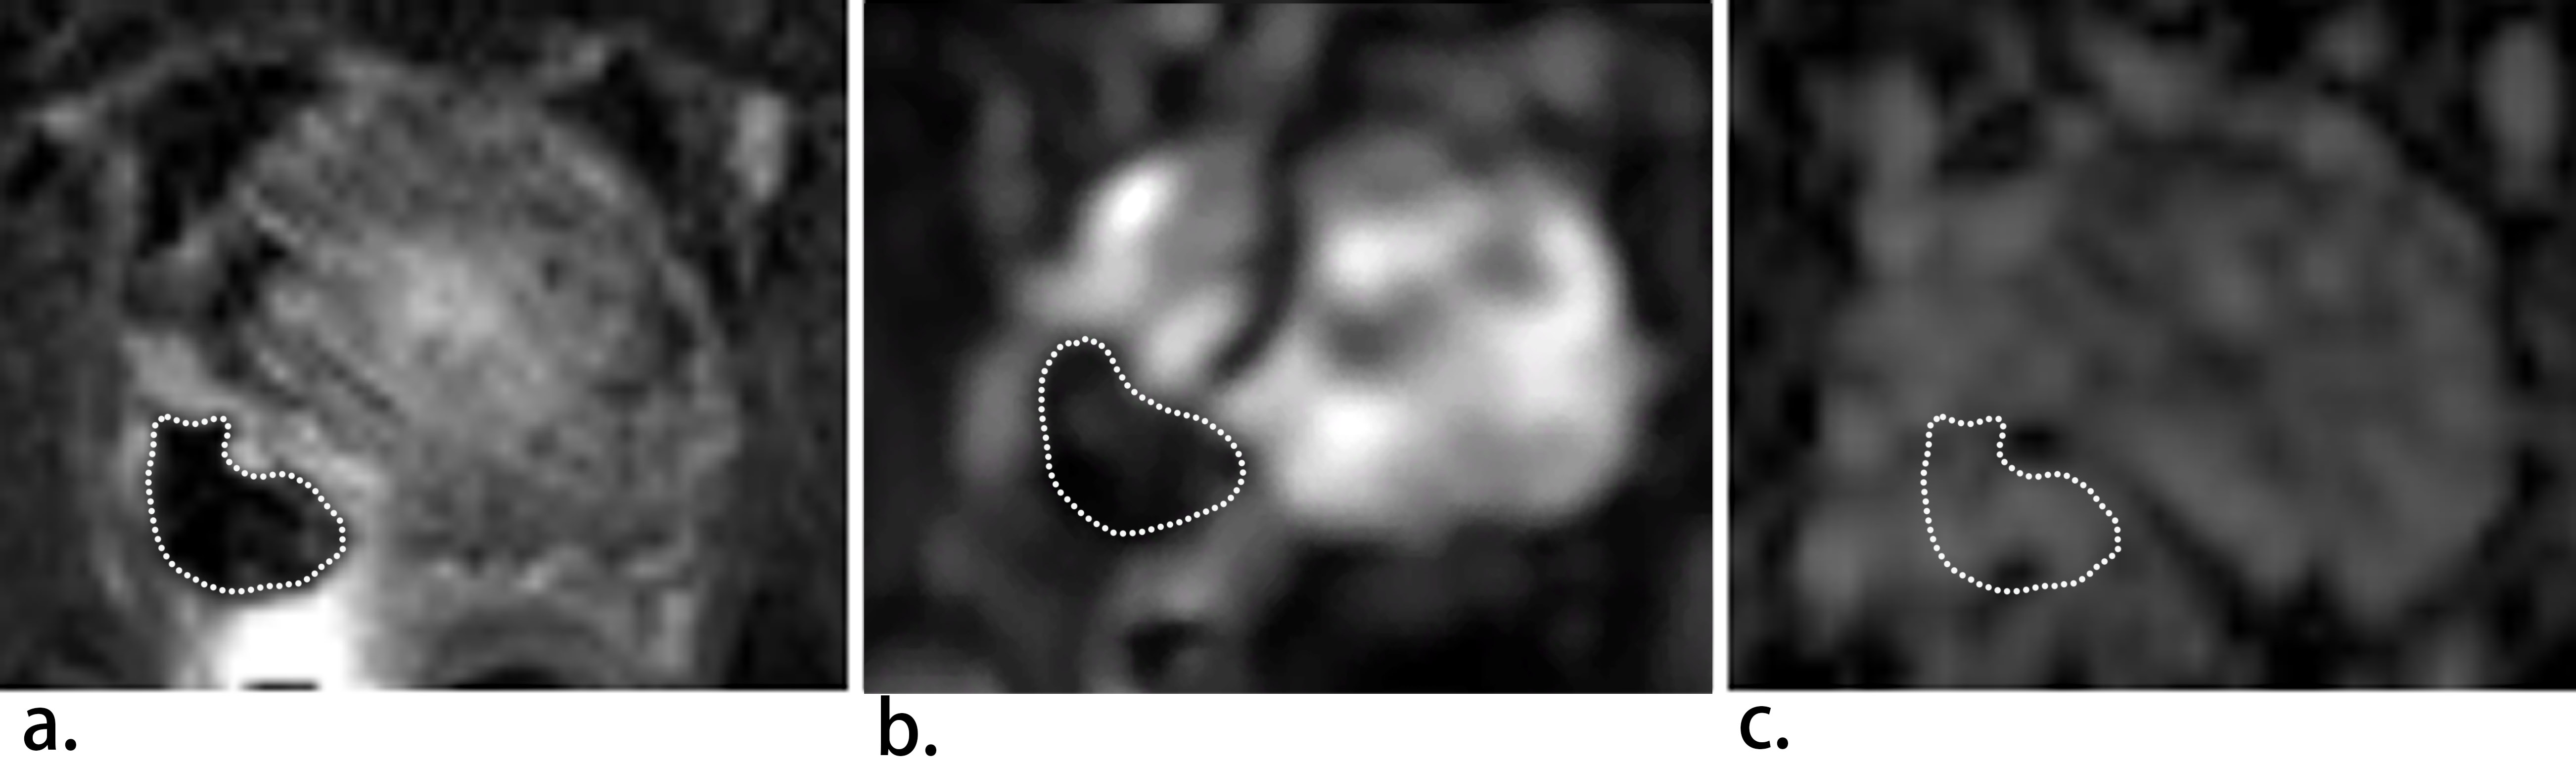
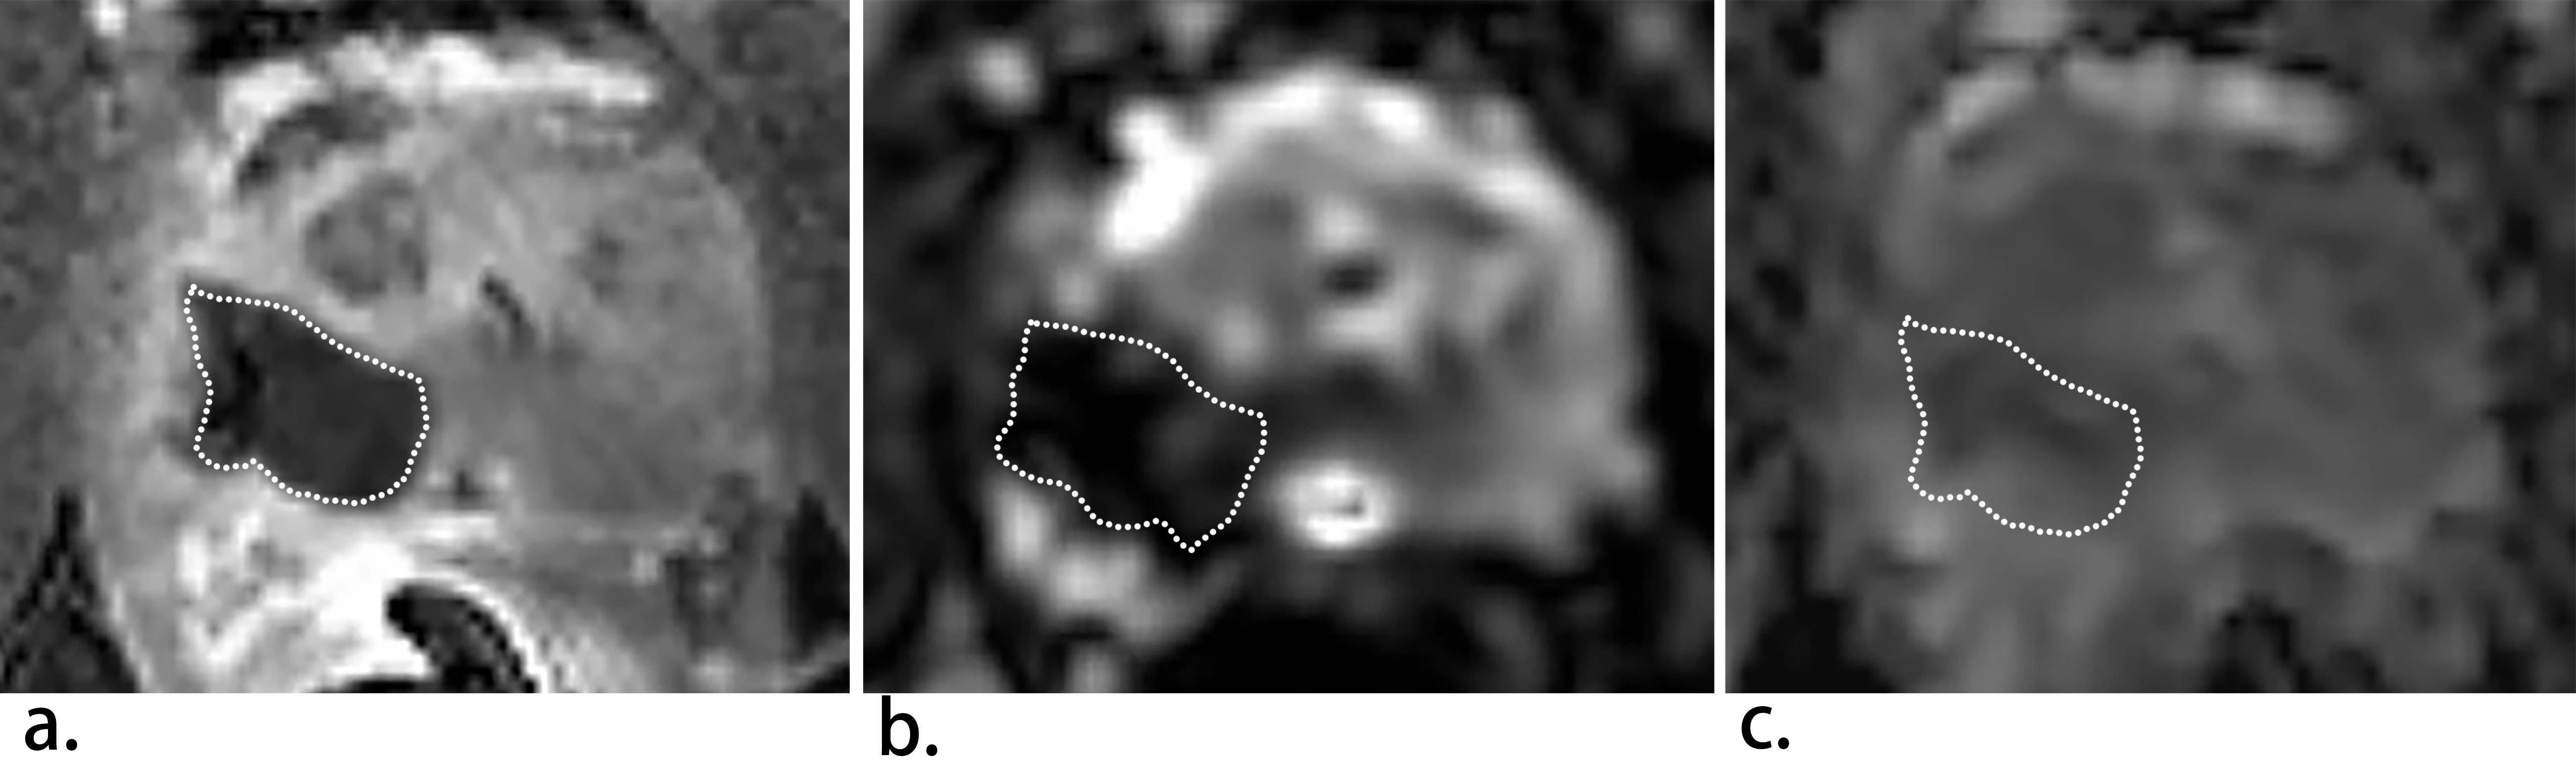
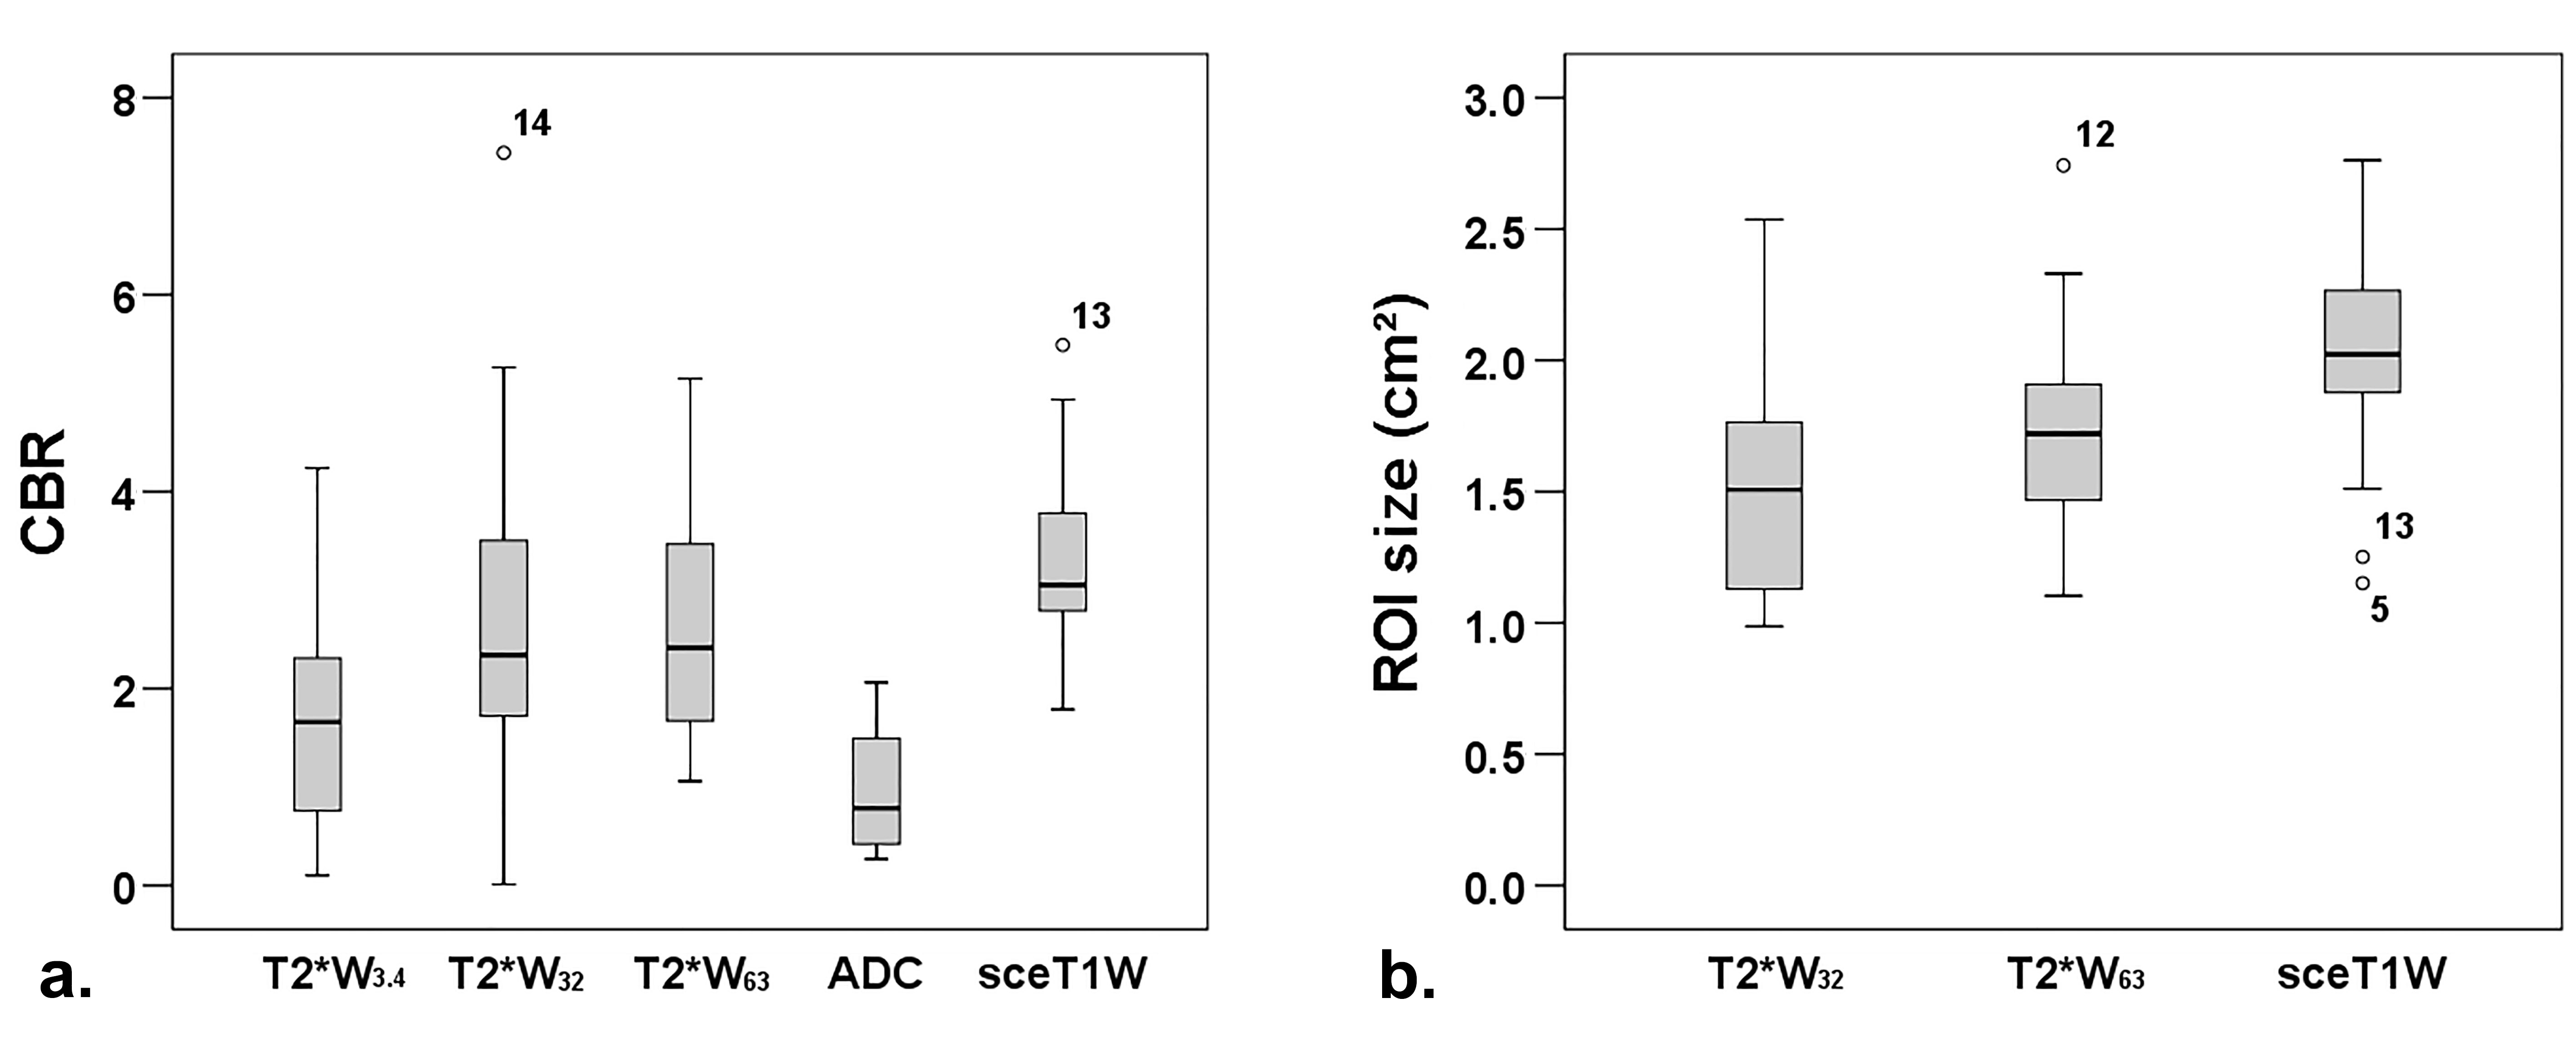
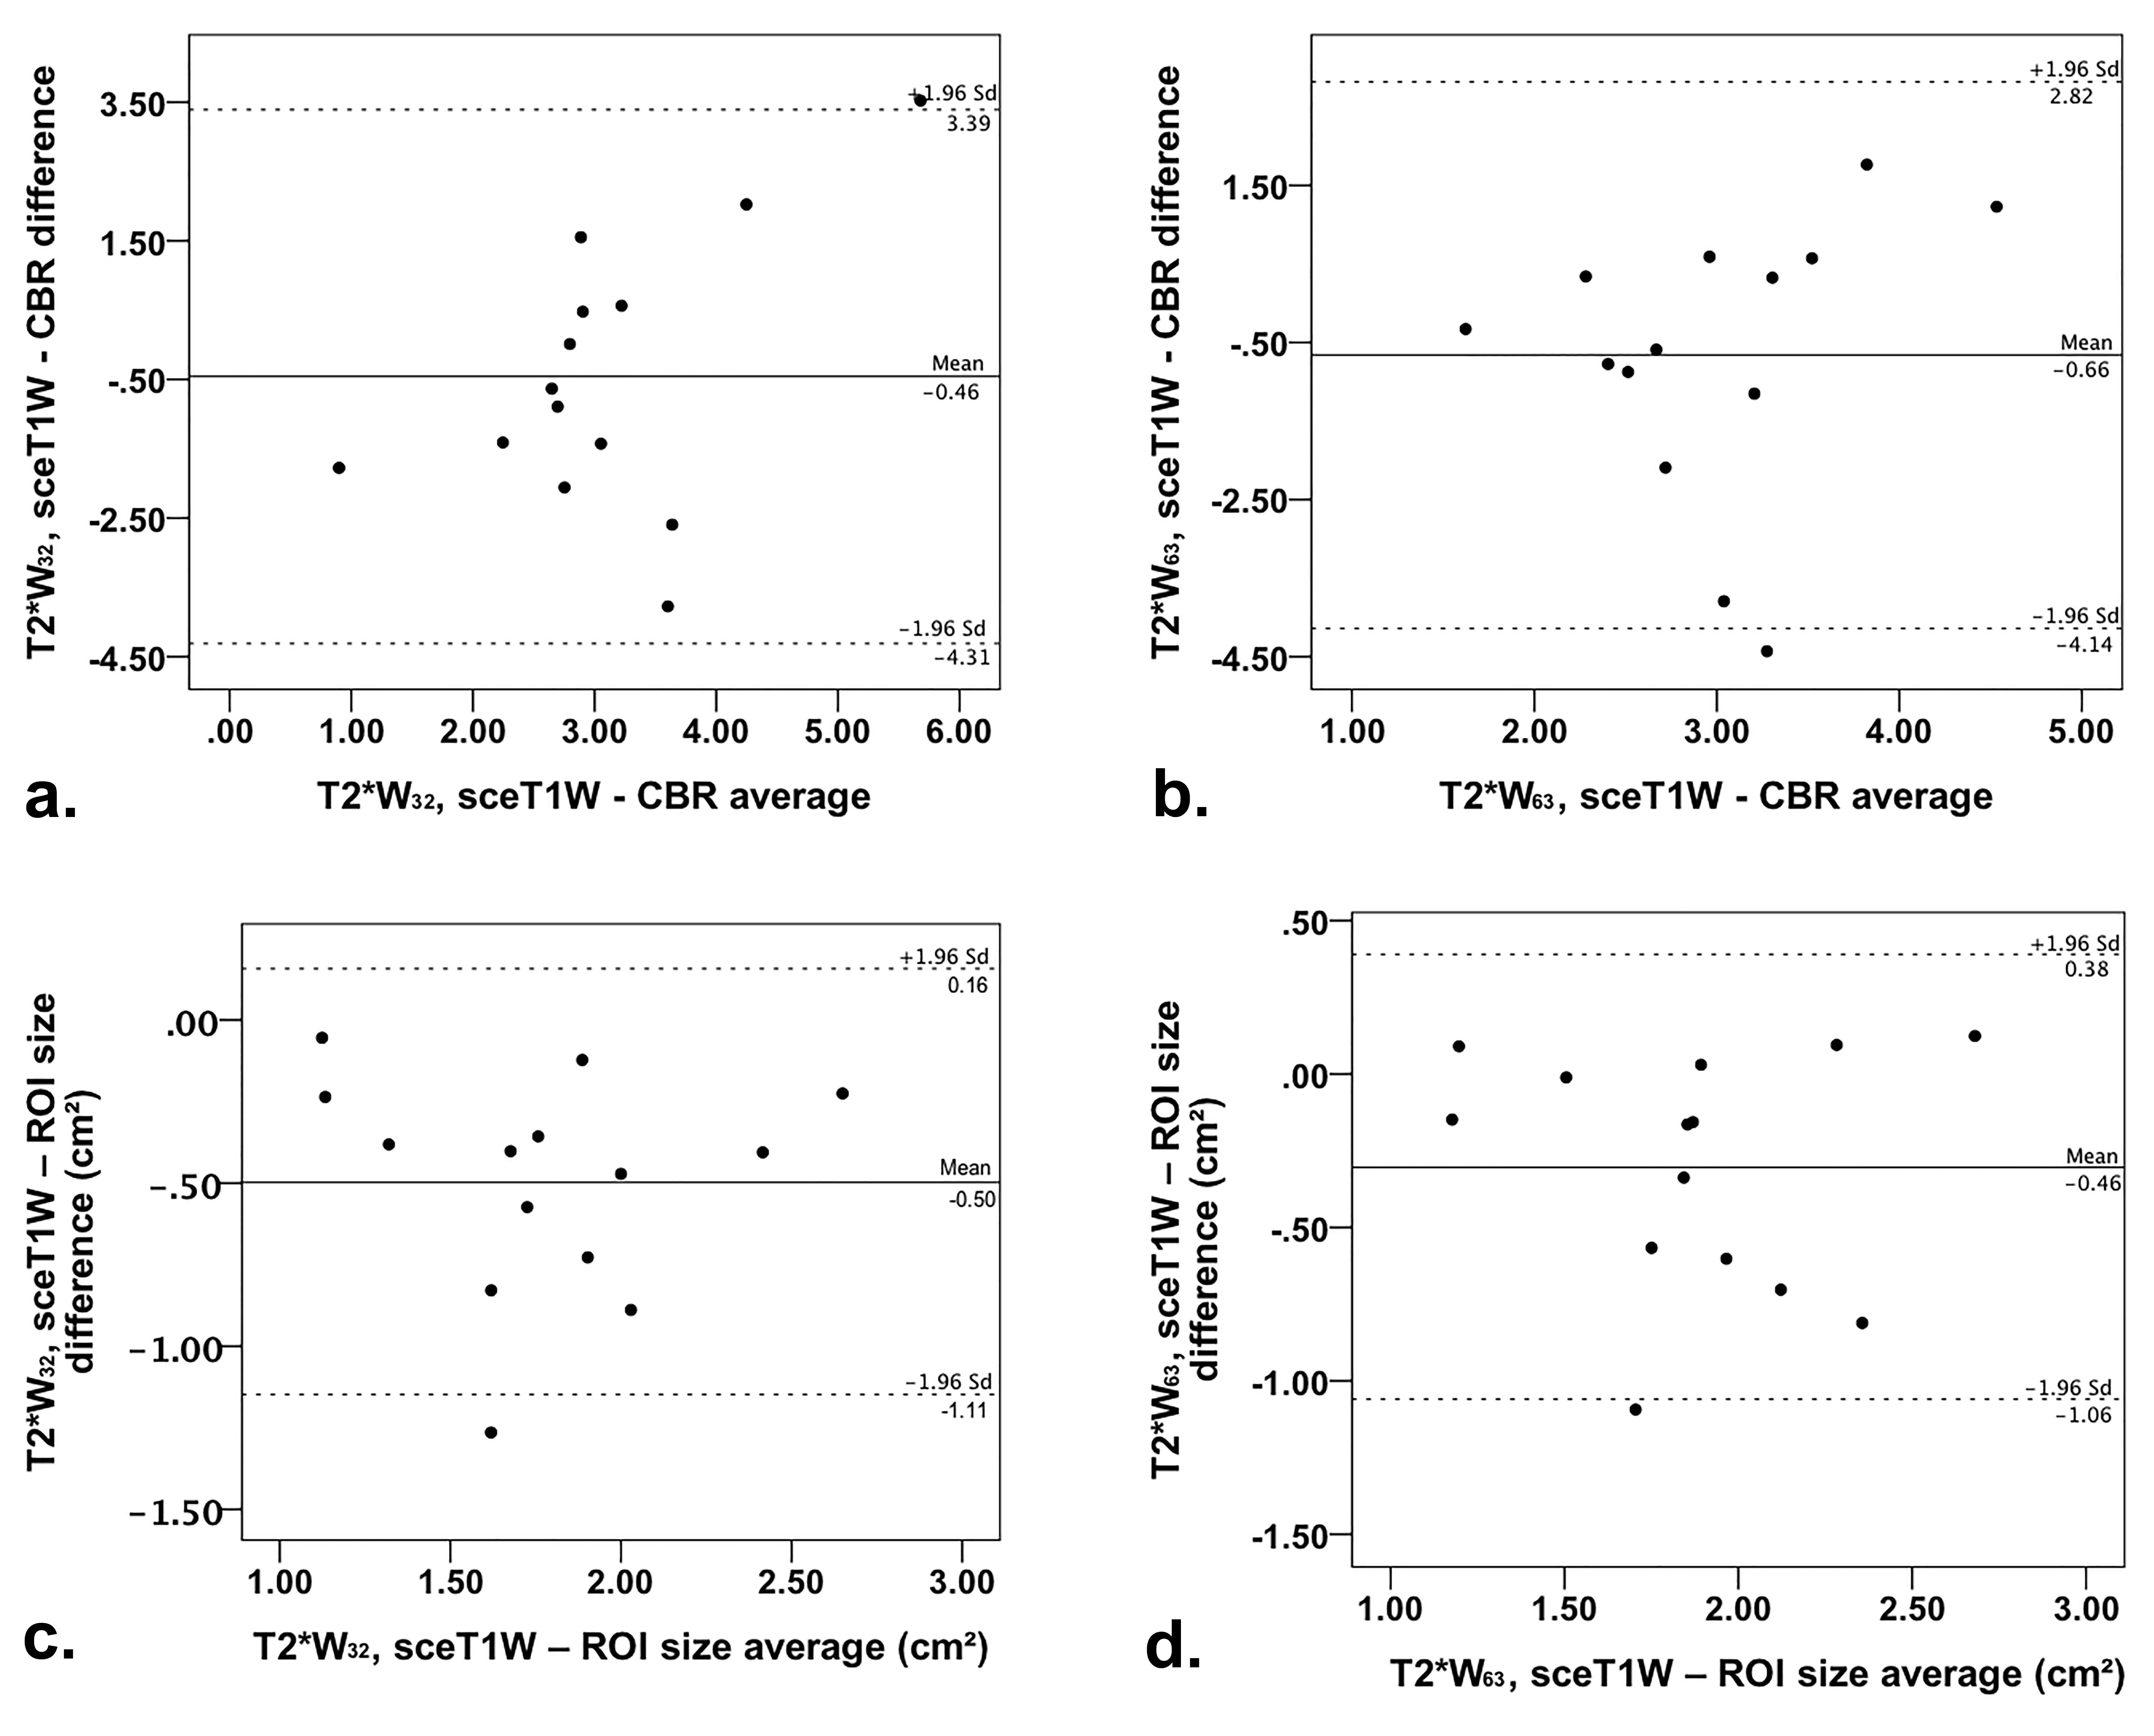
Representative examples of ablation area outlined on sceT1W images, T2*W images, and ADC maps are shown in Figures 1 and 2. The average CBR values in ablation ROI in T2*W3.4, T2*W32, and T2*W63 images, ADC maps, and sceT1W images, as well as ablation ROI sizes in T2*W32 and T2*W63 and sceT1W images, are given in Table 1. The distributions of these values are shown in Figures 3a and 3b. CBR values in ablation ROIs in T2*W32 and T2*W63 images were not statistically significantly different from those in sceT1W images. CBR values in ablation ROIs in T2*W3.4 and ADC maps were statistically significantly lower than those in sceT1W images. Bland-Altman plots of ablation ROI CBR values and sizes showed good agreement of T2*W32 and T2*W63 images vs. sceT1W images (Figure 4). Good correlation (r = 0.64, p=0.013) was found between ROI sizes in T2*W63 and sceT1W images, with ROI sizes in T2*W32 and T2*W63 images being lower that those in sceT1W images by approximately 24% and 15% (p = 0.001, 0.016), respectively.Discussion
The comparable ablation ROI size and contrast that did not differ significantly from that on sceT1W images point to T2*W imaging as a viable technique for intra-operative visualization of the ablation zone extent. As T2*W is acquired without external contrast agent and with a short imaging time, it could be used for repeated assessment of ablation site during FLA produce. The results suggest that echo times beyond 63 ms could potentially result in even better agreement between T2*W and the current standard sceT1W images in terms of ablation zone size. T2*W3.4 images and ADC maps showed inferior CBRs and are not good candidates for FLA monitoring. It has been reported previously that DWI and ADC mapping could be used to monitor prostate thermal therapy.4 But another study showed that change in ADC value depended strongly on the selection of b values, decreasing when using low, and increasing when using high b values.5 This is in agreement with our results, where an intermediate b value was used to increase SNR and poor contrast on ADC maps was observed.Conclusion
Non-contrast T2*W MR images at a long TE visualize the extent of post-procedure ablation zone comparably to the current standard contrast-enhanced T1W MRI, in terms of ROI contrast and size. This points to T2* MRI as a plausible method for repeated intra-operative thermal ablation zone monitoring.Acknowledgements
No acknowledgement found.References
1. Esserman LJ, Thompson IM, Reid B, et al. Addressing overdiagnosis and overtreatment in cancer: a prescription for change. Lancet Oncol. 2014;15(6):e234-42.
2. Wilt TJ, MacDonald R, Rutks I, et al. Systematic review: comparative effectiveness and harms of treatments for clinically localized prostate cancer. Ann Intern Med. 2008;148(6):435-48.
3. Sanda MG, Dunn RL, Michalski J. Quality of life and satisfaction with outcome among prostate-cancer survivors. N Engl J Med. 2008;358:1250.
4. Chen J, Daniel BL, Diederich CJ, et al. Monitoring prostate thermal therapy with diffusion-weighted MRI. Magn Reson Med. 2008;59(6):1365-72.
5. Ikink ME, Voogt MJ, van den Bosch MA, et al. Diffusion-weighted magnetic resonance imaging using different b-value combinations for the evaluation of treatment results after volumetric MR-guided high-intensity focused ultrasound ablation of uterine fibroids. Eur Radiol. 2014;24(9):2118-27
Figures