0829
Early Prediction of Treatment Response and Mortality in Advanced Cervical Cancer: Temporal Changes of Functional MRI and 18FDG PET/CT Radiomics
Murat Alp Oztek1,2, Stephen R Bowen2, Savannah C Partridge1, Daniel S Hippe1, William T. Yuh1, Aaron S Nelson3, Simon S Lo2, Elaine Y Lee4, Eric Leung5, John C Grecula6, Matthew Harkenrider7, Michael V Knopp6, Wei Wu1, and Nina A Mayr2
1Radiology, University of Washington, Seattle, WA, United States, 2Radiation Oncology, University of Washington, Seattle, WA, United States, 3MIM Software, Beachwood, OH, United States, 4Radiology, The University of Hong Kong, Hong Kong, Hong Kong, 5Sunnybrook Health Sciences Centre, University of Toronto, Toronto, ON, Canada, 6Ohio State University, Columbus, OH, United States, 7Loyola University, Chicago, IL, United States
1Radiology, University of Washington, Seattle, WA, United States, 2Radiation Oncology, University of Washington, Seattle, WA, United States, 3MIM Software, Beachwood, OH, United States, 4Radiology, The University of Hong Kong, Hong Kong, Hong Kong, 5Sunnybrook Health Sciences Centre, University of Toronto, Toronto, ON, Canada, 6Ohio State University, Columbus, OH, United States, 7Loyola University, Chicago, IL, United States
Synopsis
DCE, ADC and 18FDG PET/CT radiomics parameters, obtained simultaneously before, early during and midway during ongoing radiation/chemotherapy correlate with tumor response and particularly mortality, and can serve as early predictors of treatment outcome in advanced cervical cancer. Longitudinal development of functional heterogeneity may be a sensitive measure reflecting responsiveness of individual tumors to a specific cytotoxic treatment regimen. Particularly the persistence of skewness of the dynamic contrast enhancement within the tumor volume predicted cancer mortality. Functional radiomics assessment may help address the unmet need for a patient- and treatment-specific early indicator of tumor responsiveness and survival.
Abstract
INTRODUCTION: Treatment of advanced cervical cancer – a disease with major worldwide prevalence – remains a profound challenge. Advanced cervical cancer is not surgically treatable, and radiation with concurrent chemotherapy is the current standard treatment. Early prediction of treatment outcome, tumor response and mortality, is challenging with conventional staging methods.Once therapy failure is detected months/years after treatment completion, salvage therapy options are limited and cure is rare. The ability to predict tumor response/mortality during early treatment would open a window of opportunity to modify the treatment strategy early on when such adaptation is still possible and clinically most effective. Functional MRI has shown potential to assess and predict treatment response and tumor control in advanced cervical cancer. Low DCE and low ADC correlate with treatment failure. The role of 18FDG PET/CT obtained during early treatment has been largely unexplored in cervical cancer. Importantly, these three functional imaging modalities have not been studied simultaneously at defined treatment time points with respect to treatment outcome prediction.
The purpose of this research was to study DCE, ADC and 18FDG -PET imaging prospectively and simultaneously before and during the early treatment period, and to assess their temporal changes and early predictive ability for patients’ therapy response and mortality in advanced cervical cancer.
METHODS: DCE, ADC MRI (1.5T) and 18FDG PET/CT were prospectively performed in 34 patients with advanced cervical cancer at 3 time points: before (pre-) and during early and mid-treatment (2- and 4-5 weeks into treatment) in a multi-institutional international study. Patients’ treatment consisted of standard radiation therapy with concurrent Cisplatin chemotherapy. Tumor response was assessed by MRI at 1-2 months post-therapy, and patients were followed for survival outcome (mortality; median follow-up time: 2 years). For image analysis, cervical tumors were delineated on the T2W MRI. DCE ratio maps, averaged over 5 consecutive dynamic frames within the time/signal intensity curve’s plateau phase (<10 seconds temporal resolution), and ADC maps (b values = 0, 100, 600 and 1000) were generated (Figure 1). SUV heterogeneity maps were derived from the co-registered PET/CT. Voxel histogram (VH) quantiles (DCE SI10% and DWI ADC10%, FDG-PET SUVmax) and distribution moments (mean, variance, skewness, kurtosis) were derived. VH features from each imaging time point and their changes from pre-treatment values were analyzed. Changes were calculated as absolute differences and percent differences. Differences between imaging features among patients with and without tumor response were tested using the Wilcoxon rank-sum test and summarized using the area under the receiver operating characteristic curve (AUC). Disease-specific survival time was calculated as therapy completion time to either cancer death or last date where the patient was known to be alive (censored). Associations between disease-specific mortality and imaging features were evaluated using Cox regression models and summarized using hazard ratios (HR), scaled to correspond to a 1-SD increase in the feature.
RESULTS:
Mortality: Pre-therapy ADC kurtosis, coefficient of variance, mean and lowest 10th percentile (HR 2.5, 2.2, 0.4 and 2.3), and 2-week intra-therapy mean ADC and lowest 10th percentile (HR 3.2 and 2.9, respectively) significantly predicted cancer mortality (p<0.05). DCE skewness at the 2-week intra-therapy time point and the persistence of skewness between the pre- and 2-week intra-therapy time point (Figure 2) were associated with a two-fold increase in mortality (HR 2.2, p=0.038, and HR 1.8, p=0.034, respectively. A 1-SD increase in the lowest 10th percentile of DCE predicted a reduction in mortality by half (HR=0.5, p=0.017). FDG-PET predicted mortality at 5 weeks (HR 1.9, p=0.034) and show trends with greater decline in 2-week and 5-week intra-treatment SUV.
Post-therapy tumor response: A greater decrease in ADC kurtosis between pre-therapy and early 2-week intra-therapy MRI trended to correlate with higher 1-2 month post-therapy tumor response (AUC 0.70, p=0.058). Several FDG PET/CT parameters were associated with response, including higher pre-therapy mean SUV (AUC 0.76, p=0.014), greater SUV decrease from the pre-therapy to 2-week intra-therapy PET/CT (AUC=0.77, p=0.011), and greater SUV decrease from pre-therapy to 5-week intra-therapy (AUC=0.80, p=0.005).
DISCUSSION: This imaging–outcome correlation of functional imaging methods suggests that all three modalities have potential to predict cancer outcome at variable time points in the ongoing radiation/chemotherapy course. Our results suggest that persistent heterogeneity of perfusion distribution within the tumor volume, as indicated by a lesser decrease of DCE skewness, and continued low perfusion during very early therapy signal poor long-term outcome with higher mortality. This may be explained by persistent hypoxia early during the treatment course, resulting in ultimate therapy resistance, recurrence and metastases. The corresponding correlation of persistent ADC skewness in early therapy with tumor non-response suggests the potential detriment of persistent heterogeneity of diffusion within the tumor. FDG PET metabolic parameters, specifically a decrease in mean SUV early and midway during therapy, are strong predictors of 1-month post-therapy tumor response, signaling declining tumor metabolic activity.
CONCLUSION: DCE-, DWI-MRI and FDG PET radiomics parameters show functional heterogeneity across modalities and imaging times. Persistent high heterogeneity in DCE and DWI in early therapy may signal adverse treatment outcome. These early findings require confirmation and longer clinical follow-up to establish the imaging modalities and times that provide most accurate and earliest prediction of therapy outcome.
Acknowledgements
No acknowledgement found.References
No reference found.Figures
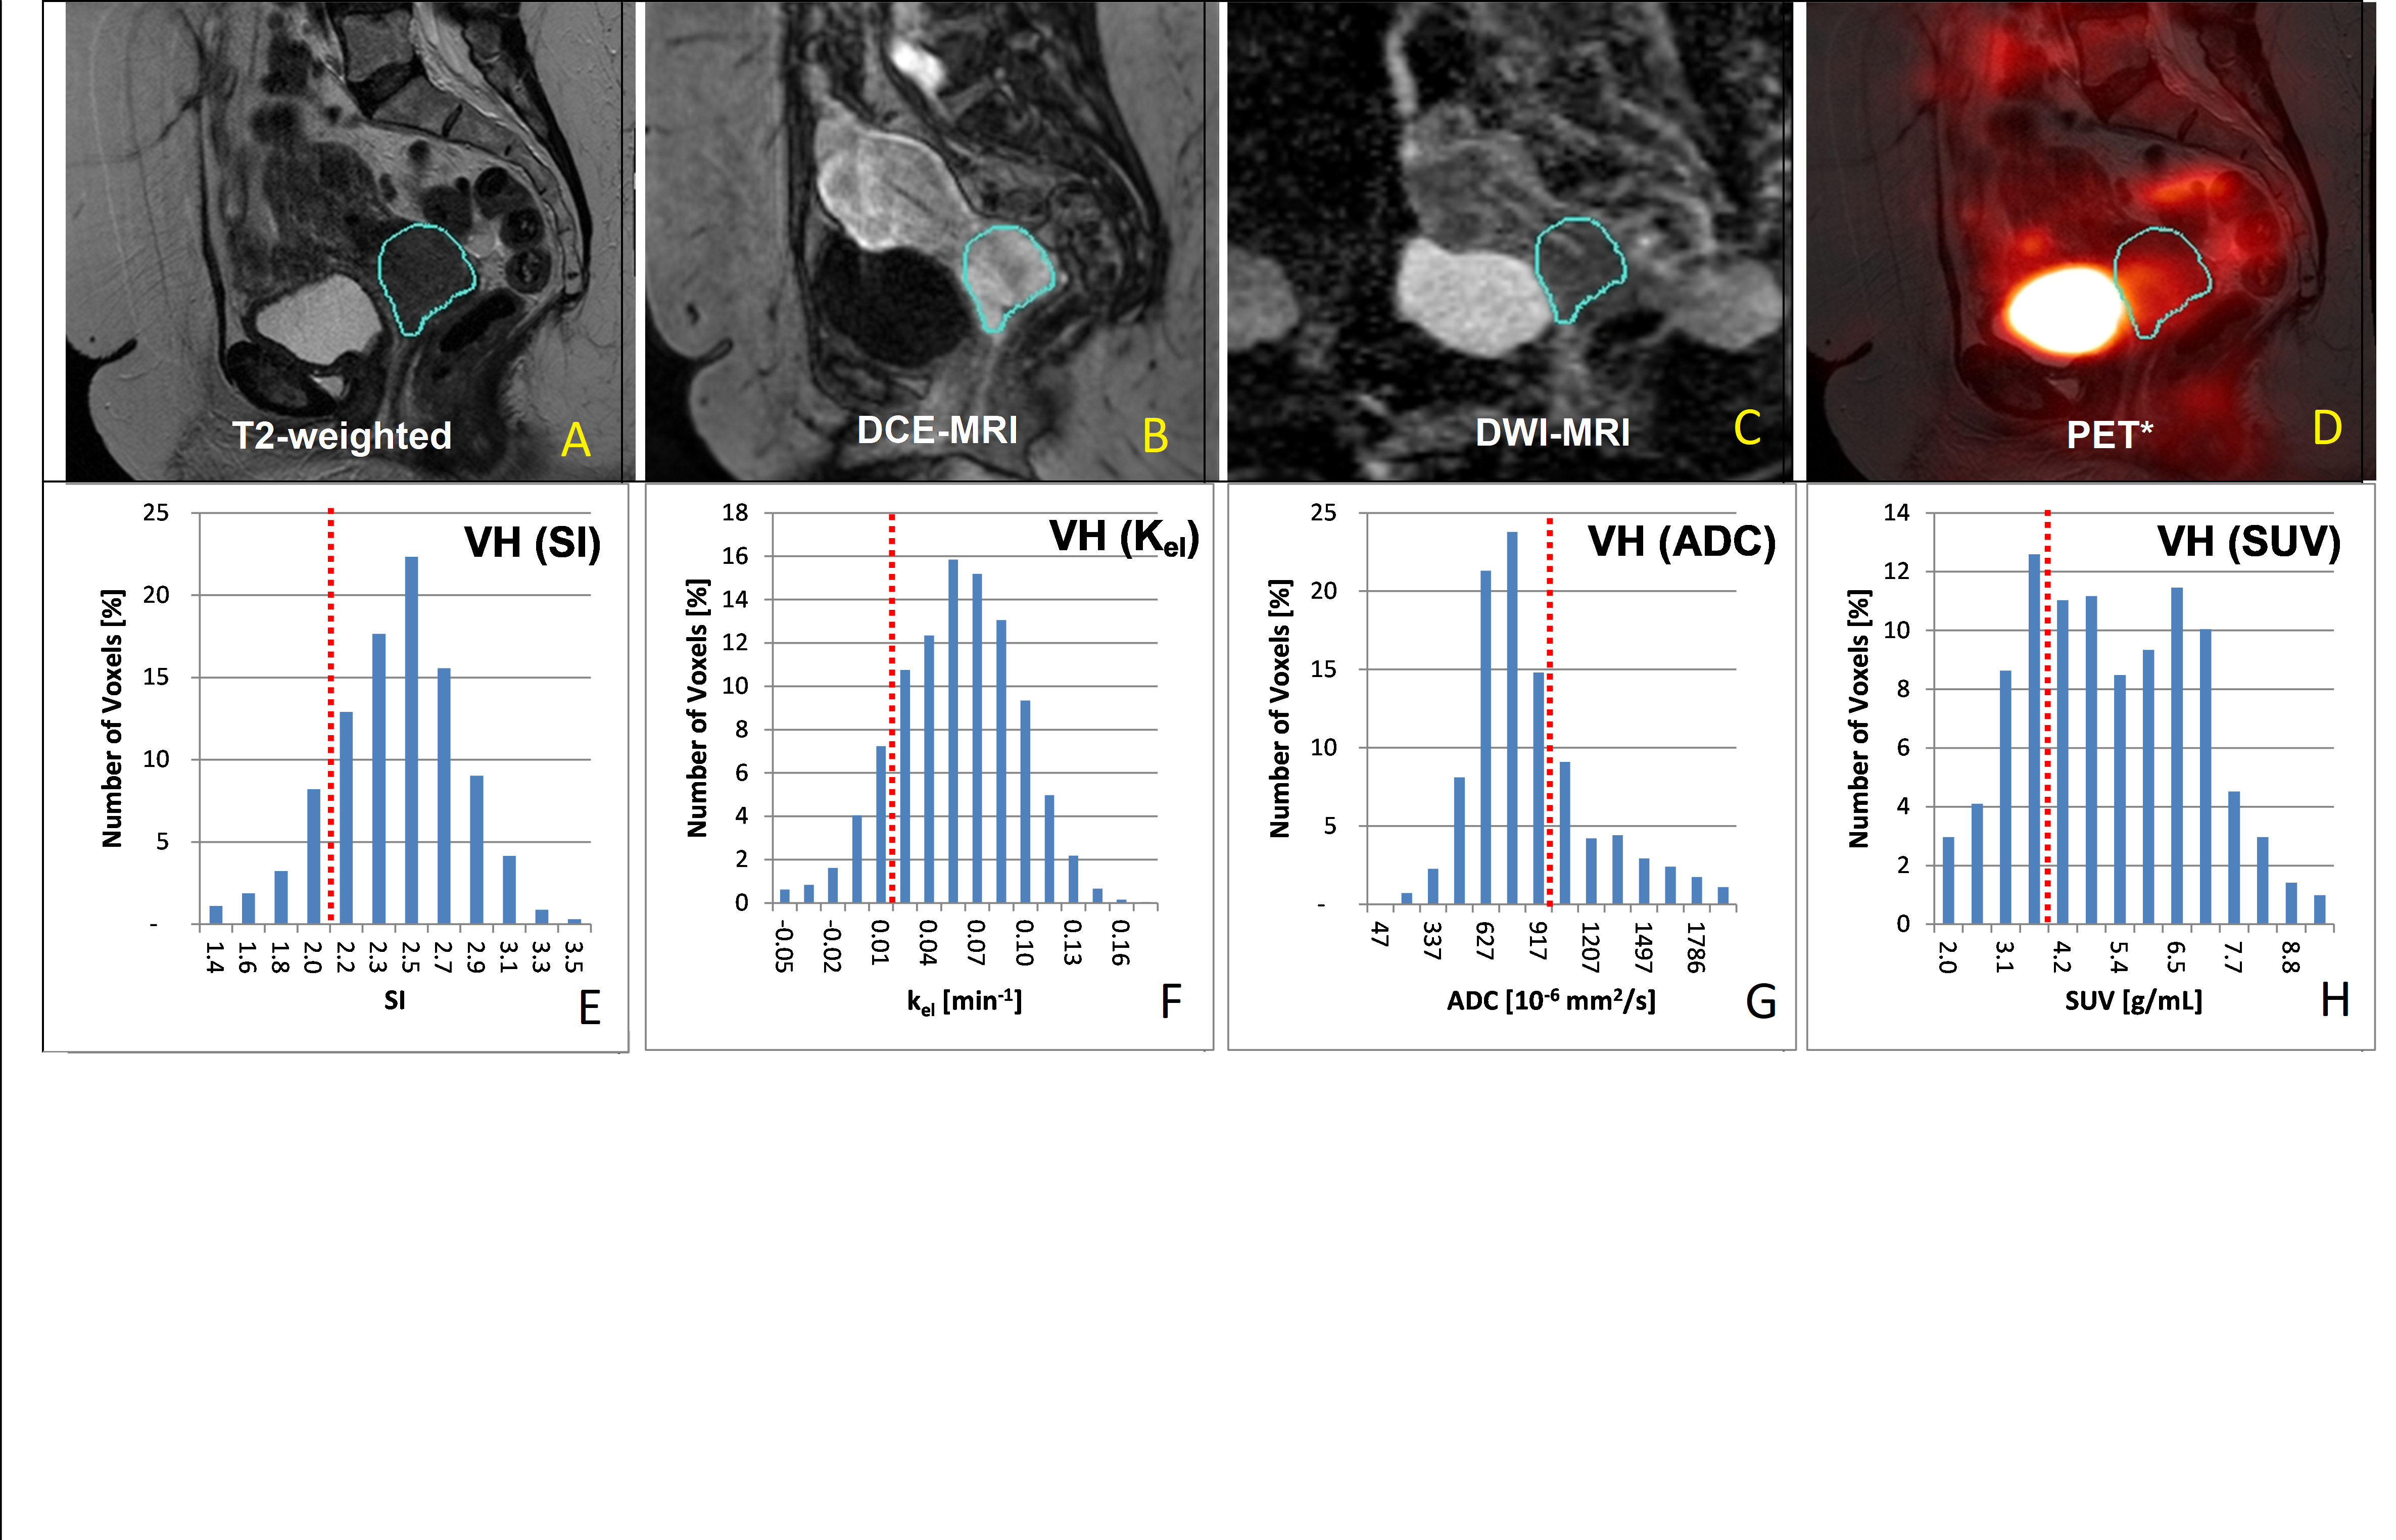
Different functional parameters
to reflect tumor heterogeneity:
DCE, ADC and FDG-PET studies at 2-weeks into treatment
are shown. The tumor region (aqua-colored
ROI) is defined on T2WI (A) and mapped
to all co-registered functional imaging data sets: DCE MRI (B),
DWI (C) and FDG-PET (D) to derive their respective voxel
distribution intensity histograms (VH, lower row). Note the highly variable
heterogeneity reflected by the various voxel signal intensities in the VHs owing to the different biological properties reflected by DCE, ADC and PET.
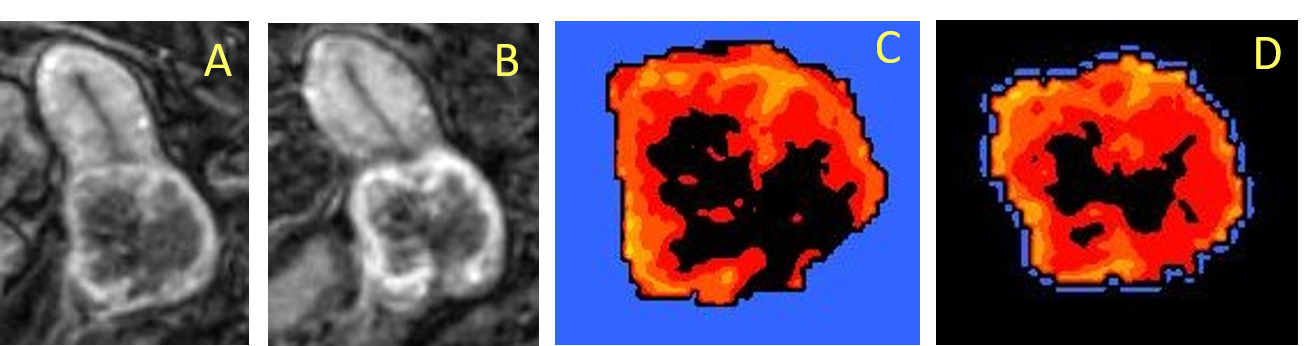
Tumor
heterogeneity pattern as reflected by the skewness of the DCE: Examples of DCE imaging (A and B), DCE ratios
(C, D) and DCE Voxel Histograms (E, F), obtained before treatment and 2 weeks
into treatment respectively. Persistent heterogeneity of perfusion distribution
within the tumor volume, as indicated by a lesser decrease of DCE skewness (F and E), and continued low perfusion at 2-weeks (B vs A, and D vs C) signal poor
long-term outcome with higher mortality.