0828
3D O2-Enhanced MR Imaging vs. Thin-Section CT: Capability for Pulmonary Functional Loss Assessment and Clinical Stage Classification in Smokers1Radiology, Fujita Health University School of Medicine, Toyoake, Japan, 2Radiology, Kobe University Graduate School of Medicine, Kobe, Japan, 3Canon Medical Systems Corporation, Otawara, Japan, 4Diagnostic Radiology, Hyogo Cancer Center, Akashi, Japan
Synopsis
No one directly compare this new technique with quantitatively assessed CT for pulmonary functional loss evaluation and The Global Initiative for Chronic Obstructive Lung Disease (GOLD) classification in smokers. We hypothesized that regional ΔT1 change from 3D O2-enhanced MRI has a potential for pulmonary functional loss assessment and clinical stage classification as well as quantitatively assessed thin-section CT in smokers. The purpose of this study was to prospectively and directly compare the quantitative capability for pulmonary functional loss assessment and clinical stage classification between 3D O2-enhanced MRI and thin-section CT in smokers.
Introduction
Thin-section CT and nuclear medicine ventilation and/or perfusion studies have been tested for evaluation of morphological changes or regional pulmonary functional changes in smoking-related chronic obstructive pulmonary diseases in the last several decades. In addition, oxygen-enhanced MR imaging (O2-enhanced MRI) and hyperpolarized noble gas MR imaging have been examined for assessing smoking-related chronic obstructive pulmonary disease (COPD) based on academic and clinical purposes since 2000's. Based on past reports (1-3), it has been reported that O2-enhanced MRI has been suggested as having the potential for not only ventilation, but also oxygen diffusion at alveoli, and useful for regional ventilation assessment in smoking-related COPD. However, the drawbacks of previously reported O2-enhanced MRI was 2D acquisition using half-Fourier acquisition single-shot turbo spin echo (HASTE) sequence at 3 different planes, time consuming, difficulty for T1 value change assessment and higher specific absorption rate (SAR) level at 3T MR system than that at 1.5T MR system, etc. In this situation, we developed 3D O2-enhanced MRI for 3T system and make it possible to quantitatively evaluate regional T1 value change (ΔT1) within the entire lung. On the other hands, no one directly compare this new technique with quantitatively assessed CT for pulmonary functional loss evaluation and The Global Initiative for Chronic Obstructive Lung Disease (GOLD) classification in smokers.We hypothesized that regional ΔT1 change from 3D O2-enhanced MRI has a potential for pulmonary functional loss assessment and clinical stage classification as well as quantitatively assessed thin-section CT in smokers. The purpose of this study was to prospectively and directly compare the quantitative capability for pulmonary functional loss assessment and clinical stage classification between 3D O2-enhanced MRI and thin-section CT in smokers.
Materials and Methods
Fifty-six consecutive smokers (32 men and 24 women; age rang 40-85 years) underwent 3D O2-enhanced MRI at a 3T system, thin-section CT and pulmonary function test (%FEV1 and %DLCO/VA). All smokers were classified into four stages (‘Without COPD’, ‘Mild COPD’, ‘Moderate COPD’, ‘Severe or very severe COPD’) according to the GOLD guideline. In each smoker, 3D O2-enhanced MRI was obtained by 3D Fast Field Echo pulse sequence with multiple flip angle technique (TR 3.0ms/ TE 1.1ms, flip angle 2, 6, 10 and 14 degrees, SPEEDER factor= 2.0, section thickness 7.5 mm×18 slices or 10 mm×24 slices) with breath holding at end-inspiration at each flip angle acquisition. All O2-enhanced MRI data were fused with pulmonary thin-section MRI with ultra-short TE and analyzed by our proprietary software provided by Canon Medical. With non-rigged registration software, regional ΔT1 map was generated between room air and 100% oxygen inhalation after 3 minutes from O2-enhanced MR data by pixel by pixel analyses. Then, ROIs were placed over the lung on all slices, and averaged to determine mean ΔT1 in each subject. On quantitative CT in each subject, percentage of low attenuation area within entire lung (LAA%) was also measured.To compare the capability for pulmonary functional loss assessment, both indexes were correlated with each parameter. Then, both indexes were compared four clinical stages by Tukey’s HSD test. Finally, discrimination analyses were performed, and accuracies of both indexes were compared each other by McNemar’s test.
Results
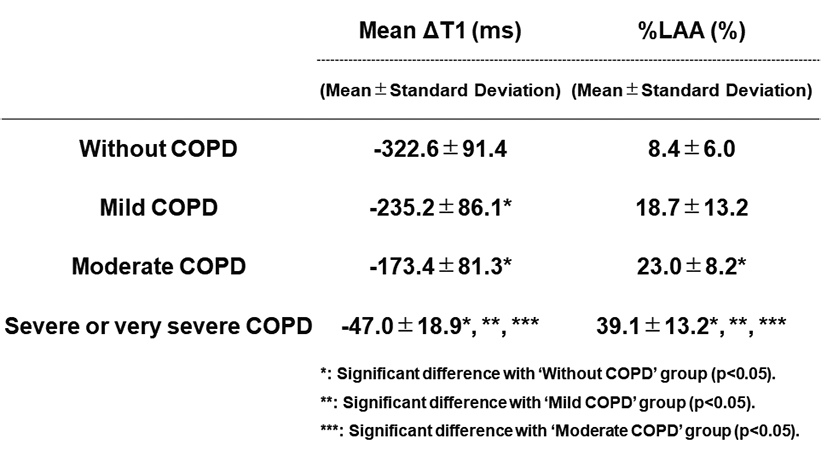
Representative cases are shown in Figure 1. Correlations between each pulmonary functional parameter and both indexes (mean ΔT1: 0.46<r2<0.71, %LAA: 0.50<r2<0.57). Result of comparison of each index among GOLD classifications is shown in Figure 2.ΔT1 and LAA% were significantly correlated with %FEV1 (ΔT1: r=-0.83, p<0.0001; LAA%: r=-0.73, p<0.0001) and %DLCO/VA (ΔT1: r=-0.73, p<0.0001; LAA%: r=-0.69, p<0.0001).
ΔT1 had significant difference between ‘Without COPD’ and others (p<0.05), between ‘Mild COPD’ and ‘Severe or very severe COPD’ (p<0.05), and between ‘Moderate COPD’ and ‘Severe or very severe COPD’ (p<0.05). LAA% of ‘Without COPD’ had significant difference with that of ‘Moderate COPD’ (p<0.05) and ‘Severe or very severe COPD’ (p<0.05). In addition, LAA% of ‘Severe or very severe COPD’ had significant difference with that of ‘Mild COPD’ or ‘Moderate COPD’ (p<0.05). Discrimination accuracy of ΔT1 (66.1 [37/56] %) was significantly higher than that of LAA% (50.0 [28/56] %, p<0.05).
Conclusion
3D O2-enhanced MRI at 3T system has a better potential for pulmonary functional loss assessment and clinical stage evaluation than quantitatively assessed CT in smokers, and may be able to be applicable in routine clinical practice.Acknowledgements
Authors wish to thank Mr. Katsusuke Kyotani and Prof. Takamichi Murakami in Kobe University Hospital for their valuable contributions to this study.References
- Ohno Y, Hatabu H, Takenaka D, et al. Magn Reson Med. 2002 ; 47(6):1139-1144.
- Ohno Y, Iwasawa T, Seo JB, et al. Am J Respir Crit Care Med. 2008; 177(10): 1095-1102.
- Fuseya Y, Muro S, Sato S, et al. PLoS One. 2018; 13(8): e0203273.
Figures
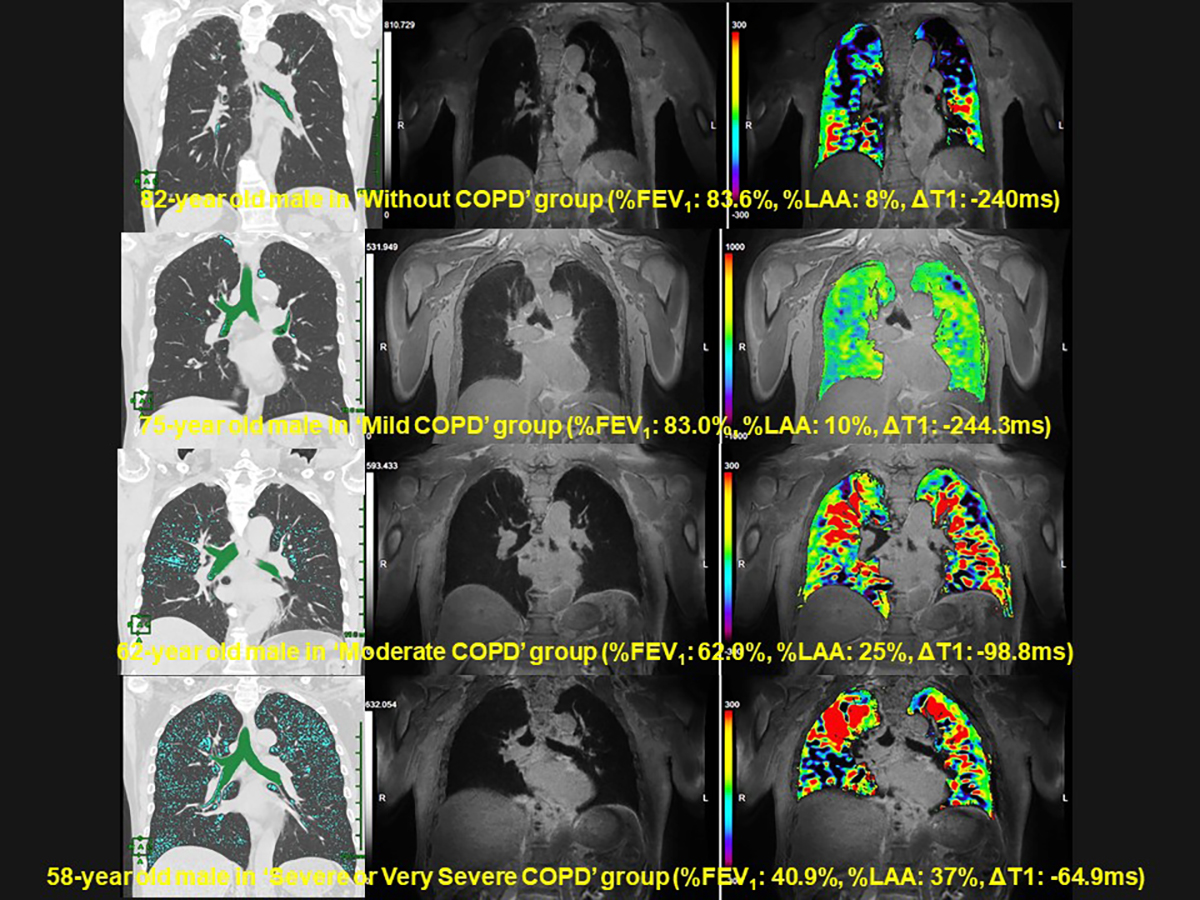
Figure 1. Representative cases of 3D O2-enhanced MRI
From top to low lines (L to R : quantitative CT, pulmonmary MRI with ultra-short TE and ΔT1 map fused with MRI with ultra-short TE) show “Without COPD”, “Mild COPD”, “Moderate COPD” and “Severe or very severe COPD”. ΔT1 is prolonged according to severity of COPD.