0827
Comprehensive Analysis of Bladder Wall Perfusion and Deformation in BPH patients using MRI1Biomedical Engineering, University of Wisconsin, Madison, WI, United States, 2Radiology, University of Wisconsin, Madison, WI, United States, 3Urology, University of Wisconsin, Madison, WI, United States, 4Medical Physics, University of Wisconsin, Madison, WI, United States, 5Mechanical Engineering, University of Wisconsin, Madison, WI, United States
Synopsis
Male urogenital disease is a common problem, and non-invasive methods for diagnosis and disease progression tracking are limited. This study was aimed at developing an MRI-based method to characterize urogenital tissue morphology, bladder-prostate interaction, and blood flow perfusion. These methods were tested in three patients with BPH and three healthy volunteers. Strong correlation between void fraction and prostate volume was found. Future work will be aimed at applying these methods to larger cohorts so that clinical utility may be further understood.
INTRODUCTION
Benign prostatic hyperplasia (BPH) affects approximately 75% of men over the age of 60 in the United States [1]. Along with BPH, lower urinary track symptoms (LUTS) and bladder dimension changes are a common development in this population [2,3]. Studies have examined the effects of bladder dimensional properties and urogenital perfusion on LUTS development, BPH, and a variety of other health complications [4,5]. However, the complex dynamics of the full male urogenital system and their effects on symptom development are still not fully understood. Furthermore, non-invasive analysis and diagnostic methods for prostate and bladder health pathologies have previously been limited. We hypothesize that factors such as urogenital organ blood perfusion, bladder-prostate interaction, urogenital organ morphology, and bladder wall dynamics play a major role in disease progression in the BPH population. Fortunately, MRI has the potential to analyze many of these factors in a single imaging session. Therefore, in this study, we aimed to use MRI to characterize the multi-factorial relationship between urogenital organ perfusion and bladder wall deformation in BPH patients.METHODS
In this IRB-approved and HIPAA–compliant study, three healthy volunteers and three patients with BPH were recruited. All MRIs were performed on a clinical 3T scanner (Premier, GE Healthcare, Waukesha, WI) using a high-density flexible surface coil array (AIR Coil, GE Healthcare). The prostate and detrusor muscle were segmented (Mimics, Materialize, Leuven, Belgium) from fast spin echo (FSE) T2-weighted acquisitions, allowing for 3D visualization and measurement of prostate volume (PV) and bladder volume (BV) before and after voiding allowing the calculation of void fraction (VF = BVpre – BVpost)/BVpre). Similarly, 3D variable density k-space sampling with 2-pt dixon fat water separation images were used to analyze contrast uptake in the bladder wall and prostate as a marker of perfusion in the BPH patients. Segmented masks of the bladder wall and prostate were imposed on 31 sequential time frames, and average signal intensities of each mask were recorded. Additionally, an MRI urodynamics protocol was implemented where BPH patients were equipped with a condom catheter system that allowed them to void during the imaging session. Subjects were instructed to drink approximately 1 liter of water immediately before the imaging session. Sagittal 2D spoiled gradient echo (SGRE) dynamic real-time images capturing the bladder neck and urethra were constantly acquired for four minutes in order to characterize voiding. To this end, patients were instructed to start voiding once the SGRE sequence started acquiring. Real-time images were segmented to evaluate the voiding rate and deformation patterns of the bladder. Healthy volunteers were asked to void in the bathroom and return for a post void scan. Finally, 3D multi-echo chemical shift encoded MRI (IDEAL IQ) was acquired to quantify liver proton density fat-fraction (PDFF).RESULTS
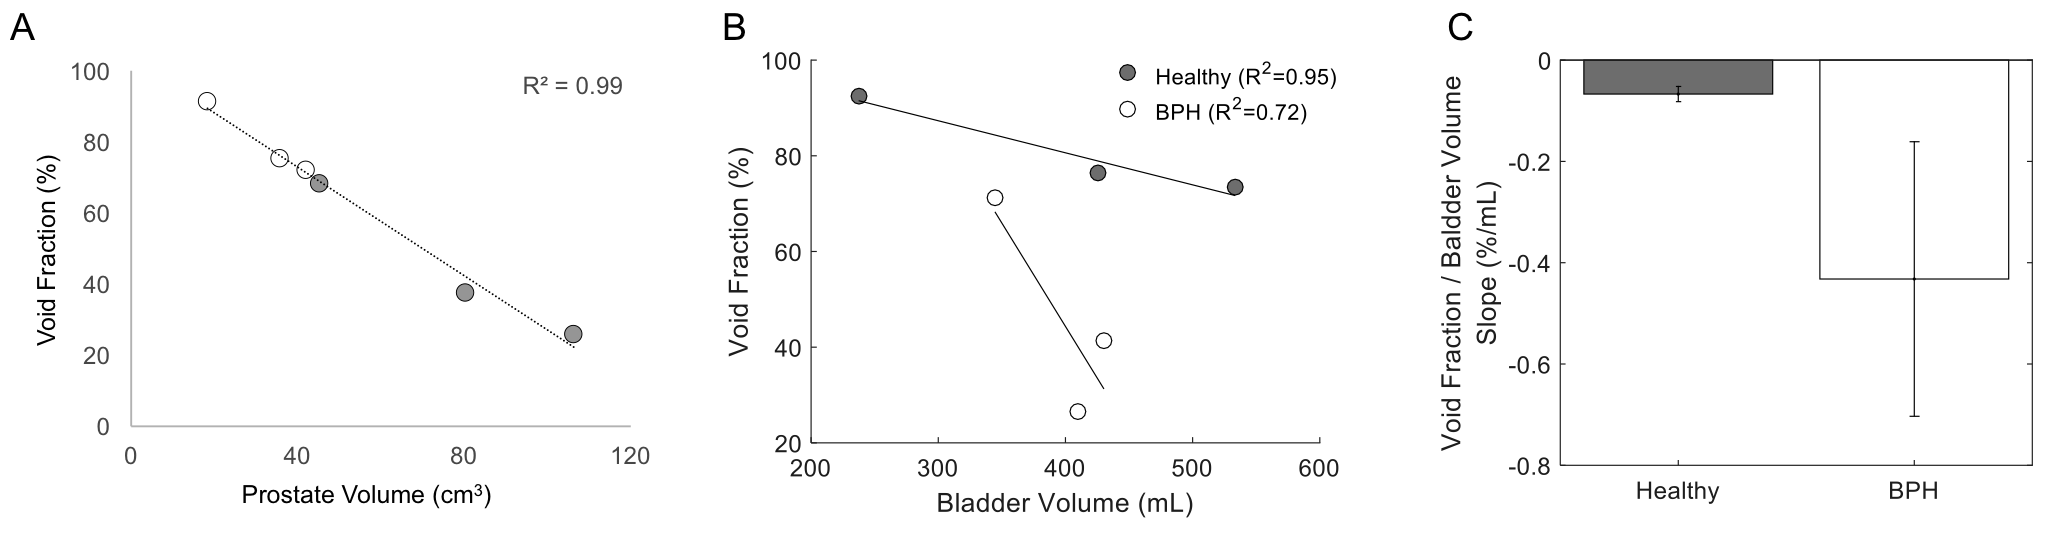
A comprehensive urodynamics MRI protocol was successfully implemented to non-invasively evaluate the multi-factorial relationship between urogenital organ perfusion and bladder wall deformation in BPH patients. Figure 1 shows excellent correlation between VF and PV (R2= 0.99) as well as VF and prevoid BV (R2= 0.95 for healthy and R2= 0.72 for BPH patients). BPH patients had a higher impact of prevoid VB on VF compared to healthy subjects (Fig1C). Figure 2 shows real time sagittal images for the three BPH patients. Patient BPH1 had the shortest voiding time, however his residual volume was the largest. On the other hand patient BPH3 had the longest voiding time but the smallest residual volume. Figure 3 shows three-dimensional (3D) bladder deformation maps of a healthy volunteer and a BPH patient estimated from computational interpolation between pre and post void MRI. Larger deformation in the dome of the bladder is seen in the healthy subject whereas limited deformation is seen in the BPH patient. Figure 4 shows a sagittal view of the time of arrival of contrast to the bladder wall and prostate. In general, contrast uptake was higher in the prostate than in the bladder. Interestingly patient BPH3 had the lowest contrast uptake. Liver PDFF which was elevated only in patient BPH3 (33%) compared to (4% and 6% in patients BPH1 and BPH2 respectively).DISCUSSION
Non-invasive analysis methods for common male urogenital disease have been limited in the past. This study used of MRI to analyze relationships between urogenital perfusion and tissue deformation in patients with BPH. Tissue volumes were successfully quantified, wall deformation was characterized, and urogenital perfusion was tracked. As expected, results indicated that larger prostate volume is associated with a diminished bladder voiding. Additionally in our small cohort, for BPH patients VF is affected by pre void BV. However, further study is needed to clarify these relationships. The analysis methods, and resulting metrics, proposed in this study may be of value for diagnosis and tracking urogenital disease progression over time. Future work will expand the use of these methods to more patients, so that the clinical utility of these measures may be better understood.CONCLUSION
MRI was used to characterize the multi-factorial relationship between urogenital organ perfusion and bladder wall deformation in BPH patients. Future work will be aimed at applying these methods to larger cohorts, so that clinical utility may be further understood.Acknowledgements
The research presented was supported by the NIH (K12DK100022 ). The authors also wish to acknowledge support from GE Healthcare who provides research support to the University of Wisconsin.References
1. Wei JT, Calhoun E, Jacobsen SJ (2005) UROLOGIC DISEASES IN AMERICA PROJECT: BENIGN PROSTATIC HYPERPLASIA. J Urol ® 173:1256–12612.
2. Fananapazir G, Kitich A, Lamba R, Stewart SL, Corwin MT (2018) Normal reference values for bladder wall thickness on CT in a healthy population. Abdom Radiol 43:2442–24453.
3. Güzel Ö, Aslan Y, Balcı M, Tuncel A, Keten T, Erkan A, Atan A (2015) Can Bladder Wall Thickness Measurement Be Used for Detecting Bladder Outlet Obstruction? Urology 86:439–444
4. Mirone V, Imbimbo C, Longo N, Fusco F (2007) The Detrusor Muscle: An Innocent Victim of Bladder Outlet Obstruction. Eur Urol 51:57–66
5. Hou P, De, EJB, Kramer, LA, Westney, OL. Dynamic Contrast-Enhanced MRI Study of Male Pelvic Perfusion at 3T: Preliminary Clinical Report. JMRI 25:160 –169 (2007)
Figures