0818
Robustness of Texture Features on 3 Tesla Liver MRI.1Radiology, NYU Langone Health, New York, NY, United States
Synopsis
We studied the robustness of liver MRI texture features by scanning five healthy volunteers at 3T, first using standard institutional acquisition parameters, and then introducing slight variation in acquisition parameters. Our results demonstrate that a number of texture features were not robust to acquisition parameter changes.
ABSTRACT
INTRODUCTION:MRI texture features measure variation in signal intensity within a region of interest (ROI) and have been proposed as predictors of pathology or for prognostication, such as to classify liver lesions1 or predict biochemical recurrence after prostate cancer radiotherapy.2 Most published studies are retrospective and utilize imaging performed with different acquisition parameters, with little investigation regarding inter-scan reliability. Our aim was to prospectively assess the robustness of texture features to changes in acquisition parameters on scans obtained using a single magnet.
METHODS:
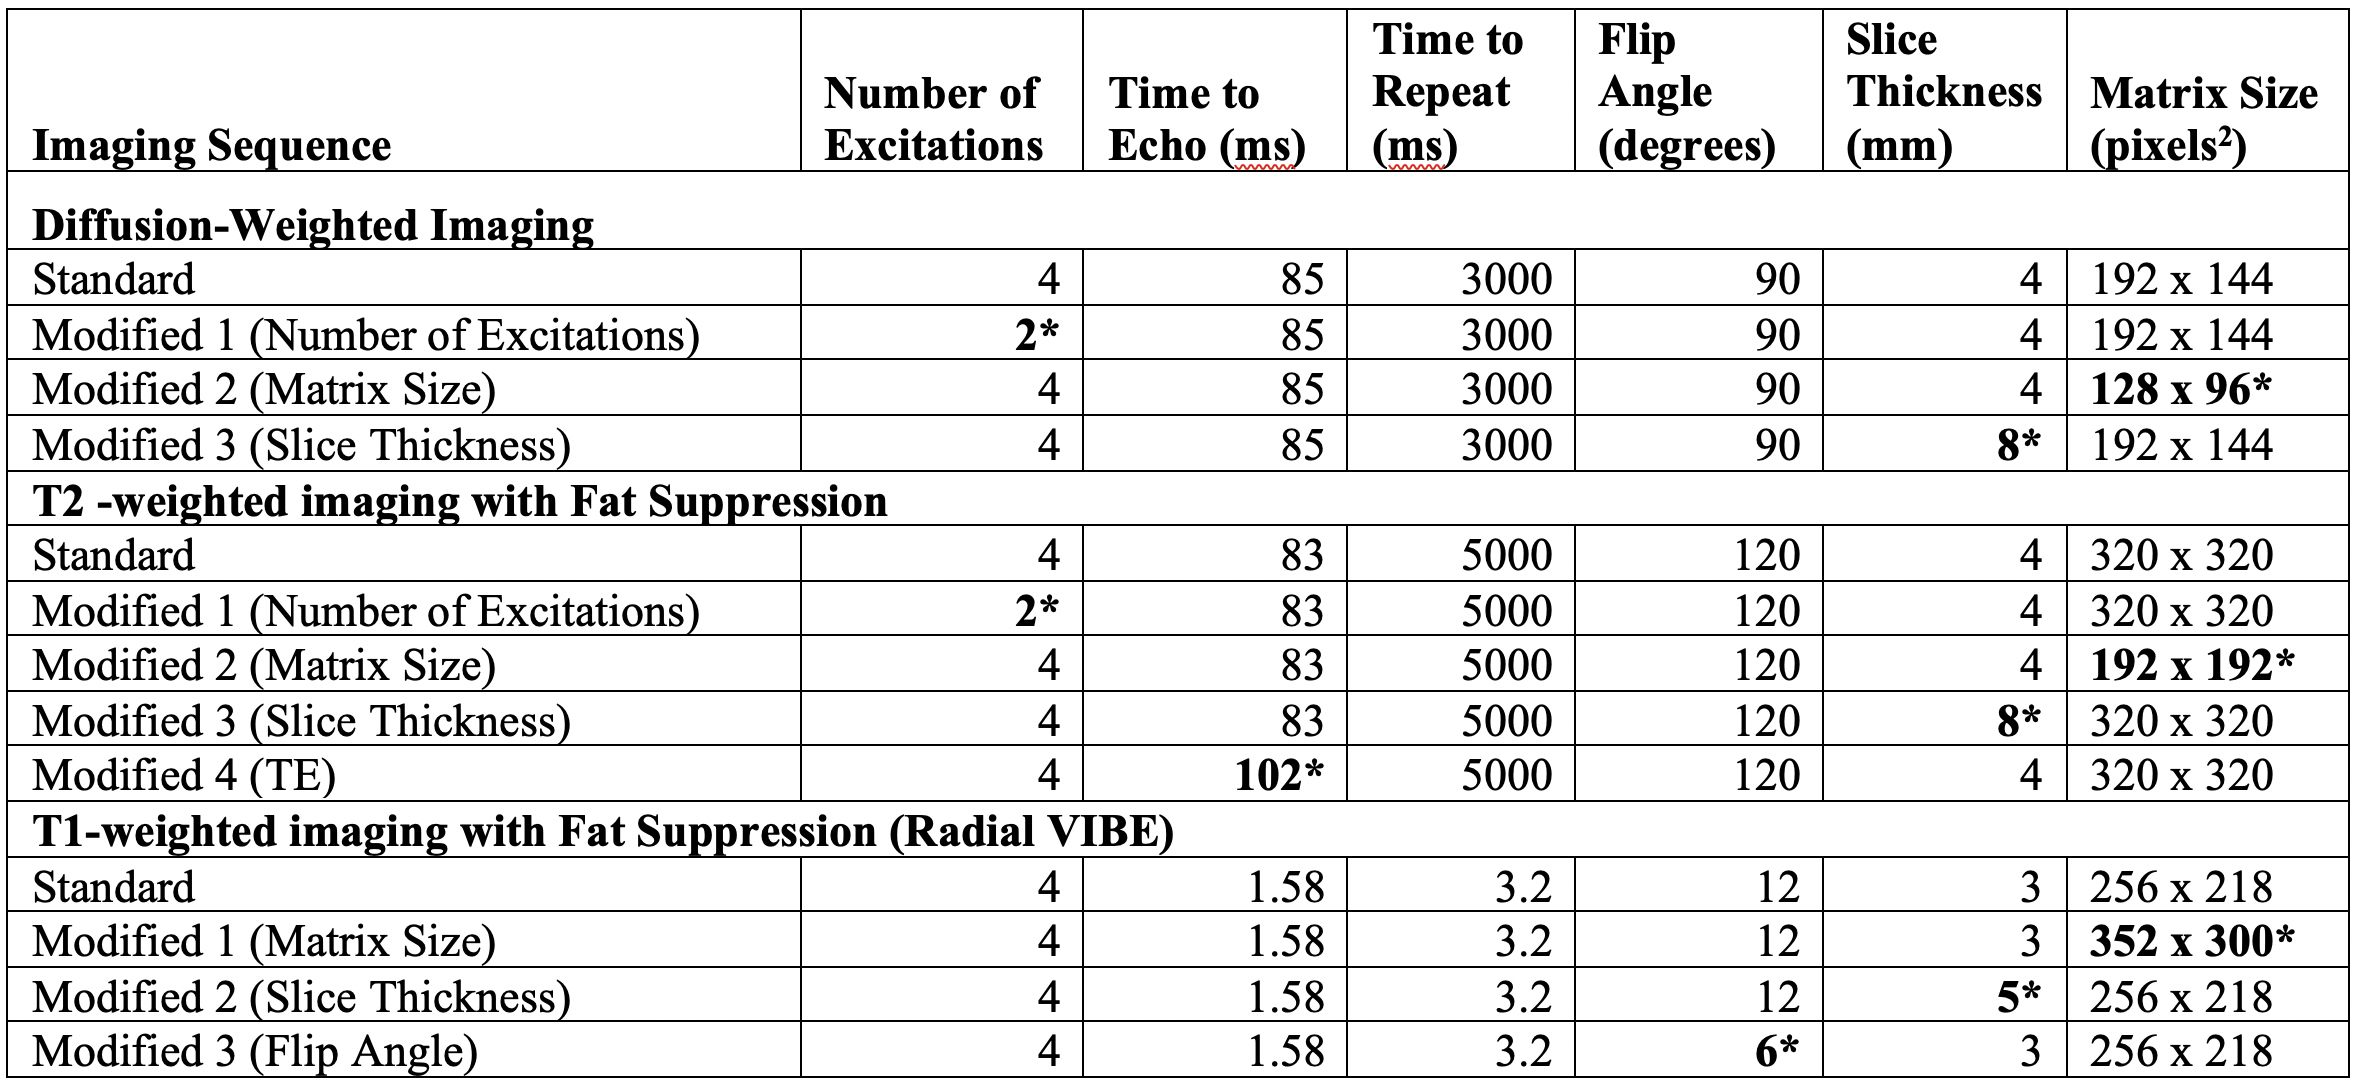
Five healthy volunteers (3M, 2F, mean 40y, range 24-66y) underwent 3T abdominal MRI on a single magnet (MAGNETOM Prisma, Siemens, Erlangen, Germany). Sequences were obtained using standard institutional parameters (Figure 1): diffusion-weighted images (DWI, b values = 0, 800) with apparent diffusion coefficient (ADC) maps, T2-weighted images with spectral fat suppression (T2wi), and T1-weighted images with spectral fat suppression (T1wi). Subsequently, patients were scanned using modified parameters, individually altering the matrix size, slice thickness, number of excitations (NEx) for DWI and T2wi, time to echo (TE) for T2wi, and flip angle for T1wi.
Two readers (abdominal imaging fellow, 4th year medical student) placed 5 cm3 spherical ROIs on the liver at four pre-specified locations using 3DSlicer (www.slicer.org), with intra-reader values averaged. The following texture orders were obtained: first order (FO, n = 18), gray level co-occurrence matrix (GLCM, n = 23), gray level dependence matrix (GLDM, n = 14), gray level run length matrix (GLRLM, n = 16), gray level size zone matrix (GLSZM, n = 16), and neighboring grey tone difference matrix (NGTDM, n = 5).
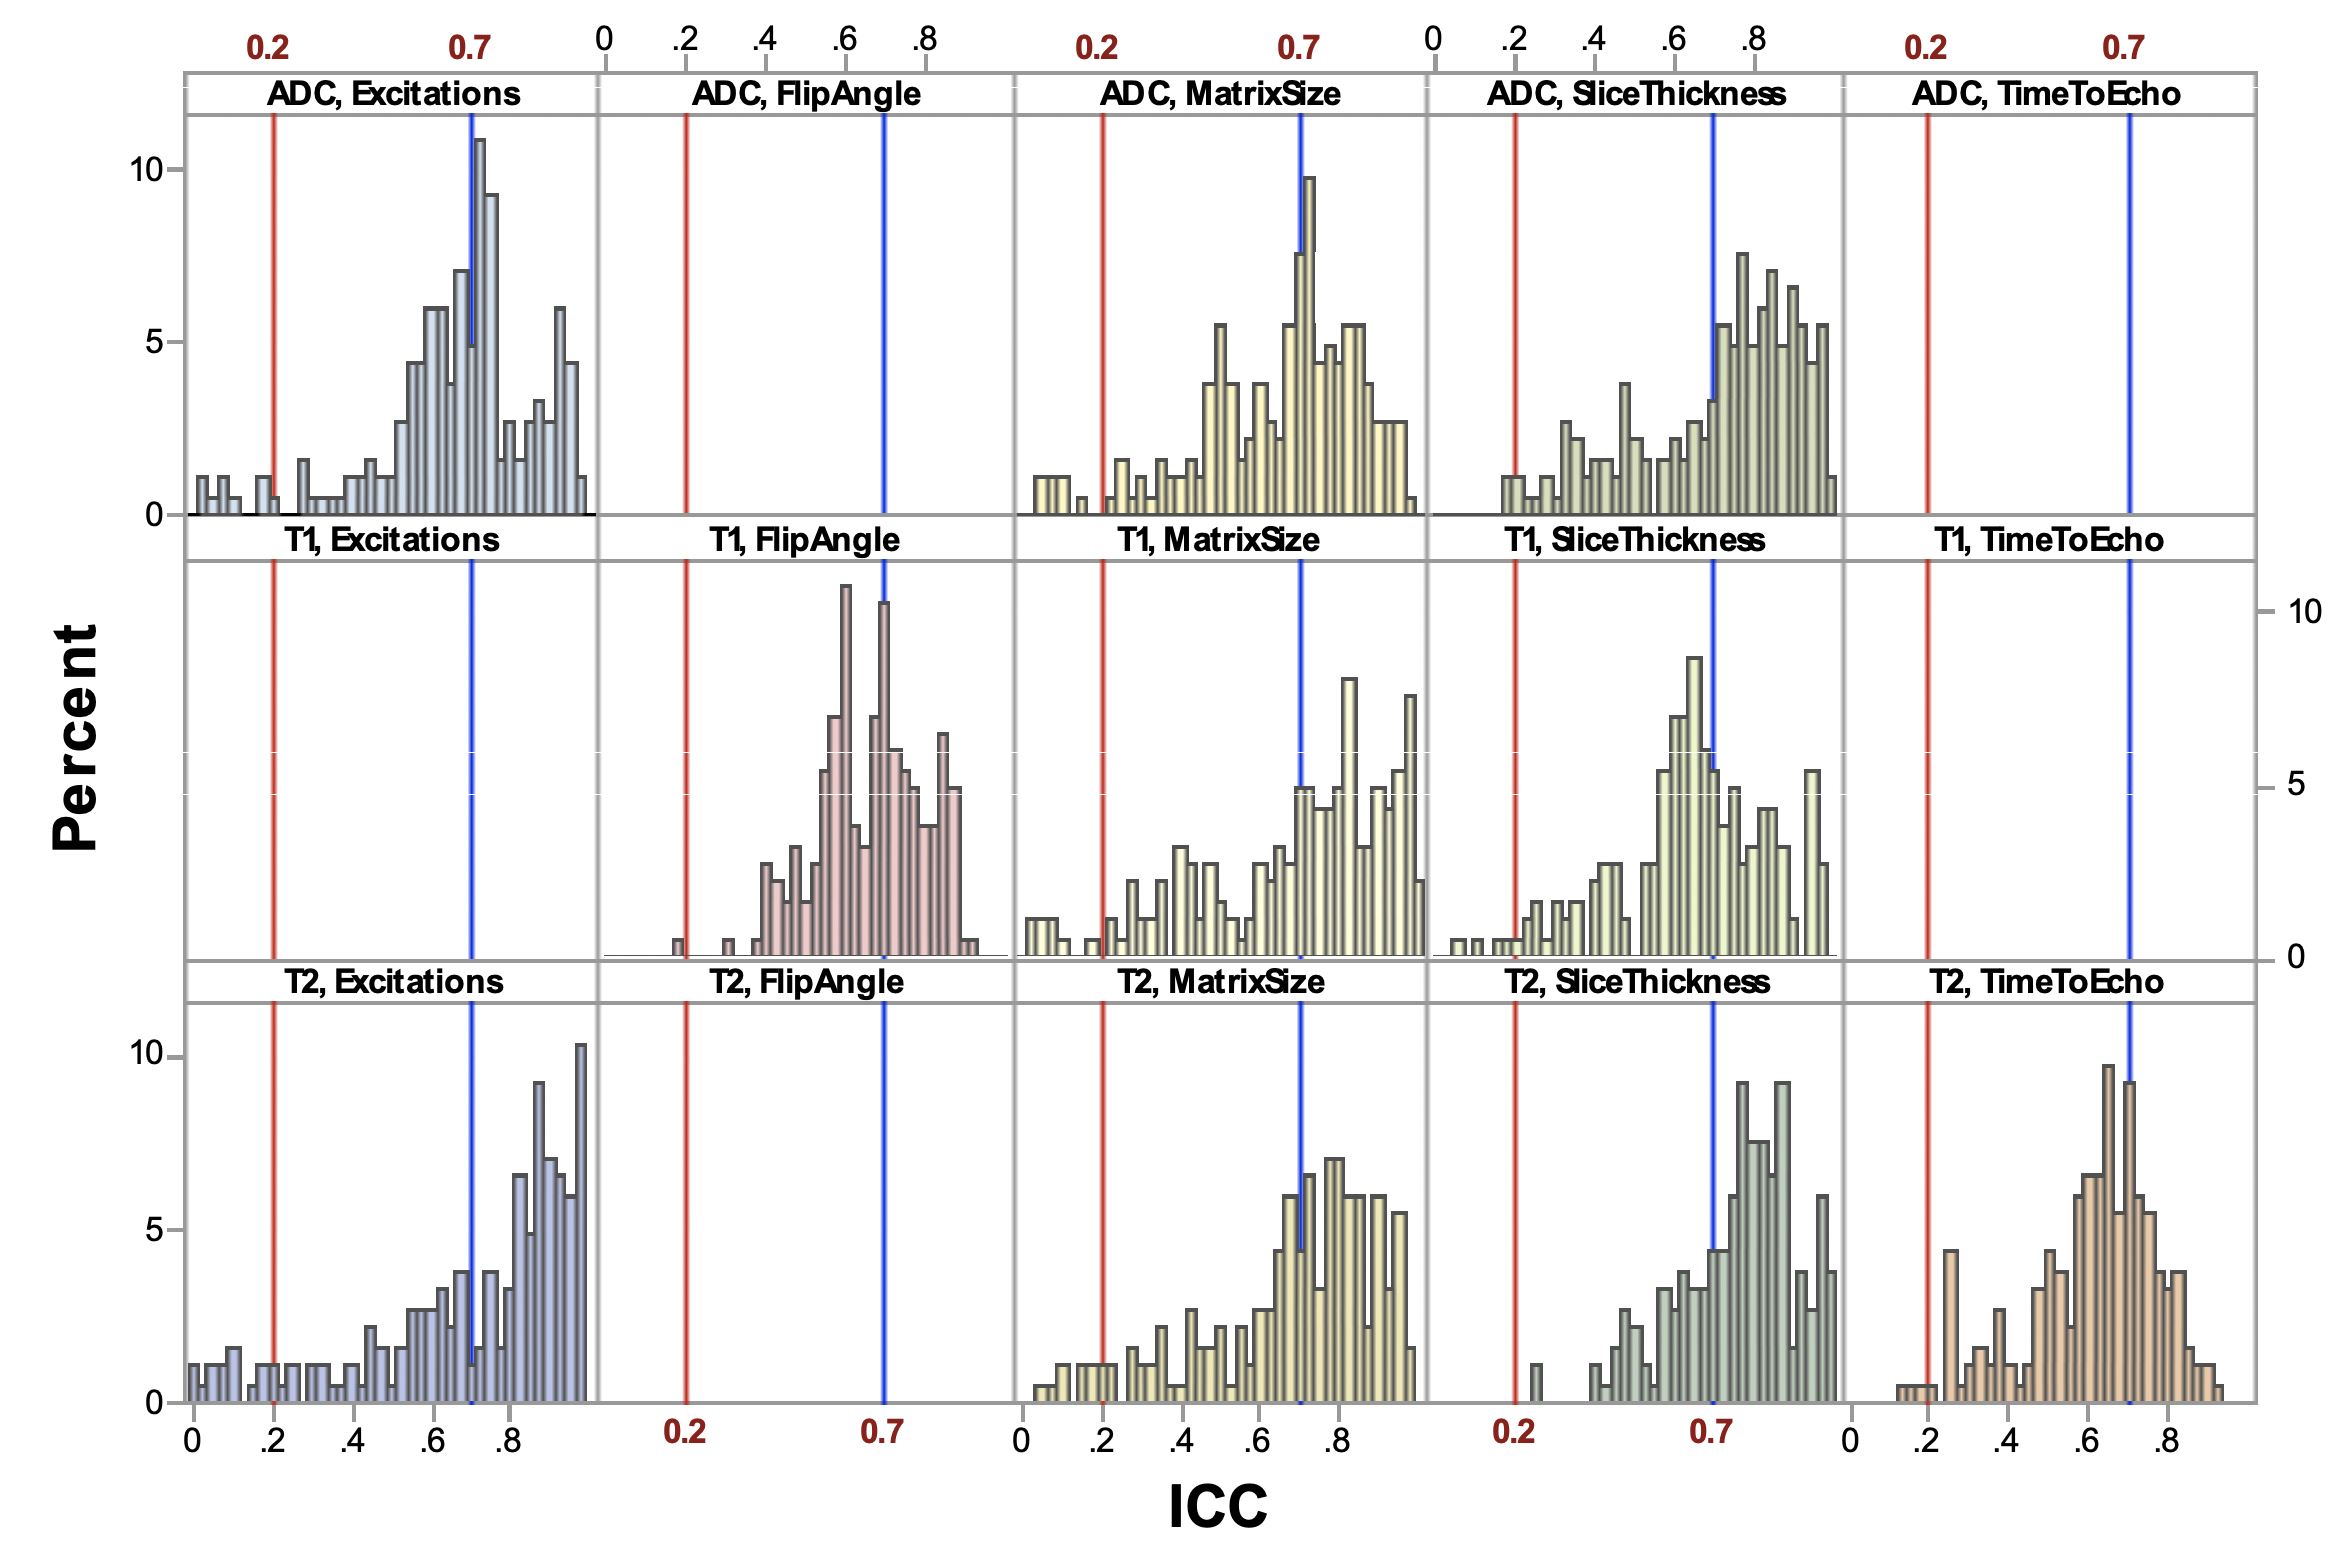
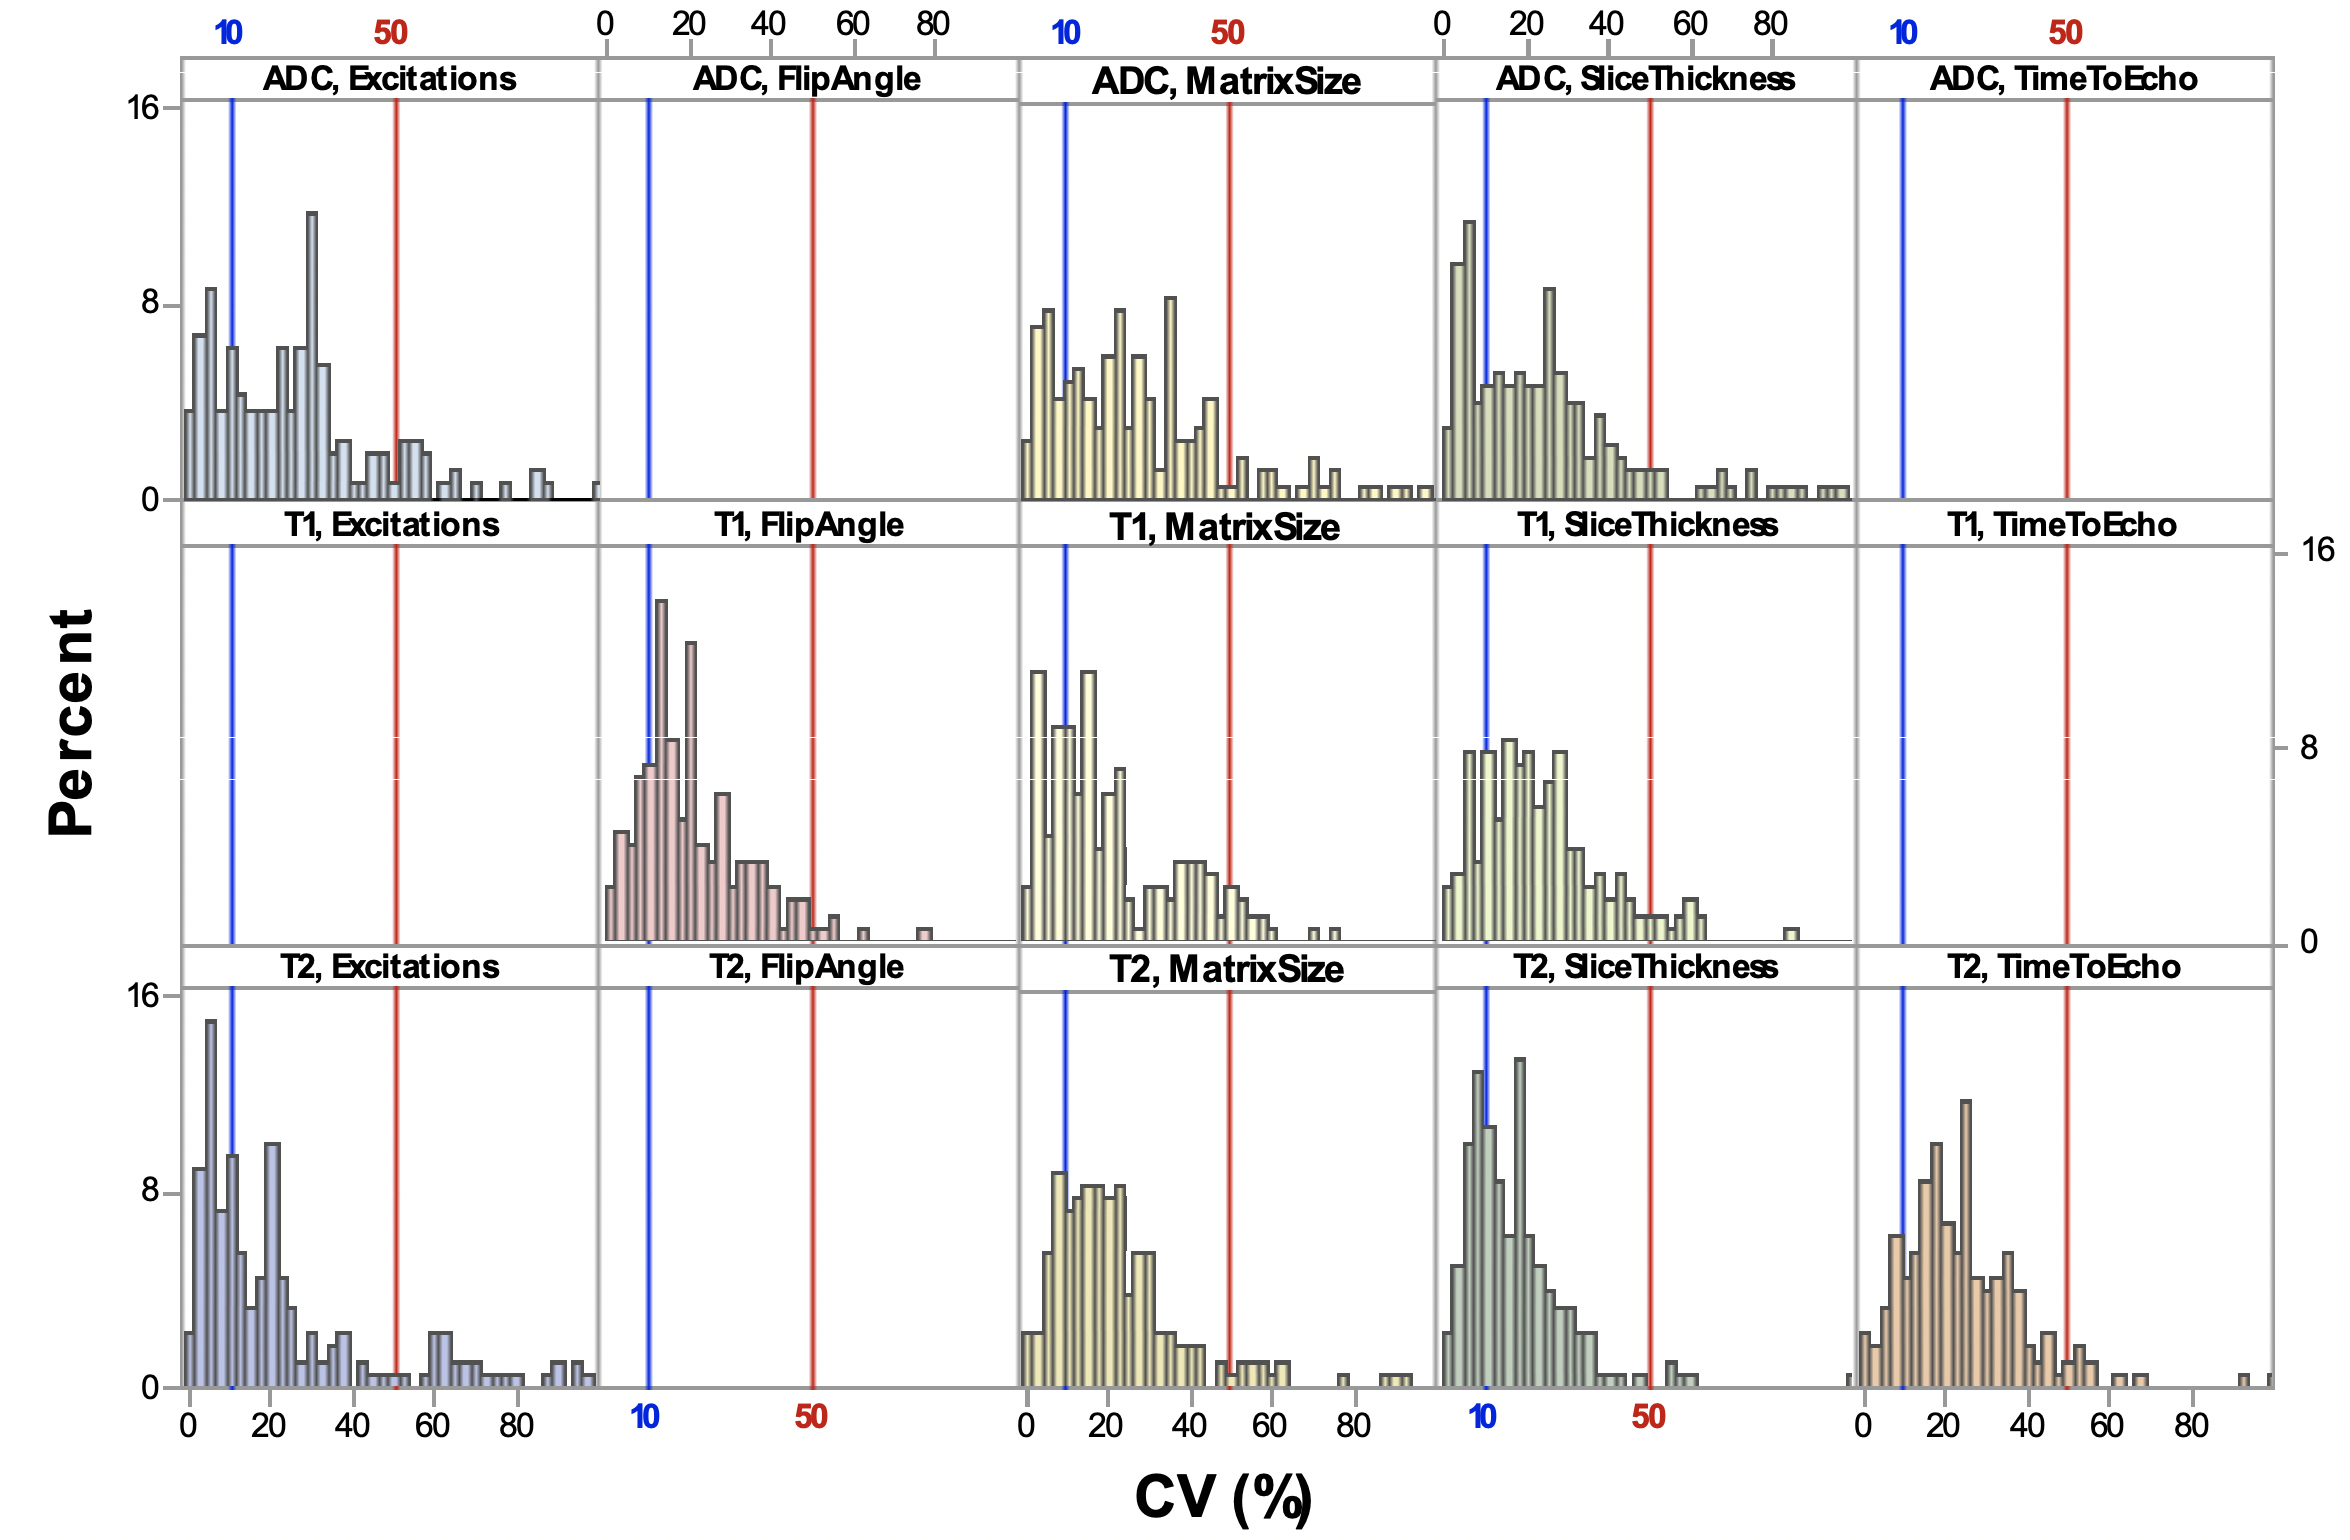
Robustness was defined as the variation between measurements obtained by a single reader on baseline scan versus scan acquired after acquisition parameter change. Variation was computed using intra-class correlation (ICC) and within-subject coefficient of variation (CV) and interpreted as poor when ICC<0.4 or CV>20%, moderate when 0.4≤ICC<0.75 or 20%≤CV<10%, good when 0.75≤ICC<0.9 or 10%≤CV<5% and excellent when ICC≥0.9 or CV≤5%.
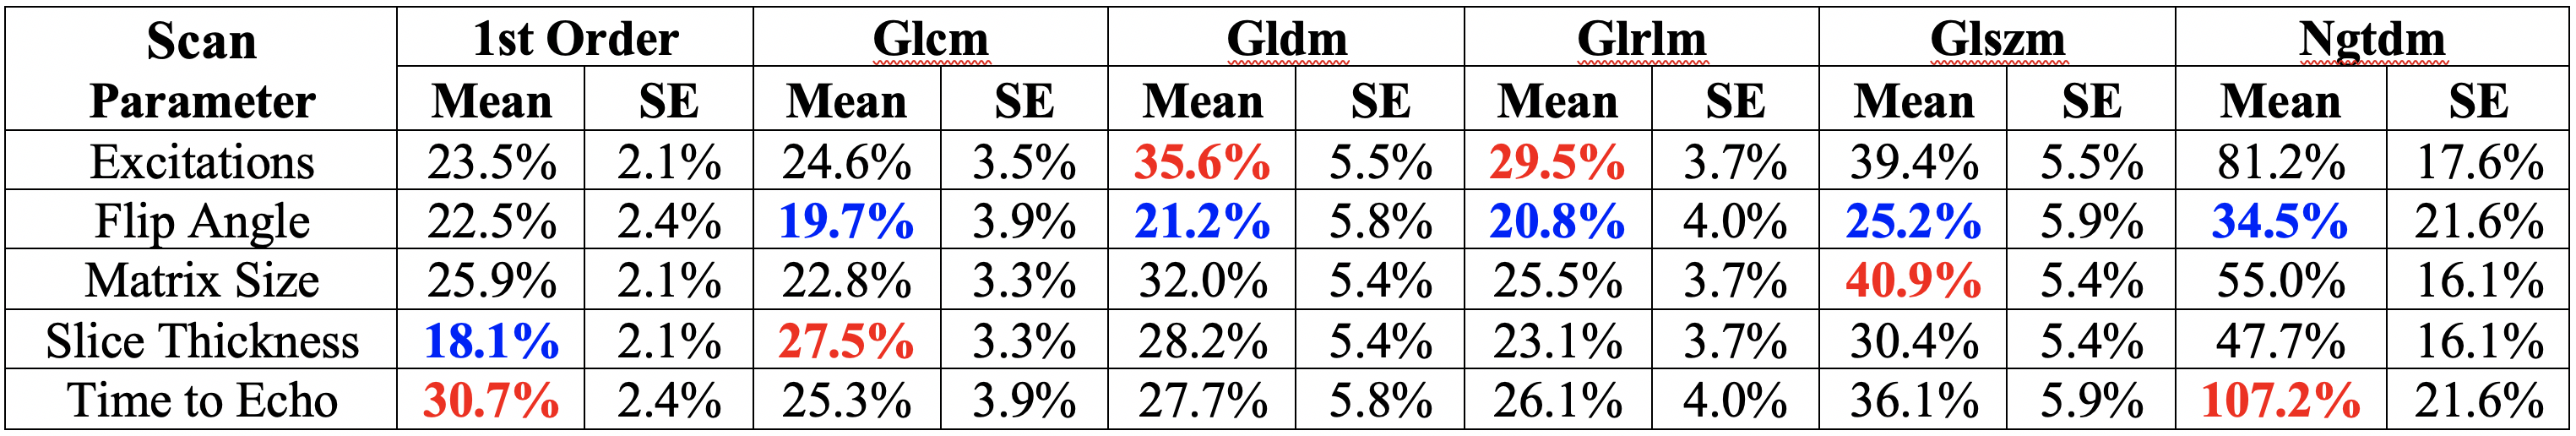
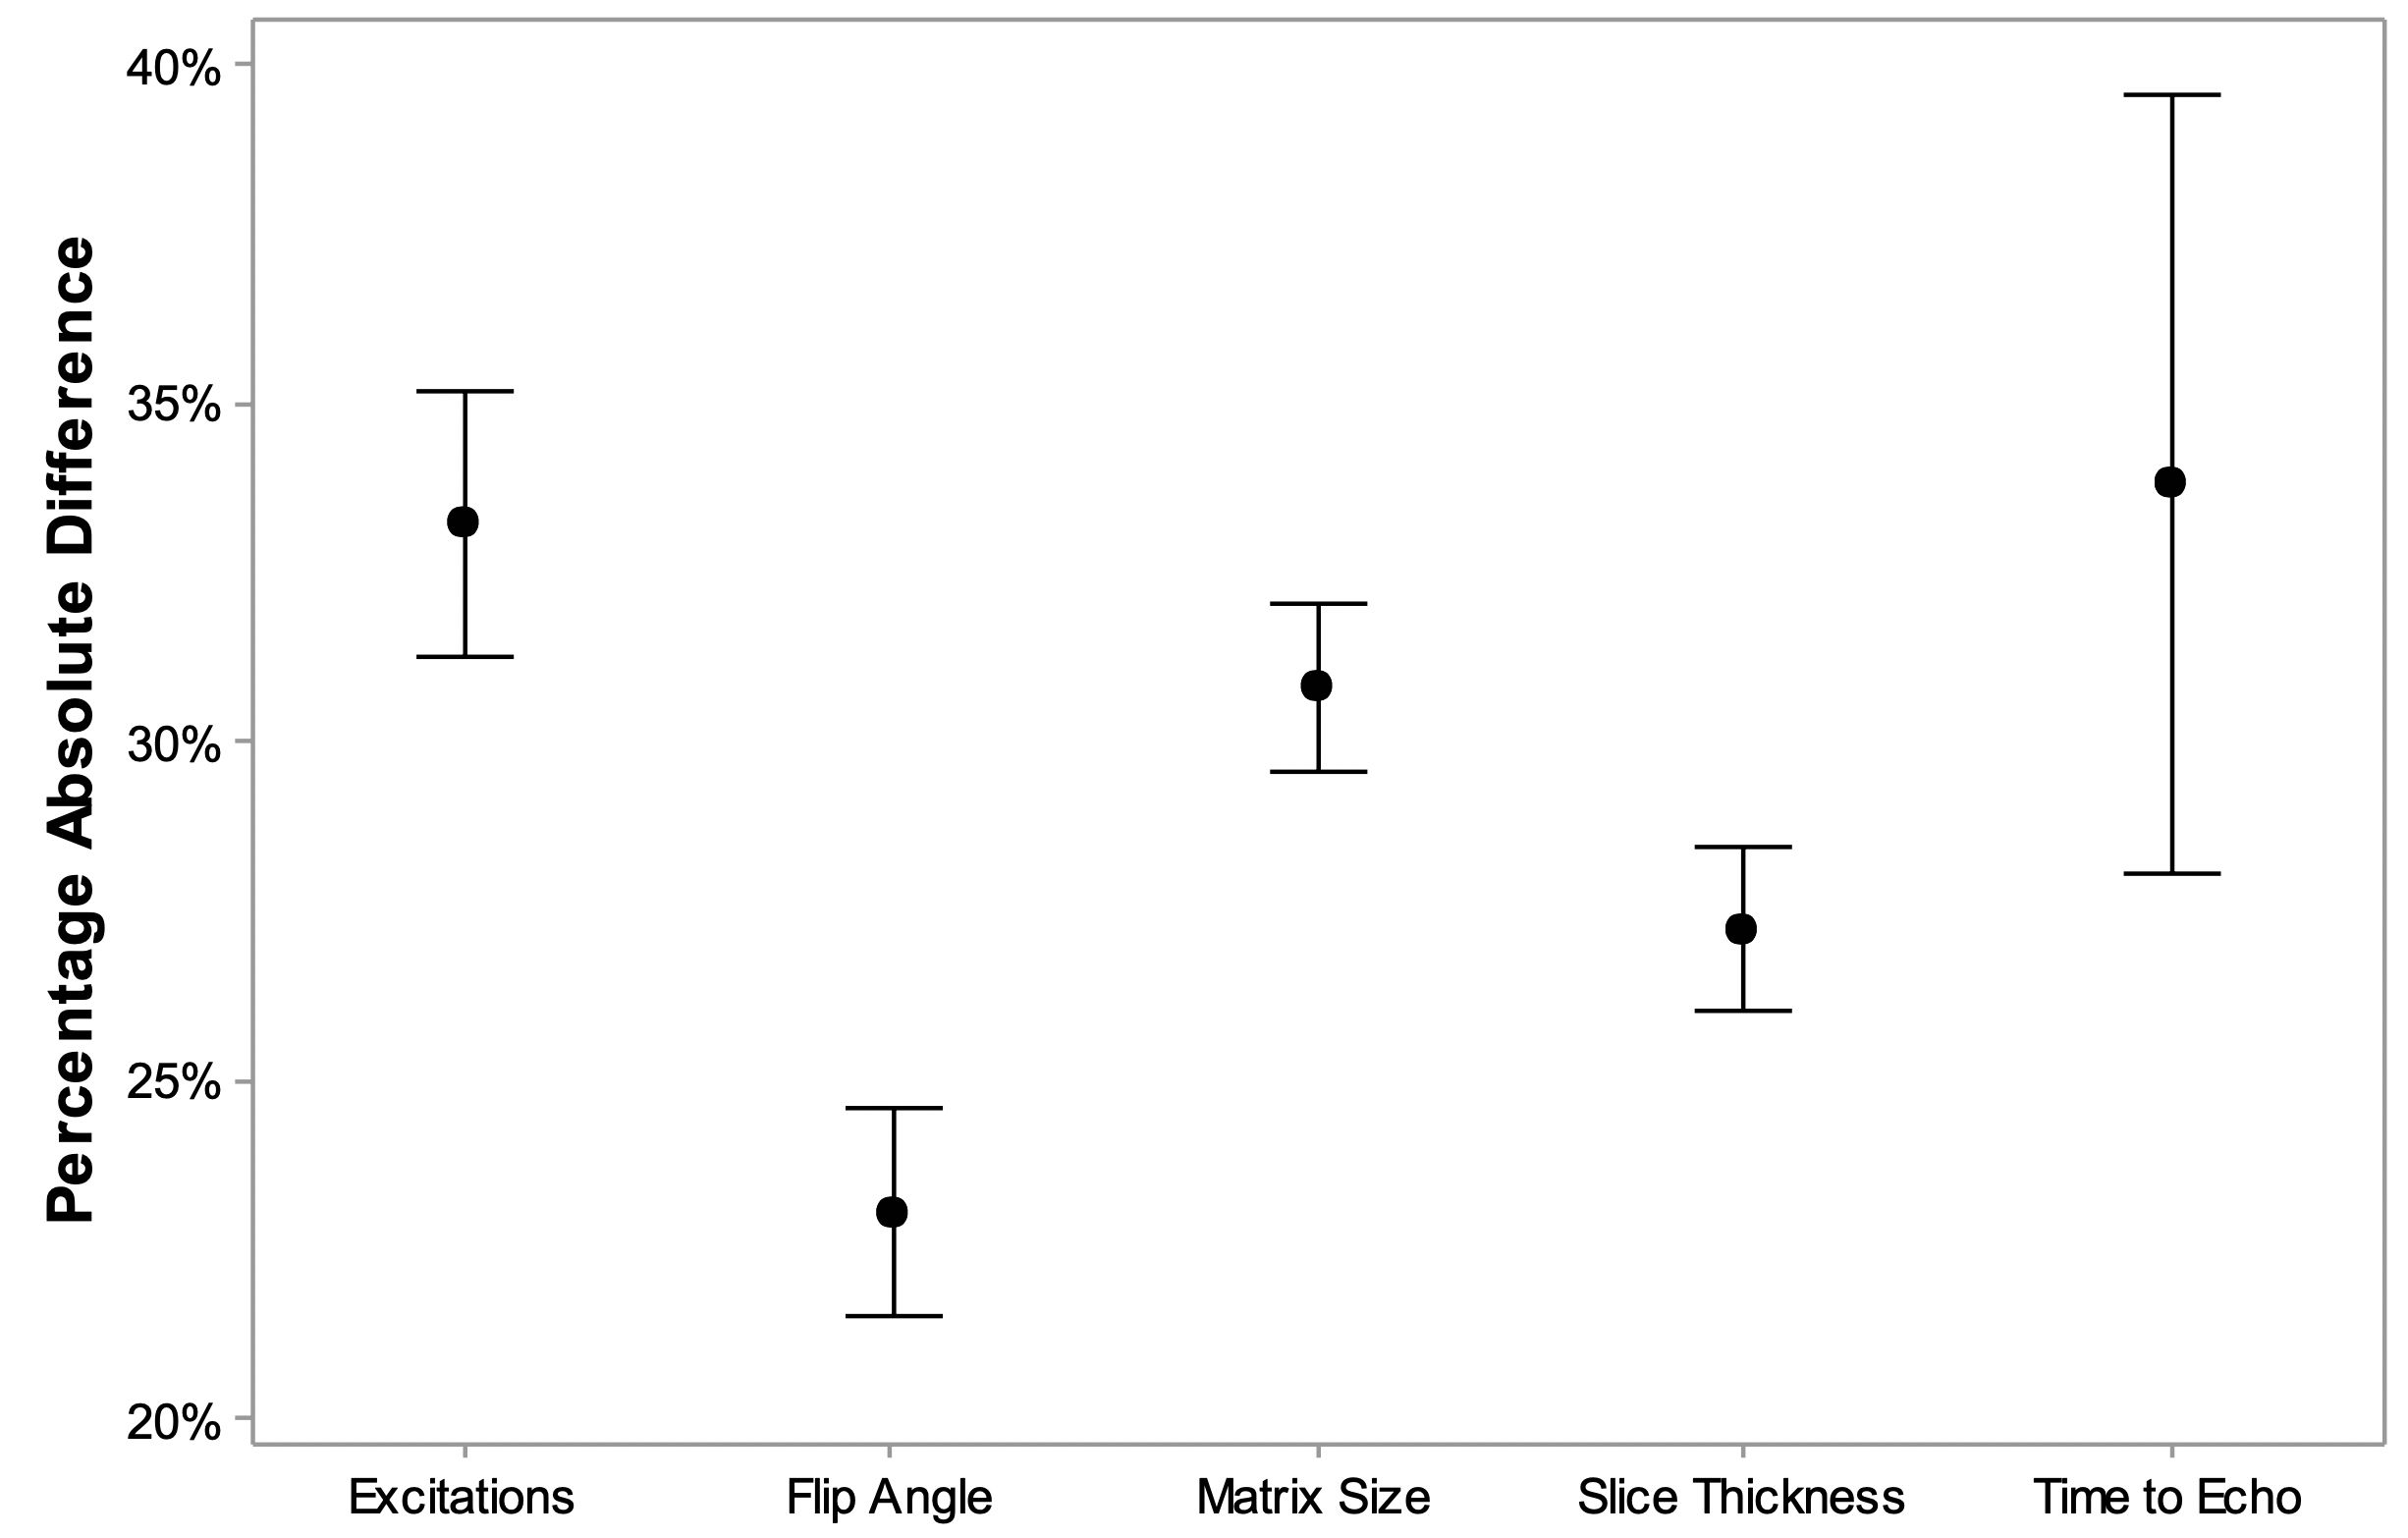
To compare scan parameters in terms of their impact on texture features, a mixed model analysis of variance was used to compare percentage absolute differences between values derived from scans with one parameter changed and those derived from scans with baseline parameters. The dependent variable was the vector containing the standardized absolute difference for all texture features from all subjects, for both readers and the baseline scans.
RESULTS:
The frequency of features reaching threshold CV or ICC levels for each parameter change are summarized in Figures 2-3. For ADC, only 40% (234/588) of measurements had good to excellent robustness to parameter changes by ICC and 24% (138/576) by CV, with GLRLM having the highest proportion by ICC (56%). For T1wi, only 36% (201/552) had good to excellent robustness by ICC and 23% (125/540) by CV, with FO features having the highest proportion (ICC 63%, CV 36%). For T2wi, only 46% (336/736) of measurements had good to excellent robustness by ICC, and 28% (336/720) by CV, with FO having the highest proportion by ICC (60%).
The results of our mixed model analysis are shown in Figure 4-5. For each texture feature order, the following parameters were the most robust when changed: slice thickness for FO and flip angle for GLCM, GLDM, GLRLM, GLSZM, and NGTDM. The following parameter changes were the least robust when changed: TE for FO and NGTDM, slice thickness for GLCM, NEx for GLDM and GLRLM, and matrix size for GLSZM. Across all image weightings and texture feature orders, changing the flip angle had the least effect on texture features, while changing TE had the greatest effect (Figure 5).
DISCUSSION:
This is the first study to prospectively and comprehensively analyze reliability of 3T MRI texture features. We found that many texture features were not robust to parameter changes.
When varying individual acquisition parameters, we found very low concordance rates between feature outputs. Robustness rates of good to excellent for ADC, T1, and T2 were seen in only 40%, 36%, and 46% of texture features using ICC, respectively and 24%, 23%, and 28% using CV, respectively. FO features had the highest level of robustness on both T1wi and T2wi, while GLRLM had the highest on ADC.
Our mixed model analysis compared parameter changes in order to identify which alterations generated more or less robust texture features. We demonstrated that altering flip angle provided the most robust texture feature outputs across all feature orders aside from FO, and also when grouping all texture features across all image weightings. On the contrary, the robustness of texture features to other parameter changes was more variable across different feature orders.
While some have proposed the use of “objective” texture features in machine learning algorithms,3, 4 we urge caution to ensure that these measures are robust, as many features are not. This is especially important given the fact that most papers retrospectively group data from MRIs obtained over long periods of time, during which variations in parameters are inevitable.
CONCLUSION:
We demonstrated large variations in texture feature outputs when slight changes to acquisition parameters were introduced. Further study should evaluate methods to correct for variations in MRI texture features based on protocol variations.
Acknowledgements
Gautham Sridharan, PhD assisted with data manipulation.References
1. Li Z, Mao Y, Huang W, Li H, Zhu J, Li W, Li B: Texture-based classification of different single liver lesion based on SPAIR T2W MRI images. BMC Med Imaging 2017, 17(1):42.
2. Gnep K, Fargeas A, Gutierrez-Carvajal RE, Commandeur F, Mathieu R, Ospina JD, Rolland Y, Rohou T, Vincendeau S, Hatt M et al: Haralick textural features on T2 -weighted MRI are associated with biochemical recurrence following radiotherapy for peripheral zone prostate cancer. J Magn Reson Imaging 2017, 45(1):103-117.
3. Juntu J, Sijbers J, De Backer S, Rajan J, Van Dyck D: Machine learning study of several classifiers trained with texture analysis features to differentiate benign from malignant soft-tissue tumors in T1-MRI images. J Magn Reson Imaging 2010, 31(3):680-689.
4. Romeo V, Ricciardi C, Cuocolo R, Stanzione A, Verde F, Sarno L, Improta G, Mainenti PP, D'Armiento M, Brunetti A et al: Machine learning analysis of MRI-derived texture features to predict placenta accreta spectrum in patients with placenta previa. Magn Reson Imaging 2019.
Figures