0814
Automating Image-Based Body Composition Analysis with Missing Data1Radiology Informatics Lab, Mayo Clinic, Rochester, MN, United States, 2Physiology & Biomedical Engineering, Mayo Clinic College of Medicine & Science, Rochester, MN, Rochester, MN, United States
Synopsis
We have developed and evaluated an automated algorithm that learns to synthesize representative segmentations of the missing anatomy in partial abdominal MR images using a deep learning-based approach. These synthesized segmentations are optimal for studies focusing on the analyzes of body composition.
Introduction
Recent studies report an association between disease progression and body mass index (BMI) in patients affected by autosomal dominant polycystic kidney disease (ADPKD)1. We hypothesized that body composition parameters (i.e., assessment of the relative size of anatomical compartments such as subcutaneous adipose tissue (SAT), muscle, visceral adipose tissue (VAT), bone, and visceral organ tissue (VOT)) derived from abdominal MR scans could be a better predictor of disease progression, since they allow a more accurate measure of body habitus than BMI. A key component of this analysis involves obtaining retrospective data that has complete abdominal coverage. However, many retrospective imaging datasets used to diagnose diseases typically do not have full coverage of the abdomen because of time and cost. Therefore, we developed a machine learning approach to synthesize the missing data with properties similar to the actual data. By training a convolutional neural network using artificially clipped abdominal segmentations and their equivalent complete segmentations, a model to predict the complete body composition data was created. The synthesized complete segmentations had improved similarity to the full segmentations compared to the clipped, thus showing that it is possible to approximate full body composition segmentation from partial segmentation using a deep learning-based approach.Methods
A convolutional neural network based on the U-Net architecture2 was trained to synthesize data from 32,133 manually clipped abdominal segmentations (~85% of total database), ranging from a 40% to a 90% clipped field of view, and their equivalent complete segmentations. The model was further validated on 4,098 segmentations (~10% of total database) and tested on 1,760 segmentations (~5% of total database). This 12-layer architecture convolves and down-samples images to a 32x32 representation, and then up-samples to generate smooth segmentation and prediction. Segmentations instead of scans were used for training the model as to be applicable to both MRI and CT modalities. The accuracy of the clipped and predicted segmentations were calculated relative to the original full segmentation.Results
The results are displayed by four graphs (Figure 1) that show the percentage of a specific tissue contained in the image compared to its true tissue amount for both clipped and predicted segmentations. This was done for differing amounts of clipping and displays the percentages of both the originals and the predicted tissue values. This model improved VOT and VAT measurements for segmentations that had field of views clipped between 40% and 60% whereas SAT and muscle measurements were improved at any level of clipping. For example, images clipped at around 50%, compared with the reference segmentations, saw an average percentage of calculated area to correct area improve from 31% to 85% for SAT, 61% to 93% for muscle, 84% to 91% for VAT, and 92% to 98% for VOT. Comparatively images clipped at around 80%, compared with the reference segmentations, would see an average percentage of calculated area to correct area improve from 82% to 93% for SAT, 91% to 97% for muscle, 97% to 98% for VAT, and 99% to 99% for VOT.Discussion
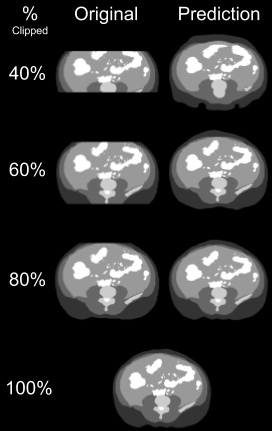
When clipping occurs in an MRI scan the SAT and muscle tissue areas are often the most affected because of their proximity to the top and bottom of the images. As such, this model excels at improving total percent accuracy of SAT and muscle compared to VOT and VAT which tend to have larger portions of their respective total areas already contained in the clipped images. Data created from this form of image generation does not truly represent the missing data and as such the segmentation produced from this method is to be used in analysis of body composition parameters and not in image reconstruction. Obtaining the values and ratios between differing body compartments through this method benefits the user by allowing them to visually verify that the data being predicted is accurate (Figure 2).Conclusion
This model was created to make retrospective data sets that contain partial abdominal scans available for use in research applications dealing with body composition. One such application is looking at disease progression and body composition in patients affected by ADPKD. This model was able to predict representative full segmentations from clipped images. An abdominal image, being clipped at around 60%, correlates to about a 93% accuracy of the predicted full segmentation and can now be used in image analysis for retrospective studies where incomplete imaging data needs to be synthesized (Figure 3).Acknowledgements
This research was supported in part by the Mayo Clinic Robert M. and Billie Kelley Pirnie Translational PKD Center and the NIDDK grants P30DK090728 and K01DK110136, as well as funding from the National Institutes of Health R25-DK101405 (nuSURF).References
- Nowak KL, You Z, Gitomer B, et al. Overweight and Obesity Are Predictors of Progression in Early Autosomal Dominant Polycystic Kidney Disease. J Am Soc Nephrol. 2018;29(2):571–578. doi:10.1681/ASN.2017070819
- Ronneberger O., Fischer P., Brox T. (2015) U-Net: Convolutional Networks for Biomedical Image Segmentation. In: Navab N., Hornegger J., Wells W., Frangi A. (eds) Medical Image Computing and Computer-Assisted Intervention – MICCAI 2015.
Figures

Figure 1: Plots show the percentage of tissue
quantity contained in the image compared to true tissue amount for both clipped
and predicted segmentations. (Top Left) Shows tissue quantities of original clipped and predicted segmentations for
SAT. (Top Right) Shows tissue quantities of original clipped and
predicted segmentations for muscle. (Bottom Left) Shows tissue quantities of
original clipped and predicted segmentations for VAT. (Bottom Right) Shows
tissue quantities of original clipped and predicted segmentations for
VOT.