0811
Automated Renal Segmentation in Healthy and Chronic Kidney Disease Subjects Using A Convolutional Neural Network1Sir Peter Mansfield Imaging Centre, University of Nottingham, Nottingham, United Kingdom
Synopsis
Manual segmentation of the kidneys in renal MRI is a time consuming process in many processing pipelines. Existing automated methods using classical imaging processing are specific to a single pathology. Here we implement a convolutional neural network for rapid and automatic segmentation of the kidneys from both a healthy control and Chronic Kidney Disease cohort. When validated on unseen data, the network achieved a mean Dice score of 0.93±0.02 with mean error in total kidney volume of 2.0±16.5 ml which, in the majority of subjects, was better than human precision from manual segmentation.
Introduction
Total Kidney Volume (TKV) is used as a biomarker for a variety of renal pathologies; autosomal dominant polycystic kidney disease is characterised by an increase in TKV1, while a decrease in TKV is associated with a decrease in renal function2. As such, segmentation of the kidneys in MR images is a vital yet time consuming aspect of many studies. In addition to TKV measurements, renal segmentation is an important first step for many other processing pipelines, be that to increase accuracy of algorithms such as automated cortical-medullary segmentation3 or to reduce computation time by only carrying out calculations on relevant voxels.The gold standard of segmentation is manual region of interest (ROI) tracing by an experienced and skilled professional, this process is highly time consuming and difficult due to the similar signal intensities between the kidneys and surrounding organs, anatomical differences between subjects and imaging artefacts. A fully automated segmentation method is highly desirable however the same factors that make manual segmentation difficult also limit fully automated methods. Automated methods have been proposed with varied success4 however the techniques used are highly optimised for a specific disease, as such they need to be re-written to be applied to a different pathology, another time consuming and highly skilled process.
Machine learning allows a single method to be written and then trained on datasets, as more data becomes available, the algorithm can become more accurate and generalised without the need to rewrite the underlying methods. This principle has been applied to segmentation in other areas of medical imaging, especially successful have been convolutional neural networks (CNN)5, however these have not been applied to renal MRI.
Here a CNN is used to accurately segment the kidneys of both healthy control (HC) participants and Chronic Kidney Disease (CKD) patients.
Methods
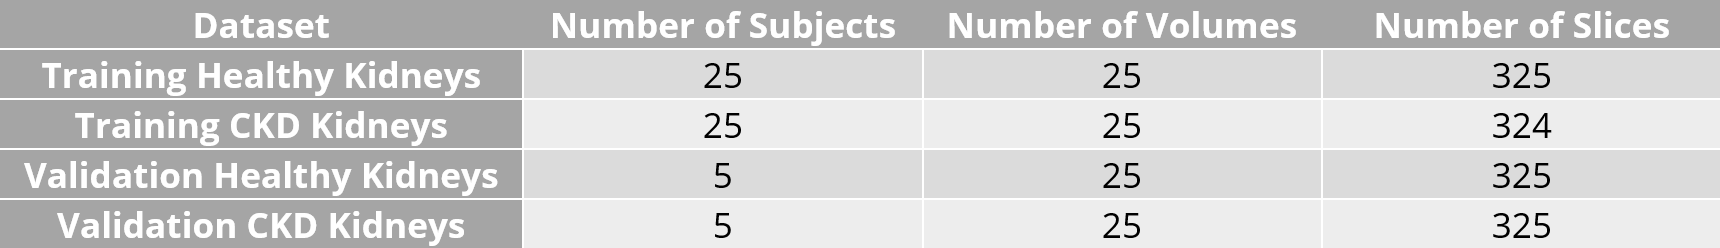
Data AcquisitionT2-weighted images (half-Fourier single-shot turbo spin echo (HASTE) sequence: repetition time = 1800 ms, echo time = 60 ms, bandwidth = 792.3 Hz/pixel, field of view = 350x350 mm2, 11 to 14 coronal slices and voxel size of 1.5x1.5x5mm3) were acquired on a 3T Philips Ingenia system in a single breath hold. This volume coverage was sufficient to ensure the slices included all renal tissue. The acquisition parameters were optimised to deliver the maximum contrast between the kidneys and surrounding tissue6. A total of sixty subjects were scanned with the ten validation subjects being scanned five times on the same day to allow the repeatability of TKV to be assessed. A summary of the data collected is shown in Figure 1. A ground truth manual segmentation was made for each volume.
Data Processing
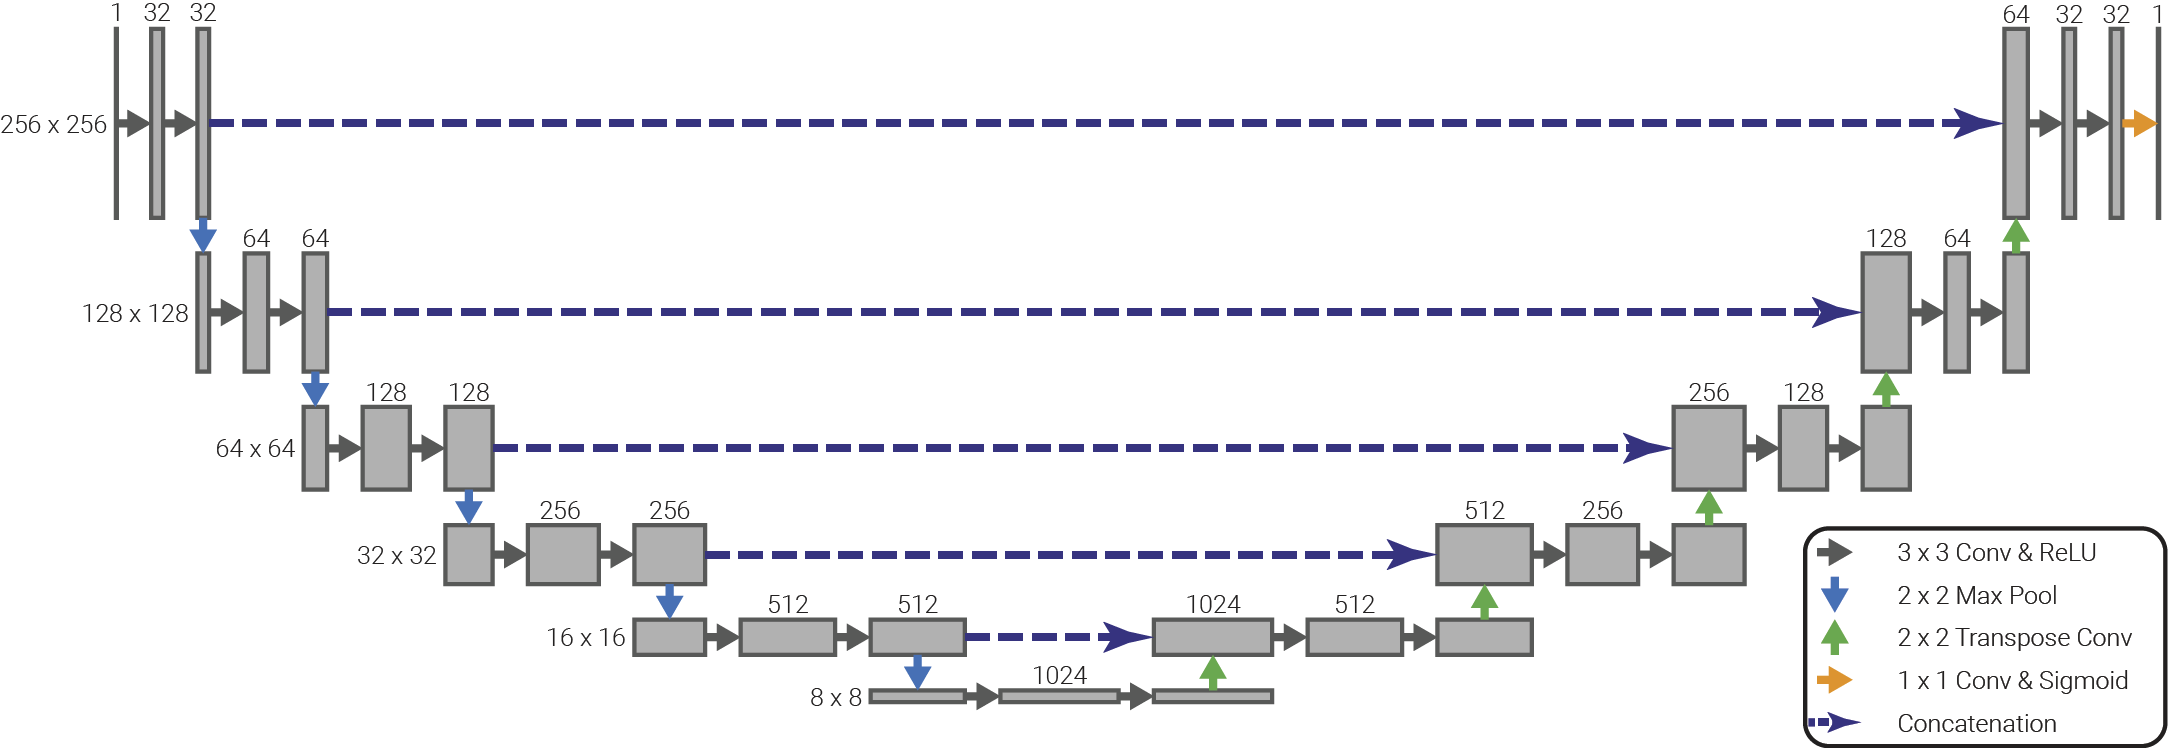
Each volume was split into its two-dimensional coronal slices and the voxel intensities normalised. These slices were augmented by applying random shifts, zooms, rotations and sheers to the image data and corresponding ground truth ROI; all augmentations produce anatomically reasonable images. Twenty percent of slices were reserved for testing during the network optimisation process. A summary of the network architecture can be seen in Figure 2. This network was trained over 150 epochs using stochastic gradient decent with a learning rate of 0.01 and using the Dice score as its loss function.
Results
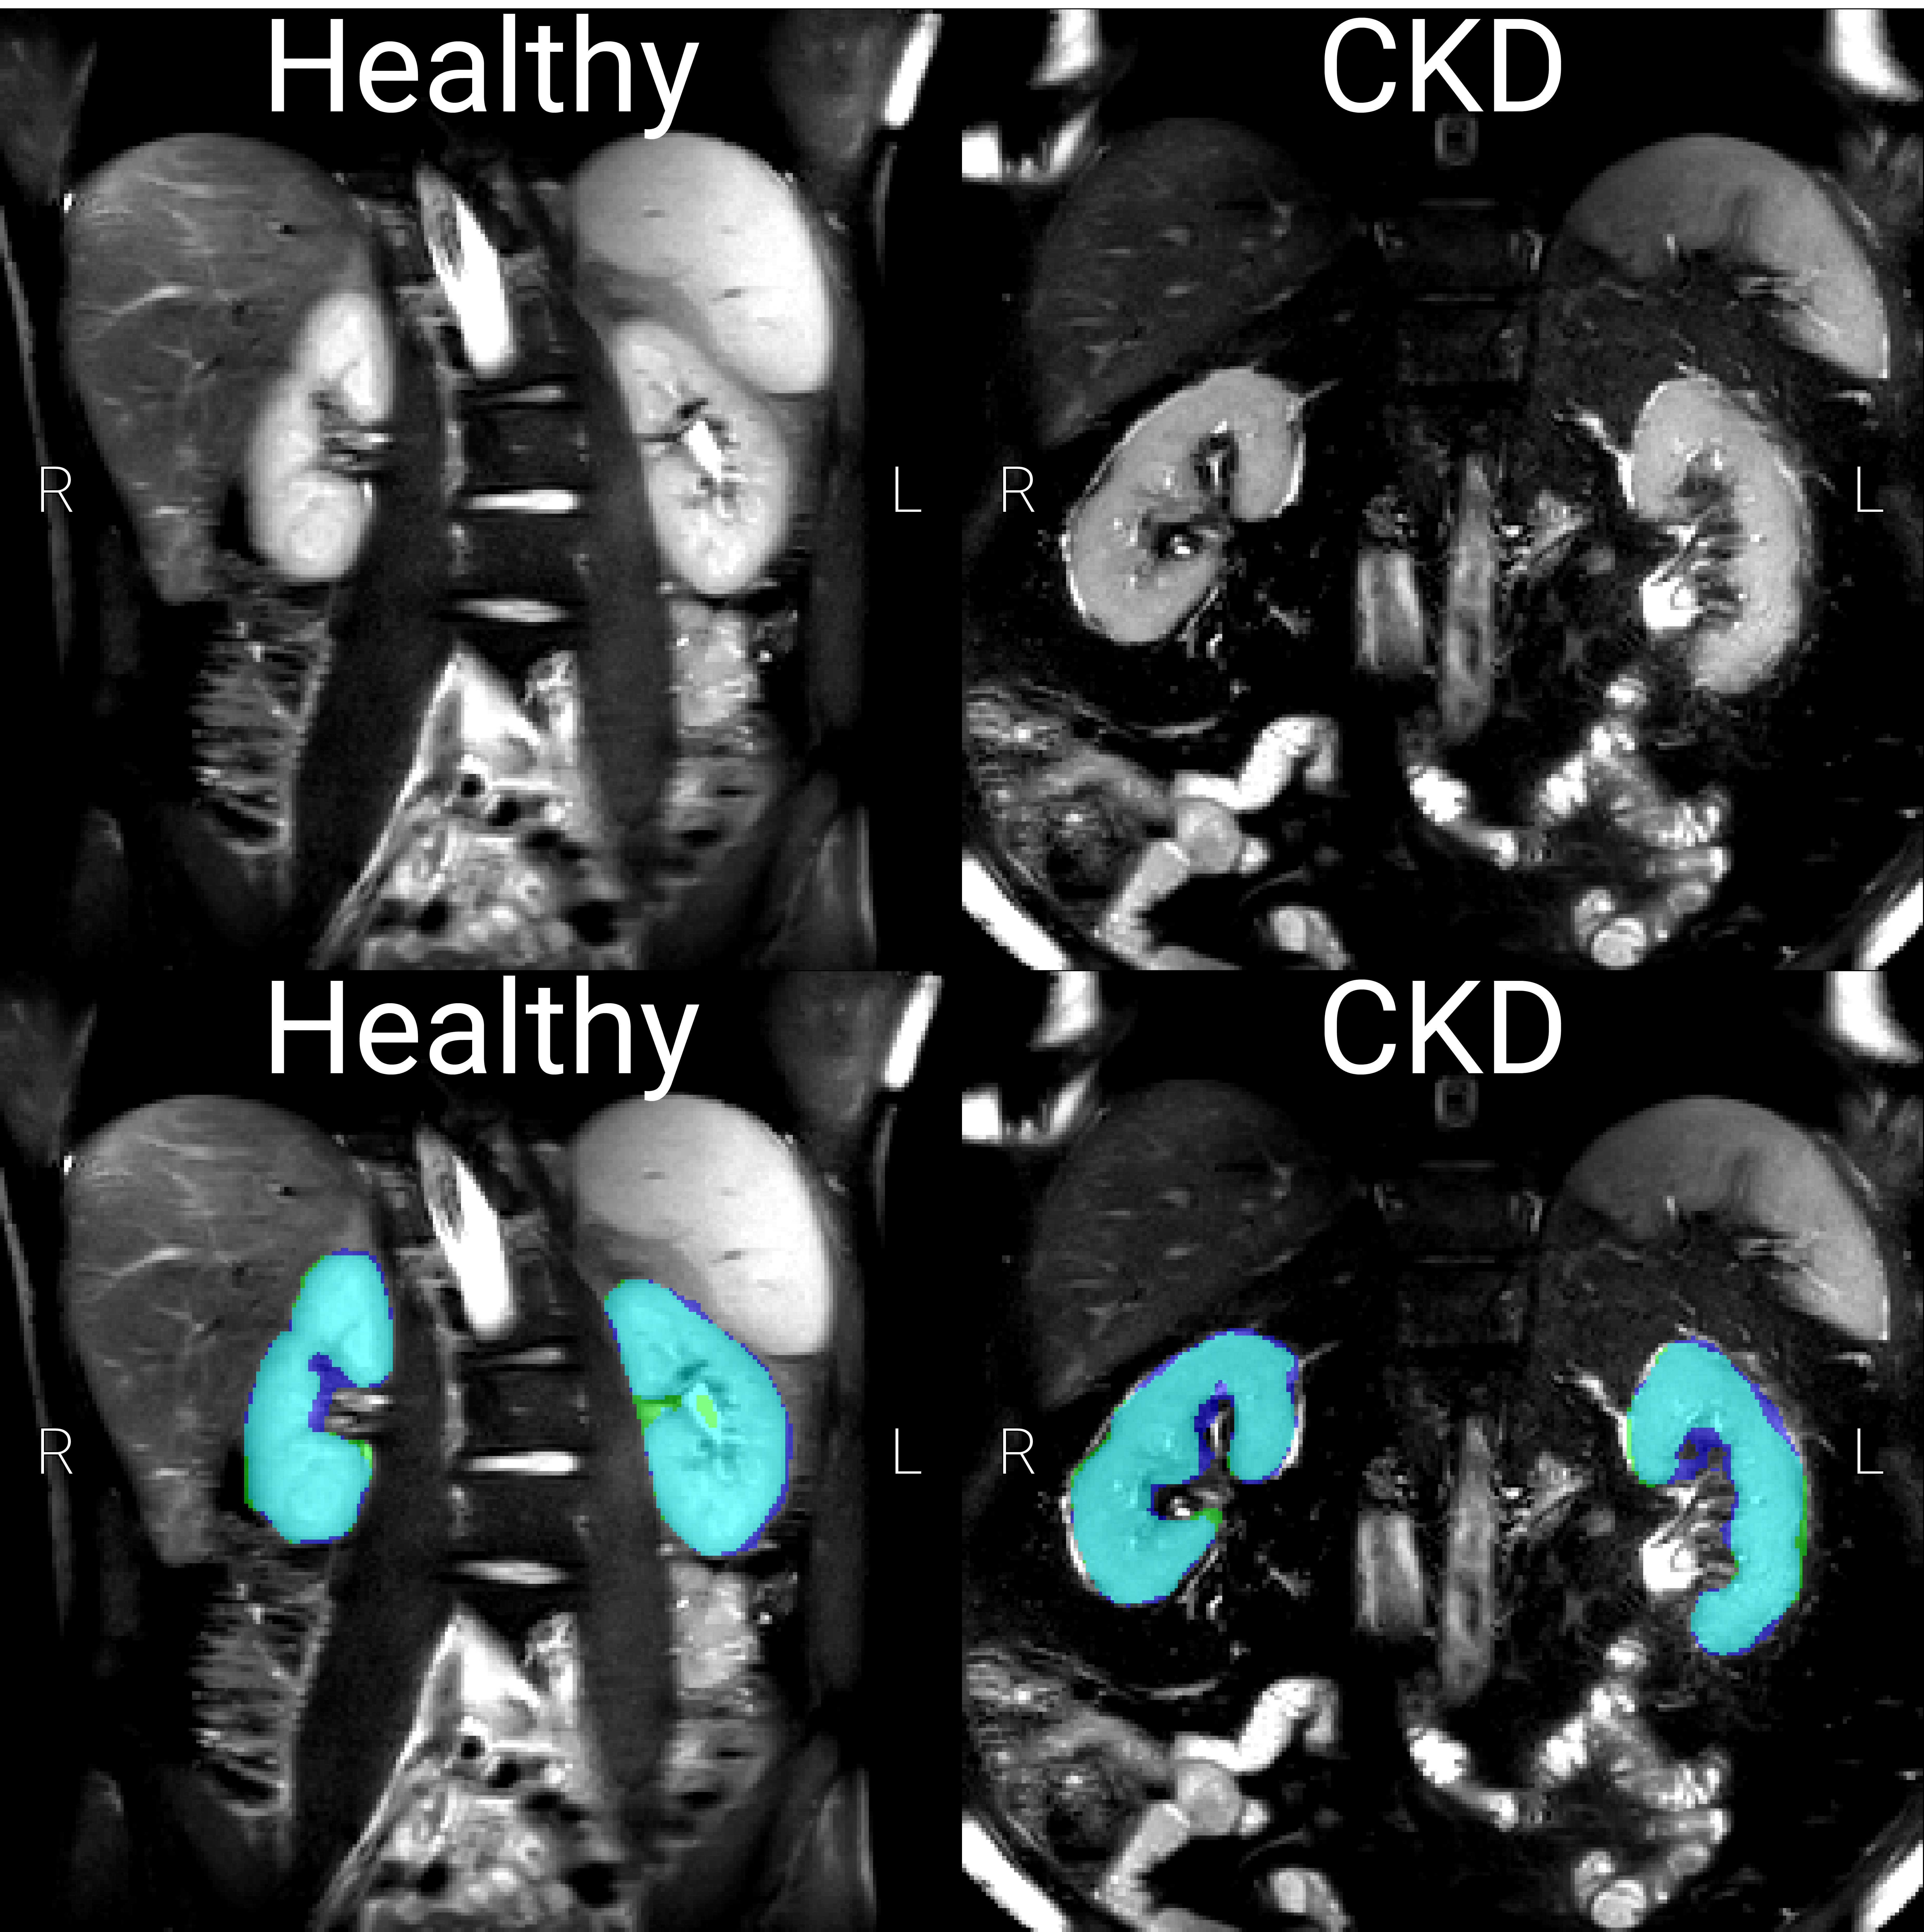
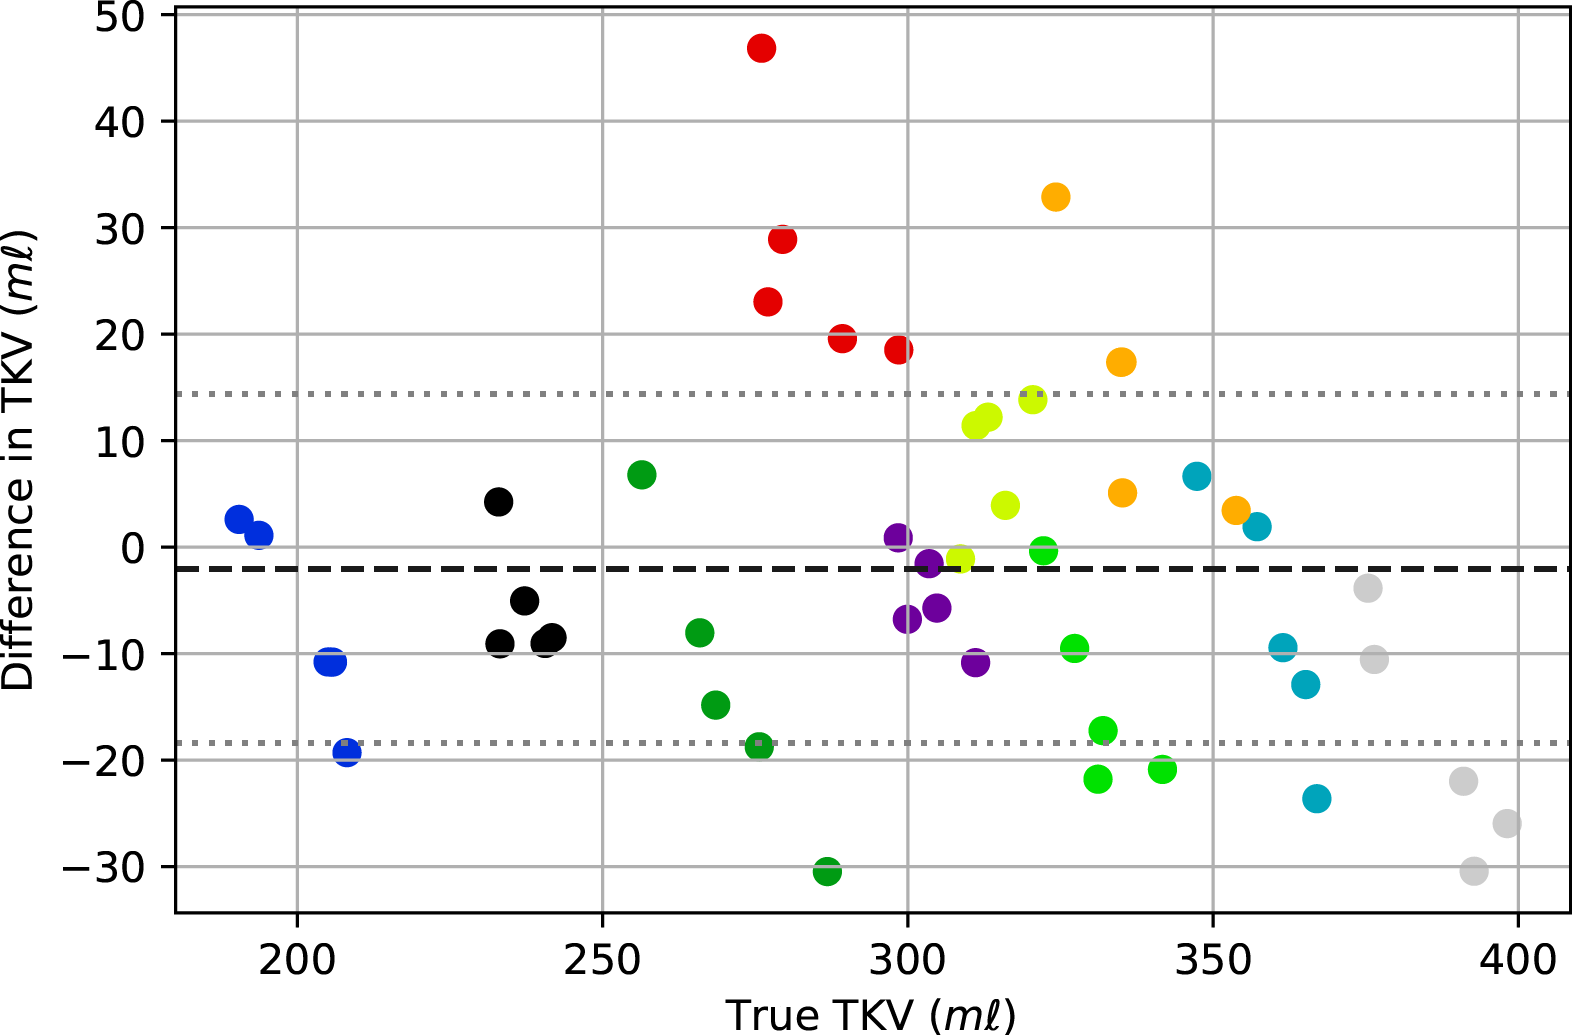
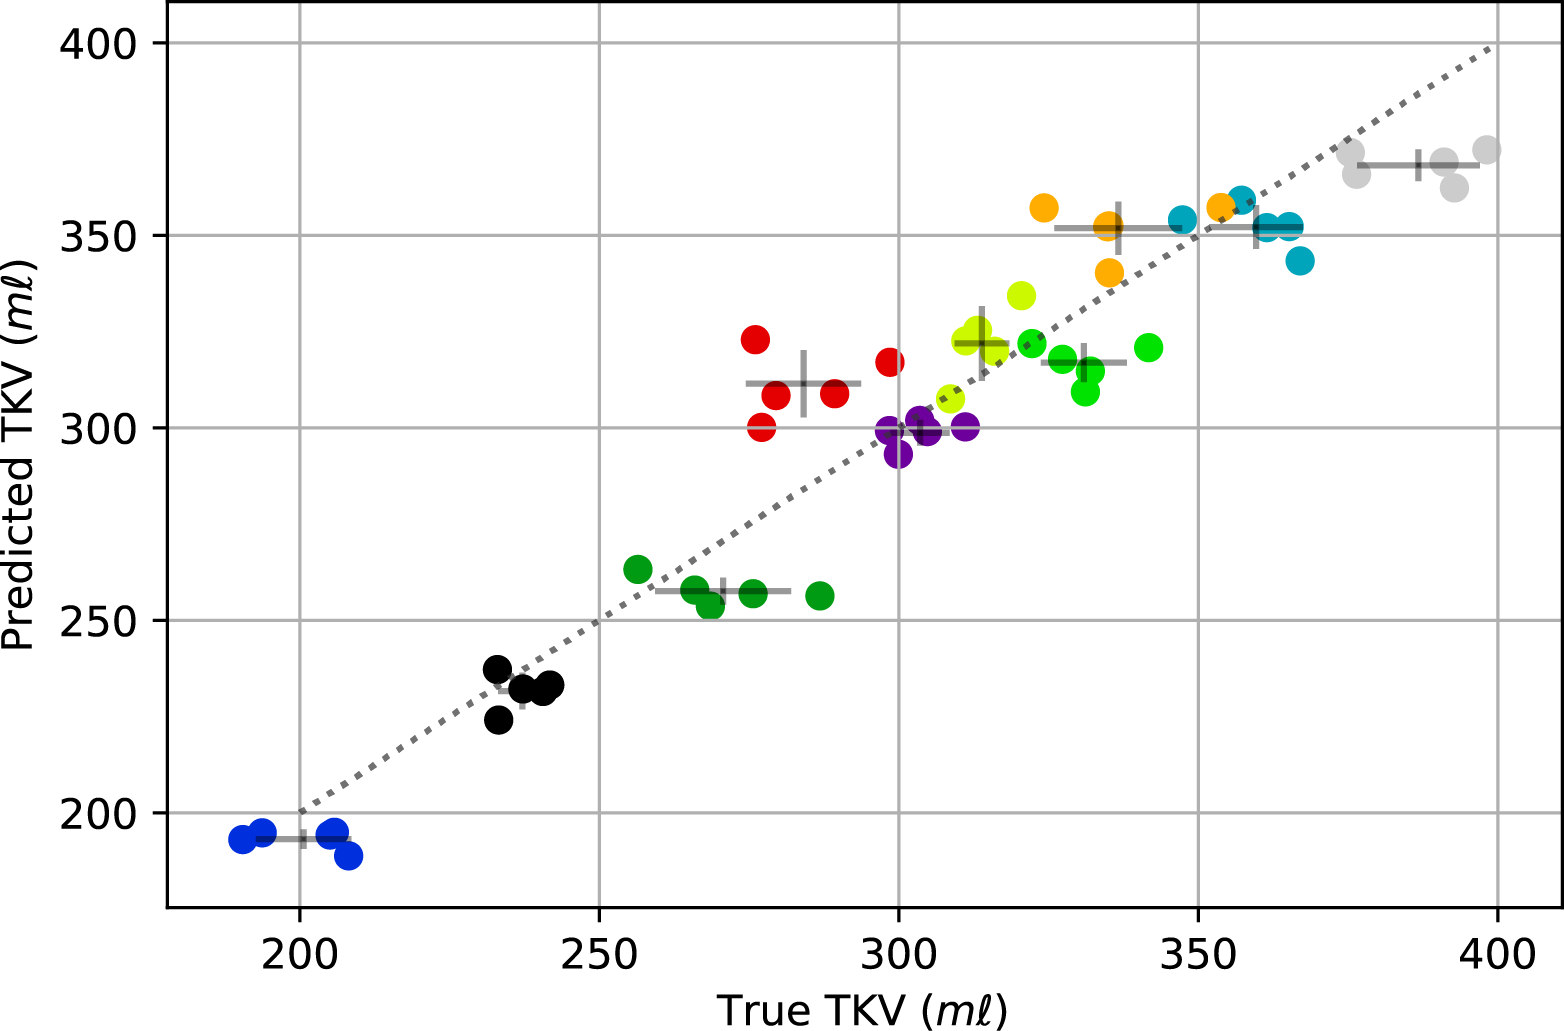
The trained network was used to predict an ROI and thus to compute TKV for each of the unseen validation volumes, producing a mean Dice score of 0.93±0.02. Figure 3 shows examples of the output from the network. The CKD cohort included subjects with cysts which were not included in the manual ROI. The network worked sufficiently well to exclude cysts. Further the network could also exclude renal vessels due to their similarly large intensity, as seen in the left healthy control kidney in Figure 3. The TKV predicted by the network was, on average, 2.0±16.5 ml less than the manually segmented TKV. The accuracy of the TKV from the network for the HC and CKD cohorts was comparable (3.6±20.1 ml greater than manual segmentation and 7.7±9.4 ml less than manual segmentation respectively). This consistency across subjects is also seen in Figure 4, which shows the discrepancy between the network and manual TKV, this shows that the network consistently predicts accurate TKV over the full range of TKV in the cohort. In Figure 5, it can be seen that in eighty percent of subjects, the variance in TKV between the five repeat volumes collected for each subject is smaller when using the network to predict TKV than the manual segmentation to estimate TKV. Given we know the TKV did not change within the scanning window, this reflects that the network produces more precise results than the manual ROI generated by humans.Conclusion
We have developed an algorithm to accurately and quickly segment the kidneys in MRI data with no user input. This method works well with both data from HC and CKD subjects. In future this algorithm could easily be modified to work well with other patient groups with sufficient training data.Acknowledgements
We gratefully acknowledge the support of NVIDIA Corporation with the donation of the Titan Xp GPU used for this research.References
1. Tangri, N. et al. Total Kidney Volume as a Biomarker of Disease Progression in Autosomal Dominant Polycystic Kidney Disease. Can. J. Kidney Health Dis. 4, 2054358117693355 (2017).
2. Gong, I. H. et al. Relationship Among Total Kidney Volume, Renal Function and Age. J. Urol. 187, 344–349 (2012).
3. Morris, D. et al. Segmentation of the Cortex and Medulla in Multiparametric Magnetic Resonance Images of the Kidney using K-Means Clustering. in Proc. Intl. Soc. Mag. Reson. Med. 27 vol. 27 1915 (2019).
4. Zöllner, F. G. et al. Assessment of Kidney Volumes From MRI: Acquisition and Segmentation Techniques. Am. J. Roentgenol. 199, 1060–1069 (2012).
5. Wachinger, C., Reuter, M. & Klein, T. DeepNAT: Deep convolutional neural network for segmenting neuroanatomy. NeuroImage 170, 434–445 (2018).
6. Petzold, K. et al. Building a network of ADPKD reference centres across Europe: the EuroCYST initiative. Nephrol. Dial. Transplant. 29, iv26–iv32 (2014).
Figures