0810
Deep Learning for Determination of Myometrial Invasion Depth and Automatic Lesion Identification Based on Endometrial Cancer MR Imaging1Shanghai Key Laboratory of Magnetic Resonance, East China Normal University, Shanghai, China, 2Department of Radiology, Obstetrics and Gynecology Hospital, Fudan University, Shanghai, China, 3MR Scientific Marketing, Siemens Healthcare, Shanghai, China
Synopsis
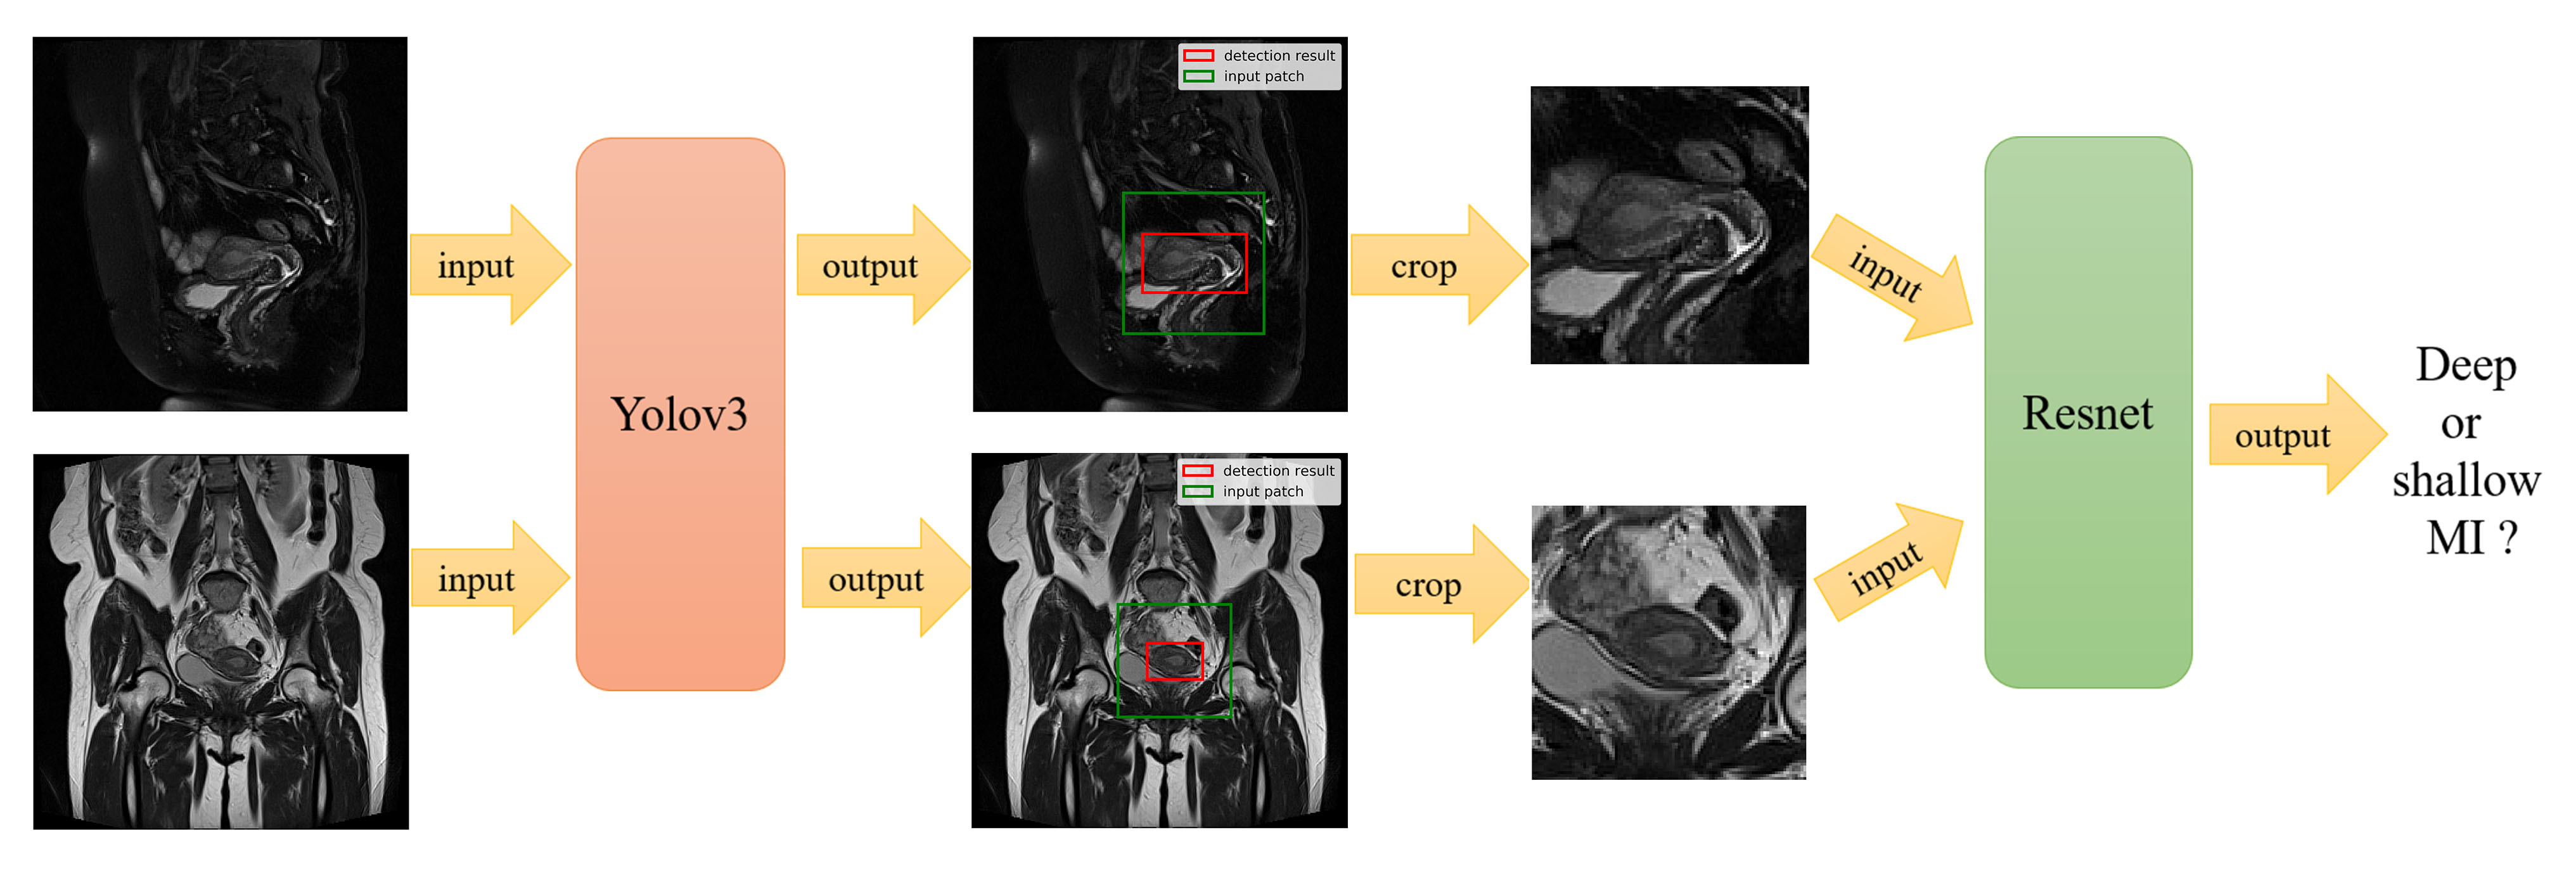
We proposed an deep learning approach to locate lesion and evaluate the myometrial invasion (MI) depth automatically on magnetic resonance (MR) images. Firstly, we trained a detection model based on YOLOv3 to locate lesion area on endometrial cancer MR (ECM) images. Then, the detected lesion regions on both sagittal and coronal images were simultaneously fed into a classification model based on Resnet to identify MI depth. Precision-recall curve, receiver operating characteristic curve and confusion matrix were used to evaluate the performance of the proposed method. The proposed model achieved good and time-efficient performance.
INTRODUCTION:
Endometrial cancer (EC) is the most common gynecologic malignancy and for patients with advanced EC, radical hysterectomy is always needed1. Myometrial invasion (MI) is a crucial factor for determining the suitable surgical approach2. It is a challenge for radiologists to accurately evaluate the MI depth solely on MR images before surgery, especially for some older patients with trophy uterus. Inspired by the recent achievements of deep learning in medical images3, we proposed a deep learning (DL) approach to locate lesion and evaluate the MI depth automatically based on MR images.METHODS:
We retrospectively collected 554 sagittal and coronal T2 MRI cases with pathologically proved endometrial cancer from Obstetrics and Gynecology Hospital of Fudan University between Jan 1st 2014 to Dec 31 2017. MRI was performed using a 1.5-T MR system (Magnetom Avanto, Siemens, Erlangen, Germany) with a phased-array coil. Two experienced radiologists (H.Z. and M.S.) manually drew a bounding box to encompass lesion and surrounding structure with MATLAB (version R2018b, MathWorks, Natick) on each slice, instead of outlining the lesion margin. These bounding boxes were treated as ground truth of the detection model. Patients were divided into two groups: deep MI (more than 50%) and shallow MI (less than 50%) according to pathological diagnosis. The data set was randomly split into three sets of training (333 cases, 45 deep vs. 288 shallow), validation (83 cases, 11 deep vs. 72 shallow) and testing (138 cases, 18 deep vs. 120 shallow). We applied rotation, stretch, and shift operations to augment training and validation datasets to avoid overfitting. Since shallow MI cases outnumbered deep ones, we up-sampled deep MI cases to the same number as shallow ones in the training process.Proposed deep learning approach consisted of two stages (Figure 1). In the first stage, a detection network based on YOLOv34 was used to locate the lesion bounding box on each slice. In each case, we selected three slices with the largest lesion area from each of the two selected protocols. Then the slices were cropped to patches of size of 96 x 96, centered at the lesion bounding box and covering the whole lesion area. One sagittal and one coronal patch were combined as a paired-patch, so there were nine paired-patches in each case. In the second stage, the paired-patches were used to train a classification model based on Resnet5 to predict the probability of deep MI. In the test phase, the average probability of these nine pairs was used to evaluate MI depth in each case.
We used Adam algorithm with an initial learning rate of 0.001 to minimize the cross-entropy loss function. Both models were implemented using TensorFlow (version: 1.12.0). The experiments were conducted on a workstation equipped with four NVIDIA TITAN XP GPUs. It took about 5 hours to train the detection model and 4 hours to train the classification model. It took less than two seconds to complete this two-step evaluation for one case.
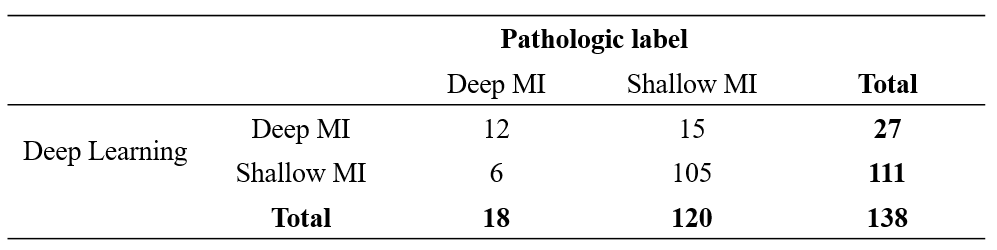
In the testing dataset, the precision-recall (PR) curve was used to evaluate the lesion detection results between detection network and ground truth. We used receiver operating characteristic (ROC) curve and confusion matrix between pathological label and our algorithm to evaluate the performance of classification model. The deep MI was treated as positive.
RESULTS:
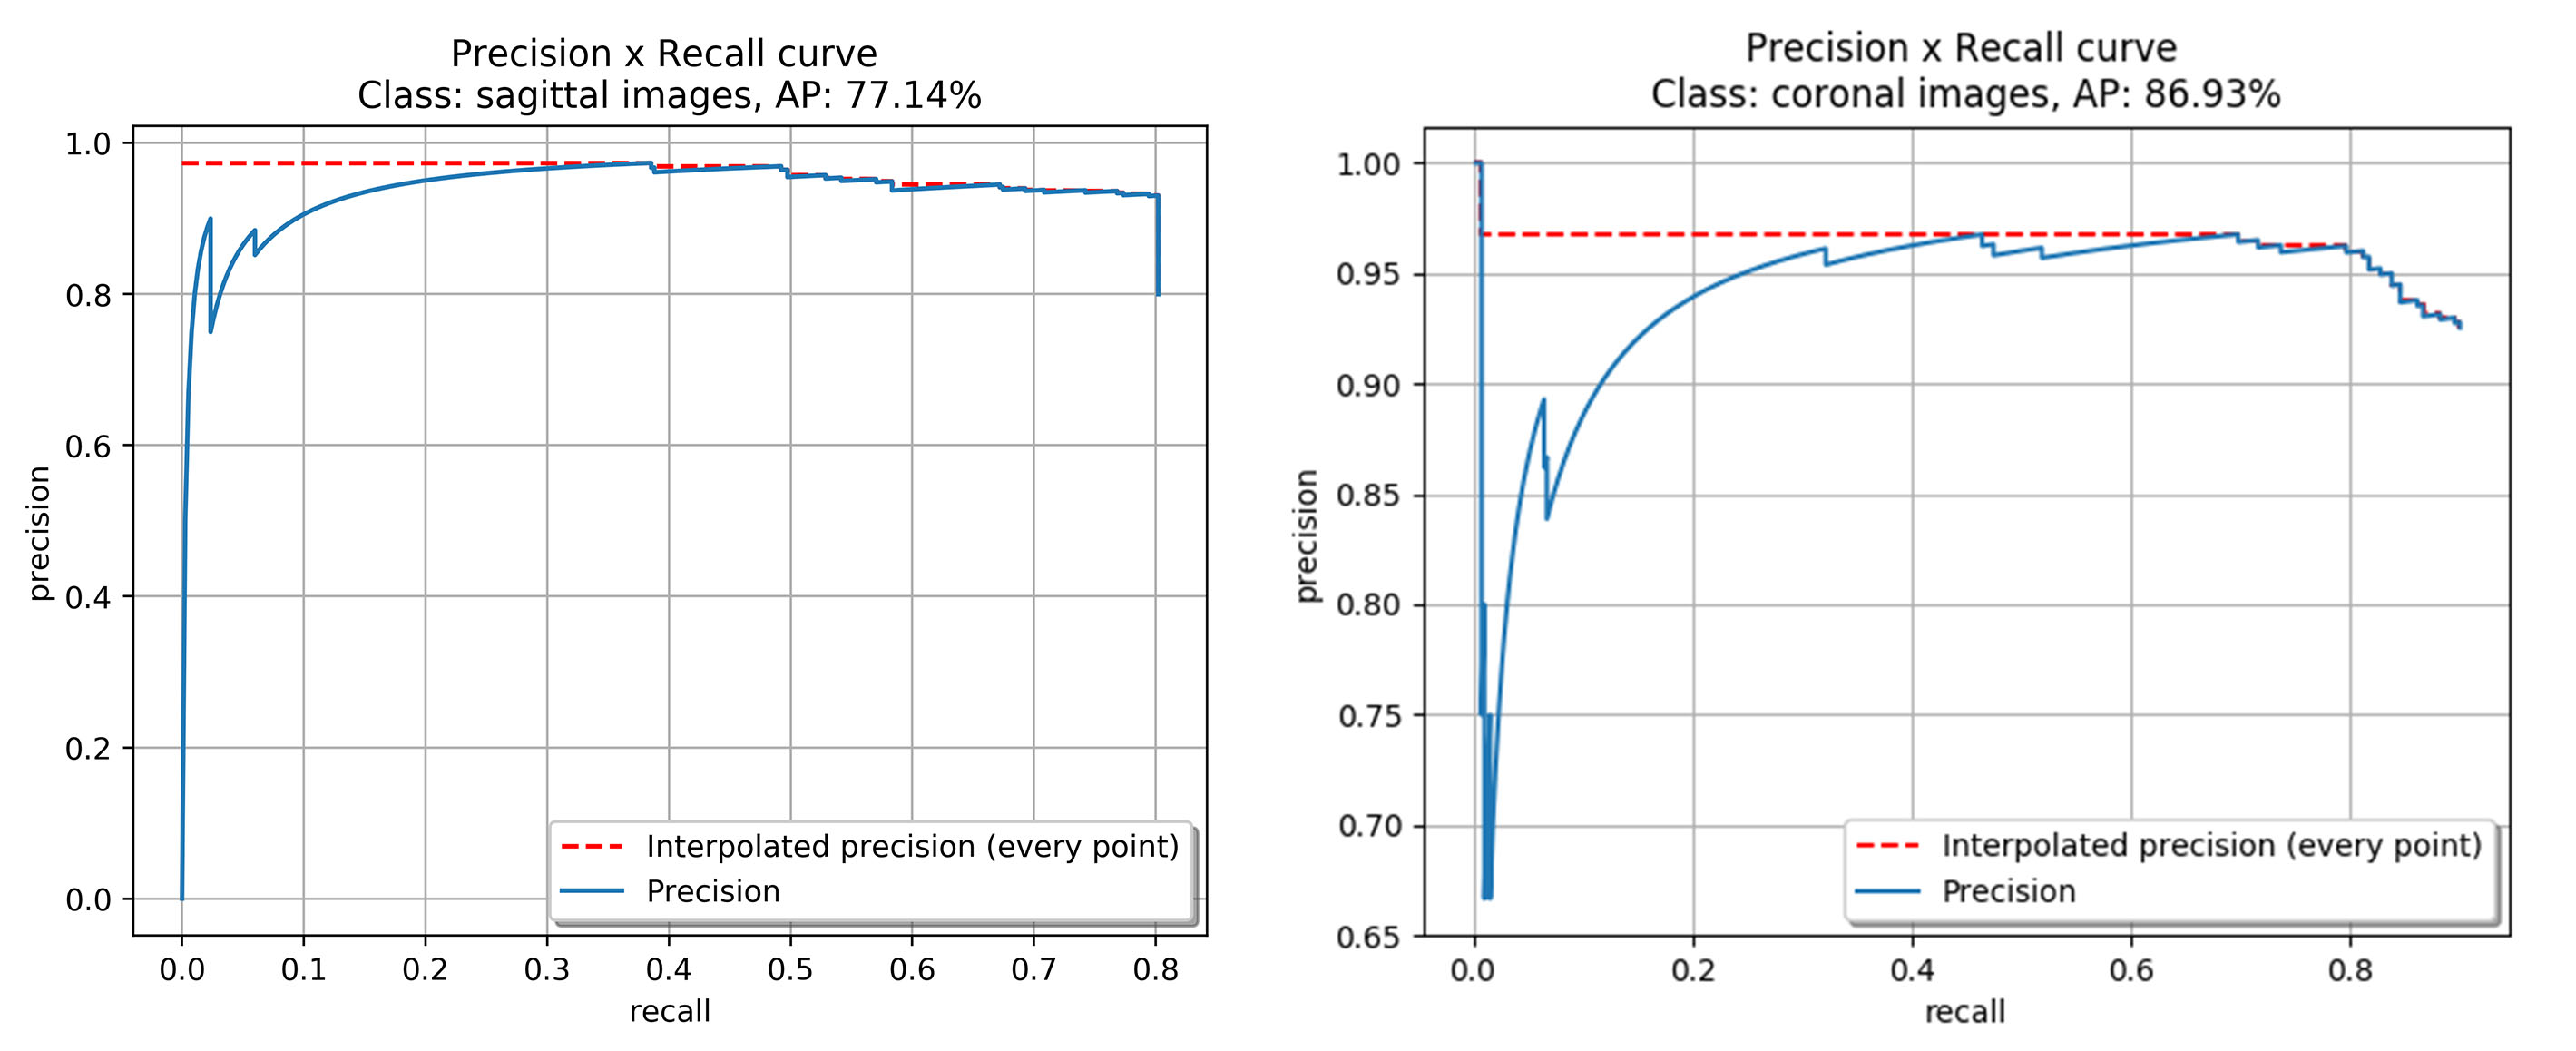
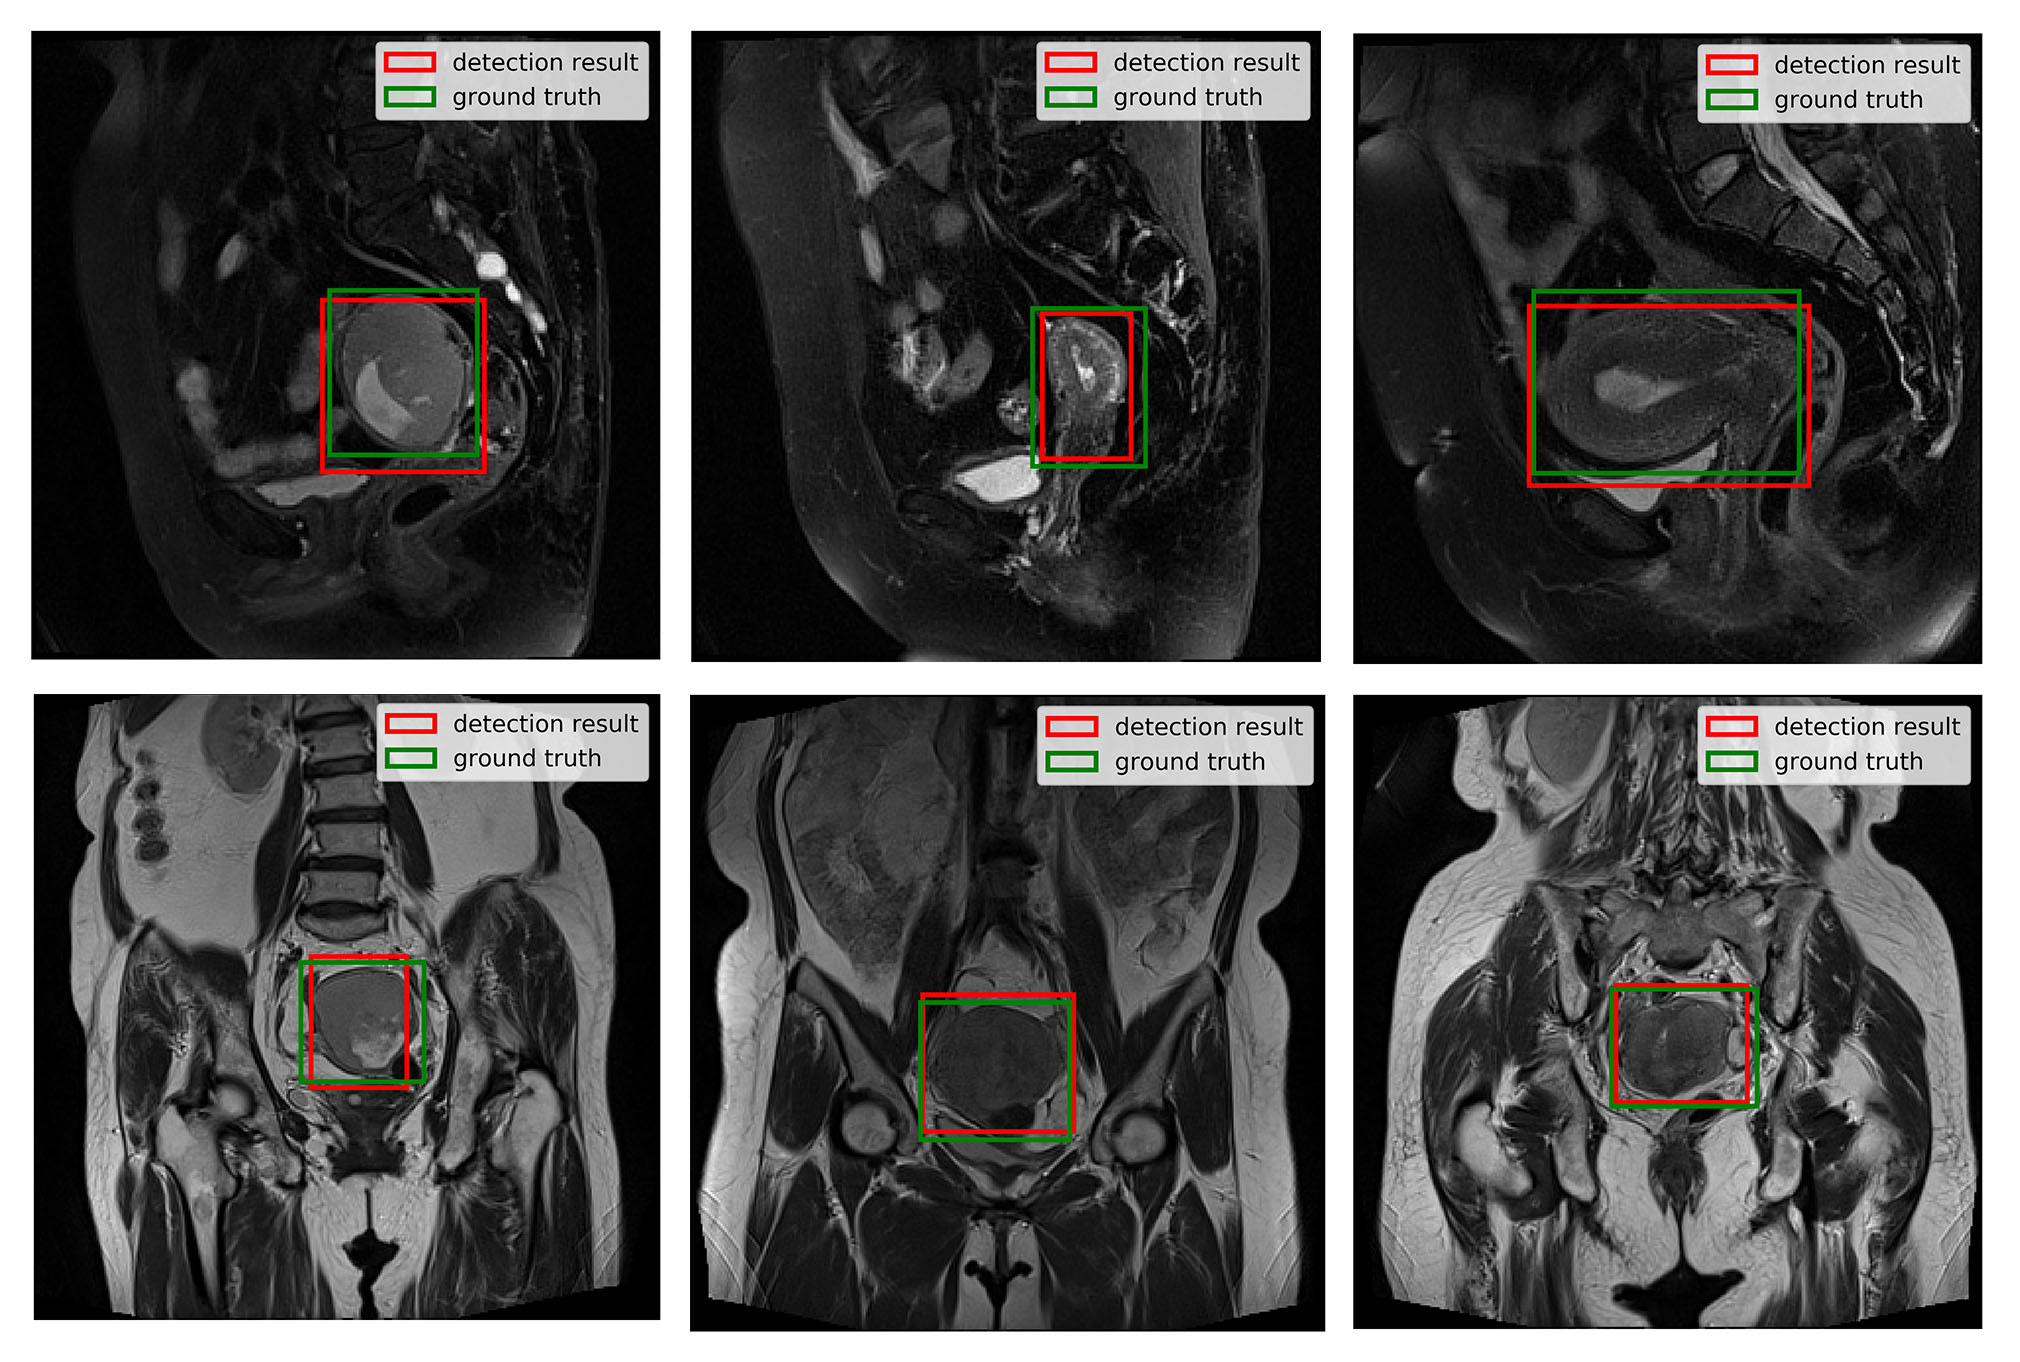
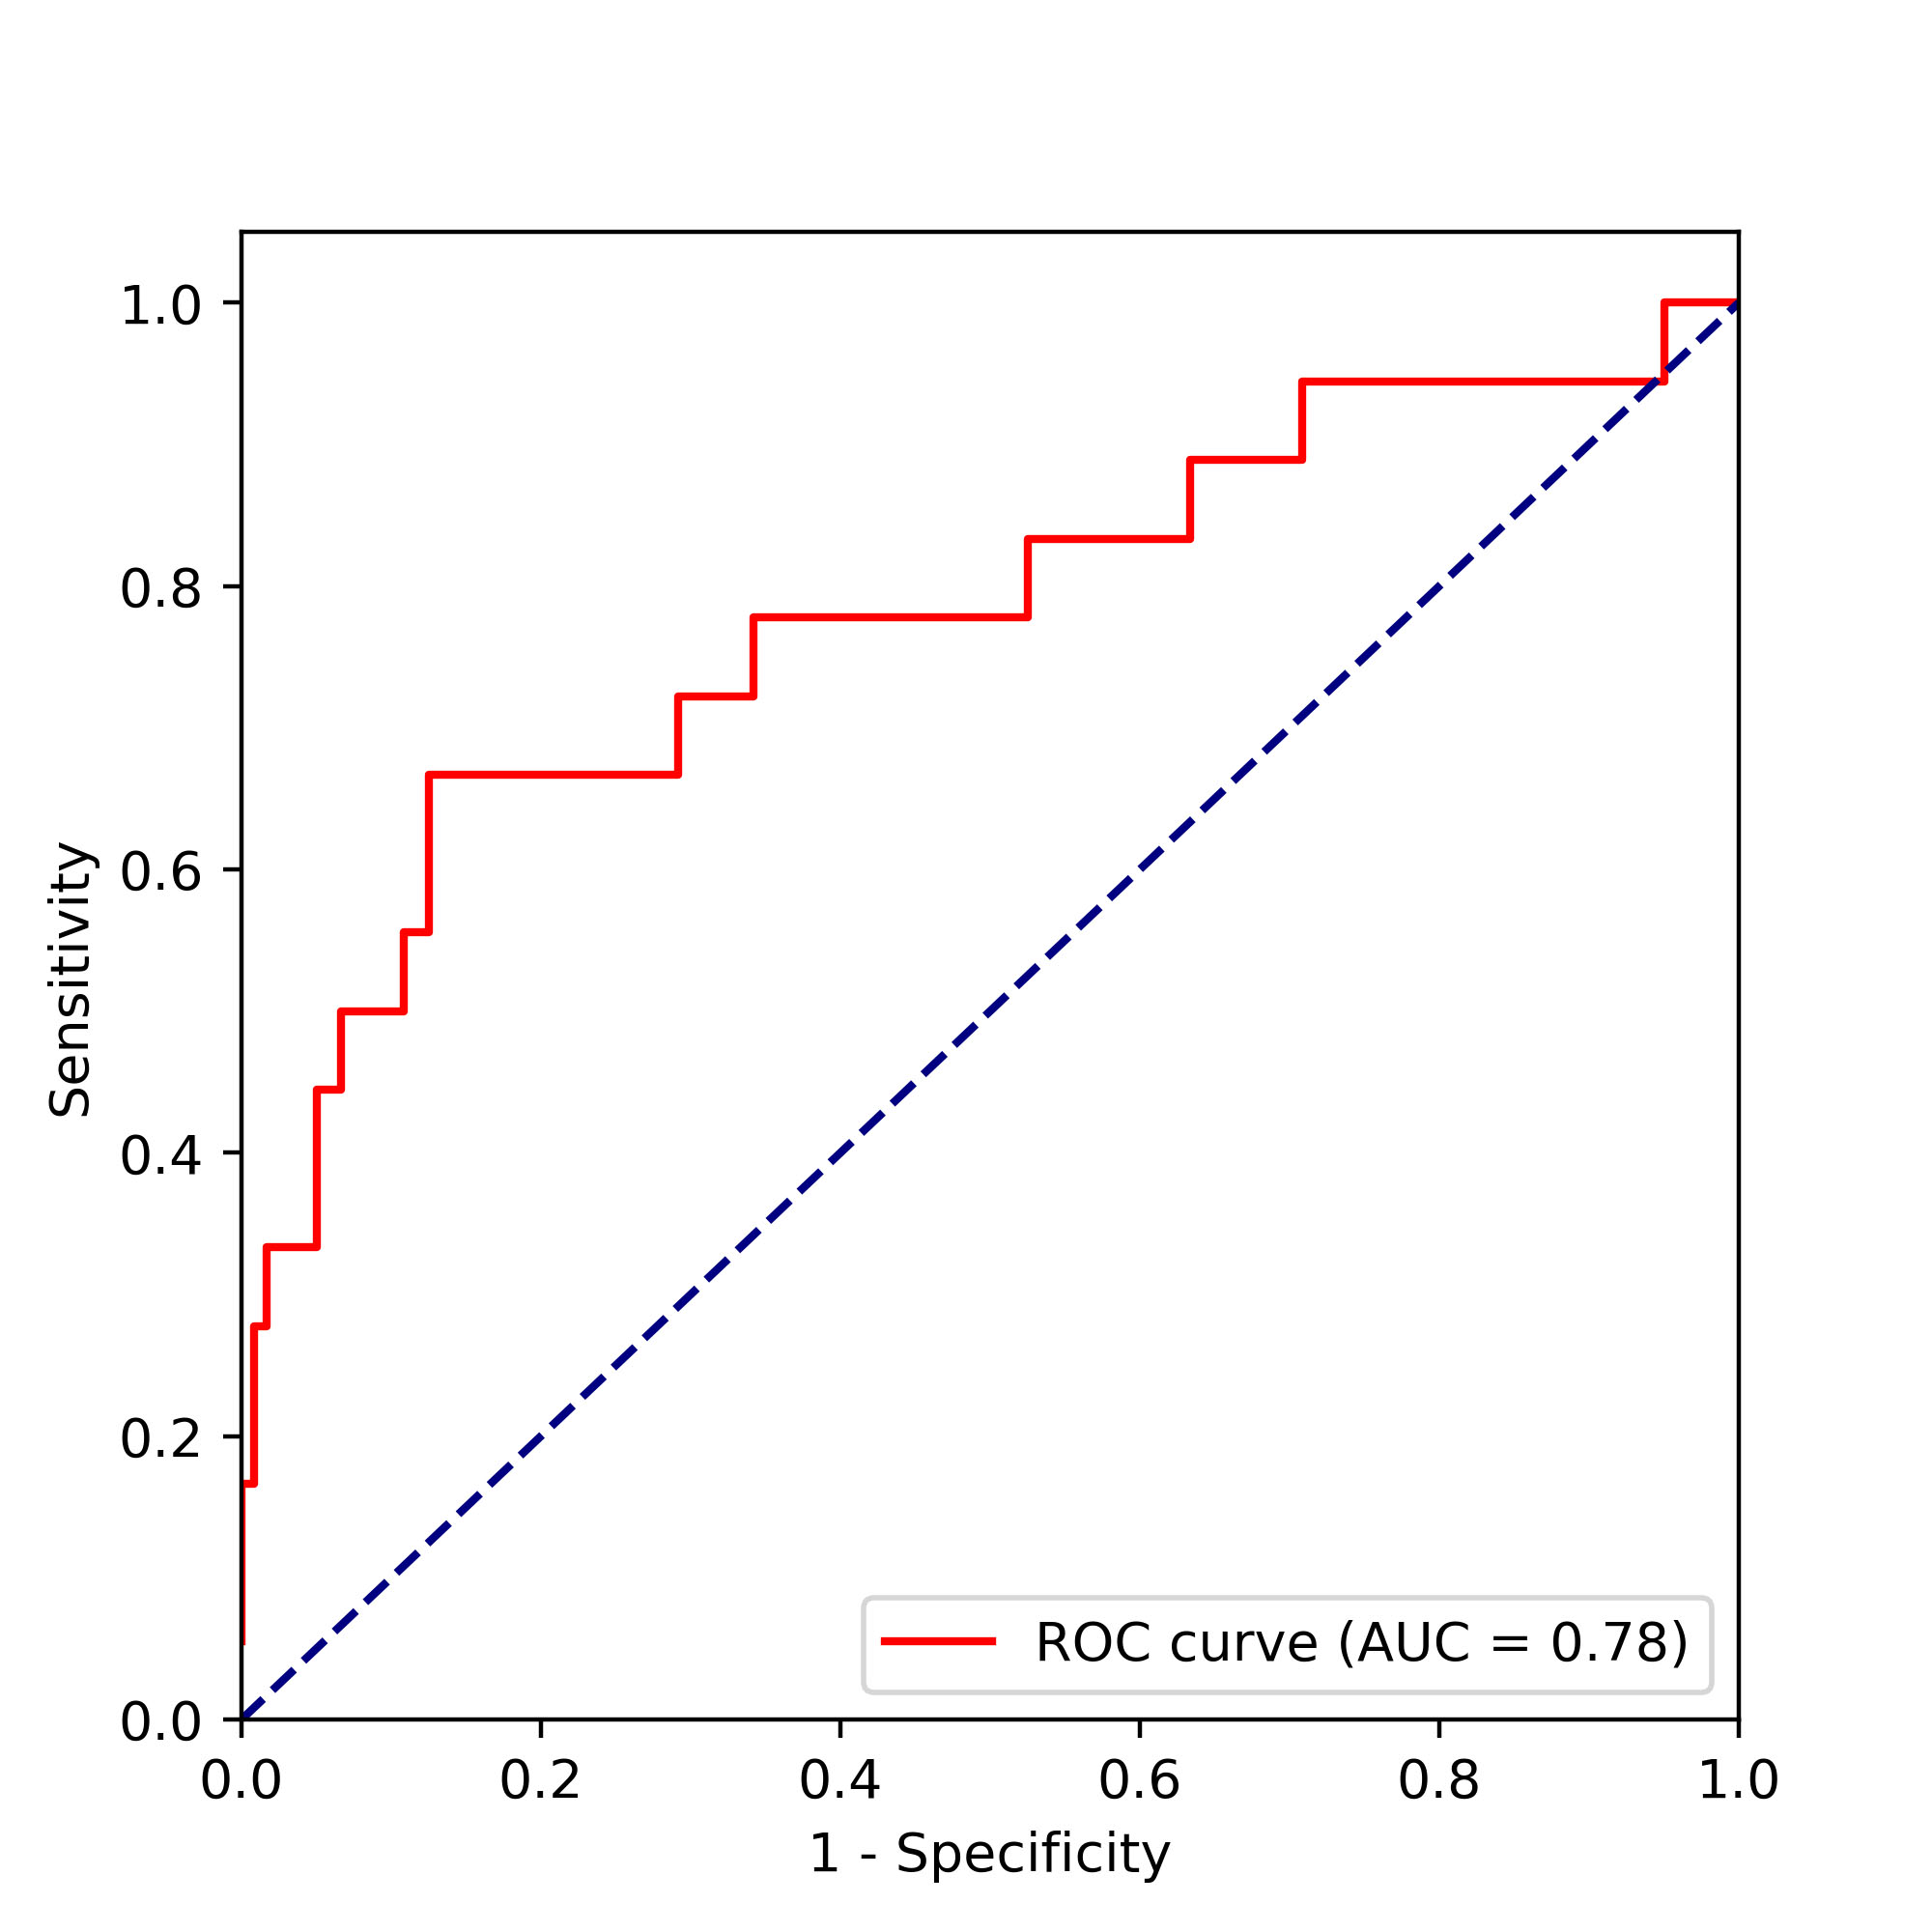
The detection model achieved an average precision (AP) of 77.14% and 86.93% based on 0.5 intersection over union (IOU) in sagittal and coronal testing images, respectively. The corresponding PR curves were shown in Figure 2. From the comparison between detected lesion region and ground truth (Figure 3), we can see that YOLOv3 could accurately detect lesion region in MR images.The classification model yielded an area under ROC (AUC) of 0.78 (95% confidence interval: 0.714 – 0.798; p <0.001), an accuracy (ACC) of 84.78%, a sensitivity (SEN) of 66.67%, a specificity (SPE) of 87.50%, a positive predictive value (PPV) of 44.44% and a negative predictive value (NPV) of 94.59% in determining deep MI. The ROC curve and confusion matrix were shown in Figure 4 and Table 1, respectively.
DISCUSSION:
Compared with ECM radiomics study6, which requires outlining the visible endometrial cancer lesion on MR images, we only drew a box encompassing the lesion and the surrounding normal anatomic structure. We believed this procedure could help decrease the operator-dependent segmentation bias and also improve the efficiency of workflow as case-by-case labeling is not only time-consuming but also lacks of standardization to some extent. Compared with extracting features over the entire image for evaluating MI depth, our two-stage approach avoided hand-crafted feature engineering and used deep learning to automatically to extract image features relevant to lesion detection and MI classification.CONCLUSION:
In summary, our results suggested that the deep learning models derived from ECM provided a competitive, time-efficient diagnostic approach for MI depth identification and helped clinicians to stage EC with high ACC. This approach can be adapted easily to diagnose other diseases in different medical images.Acknowledgements
This project is supported by National Natural Science Foundation of China (61731009, 81771816).References
1. Colombo N, Preti E, Landoni F, et al. Endometrial cancer: ESMO clinical practice guidelines for diagnosis, treatment and follow-up. Annals of Oncology. 2013; 24(SUPPL.6).
2. Lavaud P, Fedida B, Canlorbe G, Bendifallah S, Darai E, Thomassin-Naggara I. Preoperative MR imaging for ESMO-ESGO-ESTRO classification of endometrial cancer. Diagnostic and Interventional Imaging. 2018; 99:387–396.
3. Litjens G, Kooi T, Bejnordi BE, et al. A survey on deep learning in medical image analysis. Medical image analysis. 2017; 42:60–88.
4. Redmon J, Farhadi A, Ap C. YOLOv3. Nutrition Reviews. 2018; 36:346–348.
5. He K, Zhang X, Ren S, Sun J. Deep Residual Learning for Image Recognition. arXiv preprint arXiv:151203385v1. 2015; 7:171–180.
6. Günakan E, Atan S, Haberal AN, Küçükyıldız İA, Gökçe E, Ayhan A. A novel prediction method for lymph node involvement in endometrial cancer: Machi learning. International Journal of Gynecological Cancer. 2019; 29:320–324.
Figures