0806
Longitudinal study of quantitative susceptibility mapping in patients with the first episode of psychosis
Marisleydis García1,2,3, Néstor Muñoz1,2,3, Carlos Milovic1,2,3, Luz María Alliende4, Bárbara Iruretagoyena4, Alfonzo Gonzalez5, Julio Acosta Carbonero6, Cristián Montalba2,3, Nicolás Crossley2,4, Sergio Uribe2,3, and Cristián Tejos1,2,3
1Departament Electrical Engineering, Pontificia Universidad Catolica de Chile, Santiago de Chile, Chile, 2Biomedical Imaging Center, Pontificia Universidad Catolica de Chile, Santiago de Chile, Chile, 3Millennium Nucleus for Cardiovascular Magnetic Resonance, Pontificia Universidad Catolica de Chile, Santiago de Chile, Chile, 4Neurology Department, School of Medicine, Pontificia Universidad Catolica de Chile, Santiago de Chile, Chile, 5Instituto Psiquiátrico Horwitz, Santiago de Chile, Chile, 6Tenoke Ltd., Cambridge, United Kingdom
1Departament Electrical Engineering, Pontificia Universidad Catolica de Chile, Santiago de Chile, Chile, 2Biomedical Imaging Center, Pontificia Universidad Catolica de Chile, Santiago de Chile, Chile, 3Millennium Nucleus for Cardiovascular Magnetic Resonance, Pontificia Universidad Catolica de Chile, Santiago de Chile, Chile, 4Neurology Department, School of Medicine, Pontificia Universidad Catolica de Chile, Santiago de Chile, Chile, 5Instituto Psiquiátrico Horwitz, Santiago de Chile, Chile, 6Tenoke Ltd., Cambridge, United Kingdom
Synopsis
Psychosis has been related with dopamine alterations in deep brain nuclei. Neuromelanin is a by-product of the synthesis of dopamine and it is synthesized via iron-dependent oxidation. Thus, susceptibility might give a window to study the progression of dopamine levels at deep brain nuclei of psychotic patients. We studied a cohort of patients with First Episode of Psychosis (FEP) using QSM at two time points and compared them with healthy controls. We found susceptibility changes in seven subcortical areas at FEP onset. We also found susceptibility changes at the left globus pallidus interna after three months of pharmacological treatment.
Introduction
In psychosis, dopaminergic neurons have an important role as dopamine levels tend to rise. Projections of dopaminergic neurons extend from the substantia nigra pars compacta to the dorsal striatum(1). Neuromelanin is known to be a by-product of dopamine metabolism (2). Neuromelanin is a dark pigment synthesized via iron-dependent oxidation in midbrain dopamine neurons (3). Given its association to iron complexes, neuromelanin is paramagnetic (4), and thus it can be imaged using MRI, specifically with QSM. Although is a matter of argue, some authors have identified an inverse relationship between dopamine and neuromelanin levels (5). We examined the time evolution of susceptibility (and thus indirectly of neuromelanin and dopamine) in the striatum and deep brain nuclei of pharmacologically-treated patients with the first episode of psychosis (FEP).Methods
We studied two groups: 63 FEP patients (mean age 20 y-o, range 16-35 y-o) and 57 healthy subjects (mean age 23 y-o, range 15-32 y-o) (table 1). Each group was scanned at two different times (t1=0 and t2=3 months) with a 3T Philips Ingenia scanner. Turbo Gradient Echo sequence, voxel size: 0.59x0.59x1mm, TR/TE/ΔTE=44/7.2/6.2ms, 5 echoes, bandwidth 550.5 Hz. We computed QSM maps using the following pipeline: (I) Laplacian phase unwrapping (6). (II) Background field removal using Laplacian Boundary Value (LBV) (7). (III) Polynomial fit subtraction. (IV) Additional background field removal using vSHARP (1-32vx) (8). (IV) Weighted sum of echoes (weights proportional to echo time and signal magnitude). (V) Dipole inversion using Weak Harmonics QSM (WH-QSM, FANSI Toolbox) (9). Regularization parameters optimized using the L-curve (TV weight: 1x10⁻⁴ and WH weight: 0.1). Images were co-registered to a structural T1w-MPRAGE of the subjects and normalized with Multicontrast PD25 atlas (10–12) using SPM(12). We applied a Mann Whitney U test to compare susceptibility values between FEP patients and healthy subjects of both t1 and t2 datasets, focusing on deep brain nuclei and striatum. This was repeated with a mixed model test considering age, gender and a binary value (patient or control) as fixed variables (no random variables). To evaluate the time evolution of patients, we used the same mixed model considering age, gender, the binary value and symptomatology (using the scale of PANSS (13)) as fixed variables and repeated measurements (i.e. times t1 and t2) as a random variable.Results
At time t1, we found significant differences in susceptibility between patients and controls in seven subcortical regions, being the Globus Pallidus externa (GPe) (both hemispheres), putamen (both hemispheres), left caudate and thalamus (both hemispheres) the most significant ones. These reductions in susceptibility of patients were verified by both statistical tests (Table 2 and Figure 1A). At time t2 left putamen and left thalamus remained with statistically significant differences (Figure 1B), whereas left caudate and GPe showed no significant differences. For patients, the linear mixed model test showed correlations between age and susceptibility values for left and right putamen and caudate. The most significant correlation between positive symptoms and susceptibility was for left GPe. We also found a correlation in a left globus pallidus interna (GPi) with susceptibility values for repeated measurements (Table 3). We measured a significant reduction in QSM maps for GPe and GPi in FEP patients (Figure 2).Discussion and conclusion
Our findings showed significant differences between controls and patients with a recent onset of FEP in the striatum (caudate and putamen), which has previously reported for schizophrenia studies (14). The most significant differences were in GPe. This is consistent with (15) in which authors reported a lower concentration of neuromelanin than that observed in the substantia nigra (NC) and locus coeruleus (LC). We found correlations between age and susceptibility in caudate and putamen which has also been previously reported (15). In the left GPi showed a correlation between susceptibility values and time. This last finding might be considered as a potential marker to analyze the pharmacological treatment of FEP patients.Acknowledgements
Grant funding Fondecyt 1191710, Anillo 190064, Millenium Science Initiative of the Ministry of Economy, Development and Tourism, grant Nucleus for Cardiovascular Magnetic Resonance.References
- Klein MO, Battagello DS, Cardoso AR, Hauser DN, Bittencourt JC, Correa RG. Dopamine: Functions, Signaling, and Association with Neurological Diseases. Cell Mol Neurobiol. 2019 Jan;39(1):31–59.
- Shibata E, Sasaki M, Tohyama K, Otsuka K, Endoh J, Terayama Y, et al. Use of neuromelanin-sensitive MRI to distinguish schizophrenic and depressive patients and healthy individuals based on signal alterations in the substantia nigra and locus ceruleus. Biol Psychiatry. 2008 Sep 1;64(5):401–6.
- Zecca L, Bellei C, Costi P, Albertini A, Monzani E, Casella L, et al. New melanic pigments in the human brain that accumulate in aging and block environmental toxic metals. Proc Natl Acad Sci U S A. 2008 Nov 11;105(45):17567–72.
- Cassidy CM, Zucca FA, Girgis RR, Baker SC, Weinstein JJ, Sharp ME, et al. Neuromelanin-sensitive MRI as a noninvasive proxy measure of dopamine function in the human brain. Proc Natl Acad Sci. 2019 Mar 12;116(11):5108–17.
- Ito H, Kawaguchi H, Kodaka F, Takuwa H, Ikoma Y, Shimada H, et al. Normative data of dopaminergic neurotransmission functions in substantia nigra measured with MRI and PET: Neuromelanin, dopamine synthesis, dopamine transporters, and dopamine D2 receptors. NeuroImage. 2017 Sep 1;158:12–7.
- Li W, Avram AV, Wu B, Xiao X, Liu C. Integrated Laplacian-based phase unwrapping and background phase removal for quantitative susceptibility mapping. NMR Biomed. 2014 Feb;27(2):219–27.
- Zhou D, Liu T, Spincemaille P, Wang Y. Background field removal by solving the Laplacian boundary value problem. NMR Biomed. 2014;27(3):312–9.
- Bilgic B, Fan AP, Polimeni JR, Cauley SF, Bianciardi M, Adalsteinsson E, et al. Fast quantitative susceptibility mapping with L1-regularization and automatic parameter selection. Magn Reson Med. 2014 Nov;72(5):1444–59.
- Milovic C, Bilgic B, Zhao B, Langkammer C, Tejos C, Acosta-Cabronero J. Weak-harmonic regularization for quantitative susceptibility mapping. Magn Reson Med. 2019;81(2):1399–411.
- Xiao Y, Beriault S, Pike GB, Collins DL. Multicontrast multiecho FLASH MRI for targeting the subthalamic nucleus. Magn Reson Imaging. 2012 Jun;30(5):627–40.
- Xiao Y, Fonov V, Bériault S, Al Subaie F, Chakravarty MM, Sadikot AF, et al. Multi-contrast unbiased MRI atlas of a Parkinson’s disease population. Int J Comput Assist Radiol Surg. 2015 Mar;10(3):329–41.
- Xiao Y, Fonov V, Chakravarty MM, Beriault S, Al Subaie F, Sadikot A, et al. A dataset of multi-contrast population-averaged brain MRI atlases of a Parkinson׳s disease cohort. Data Brief. 2017 Apr 15;12:370–9.
- Opler MGA, Yavorsky C, Daniel DG. Positive and Negative Syndrome Scale (PANSS) Training. Innov Clin Neurosci. 2017 Dec 1;14(11–12):77–81.
- Avram M, Brandl F, Cabello J, Leucht C, Scherr M, Mustafa M, et al. Reduced striatal dopamine synthesis capacity in patients with schizophrenia during remission of positive symptoms. Brain. 2019 Jun 1;142(6):1813–26.
- Zucca FA, Segura-Aguilar J, Ferrari E, Muñoz P, Paris I, Sulzer D, et al. Interactions of iron, dopamine and neuromelanin pathways in brain aging and Parkinson’s disease. Prog Neurobiol. 2017 Aug 1;155:96–119.
Figures
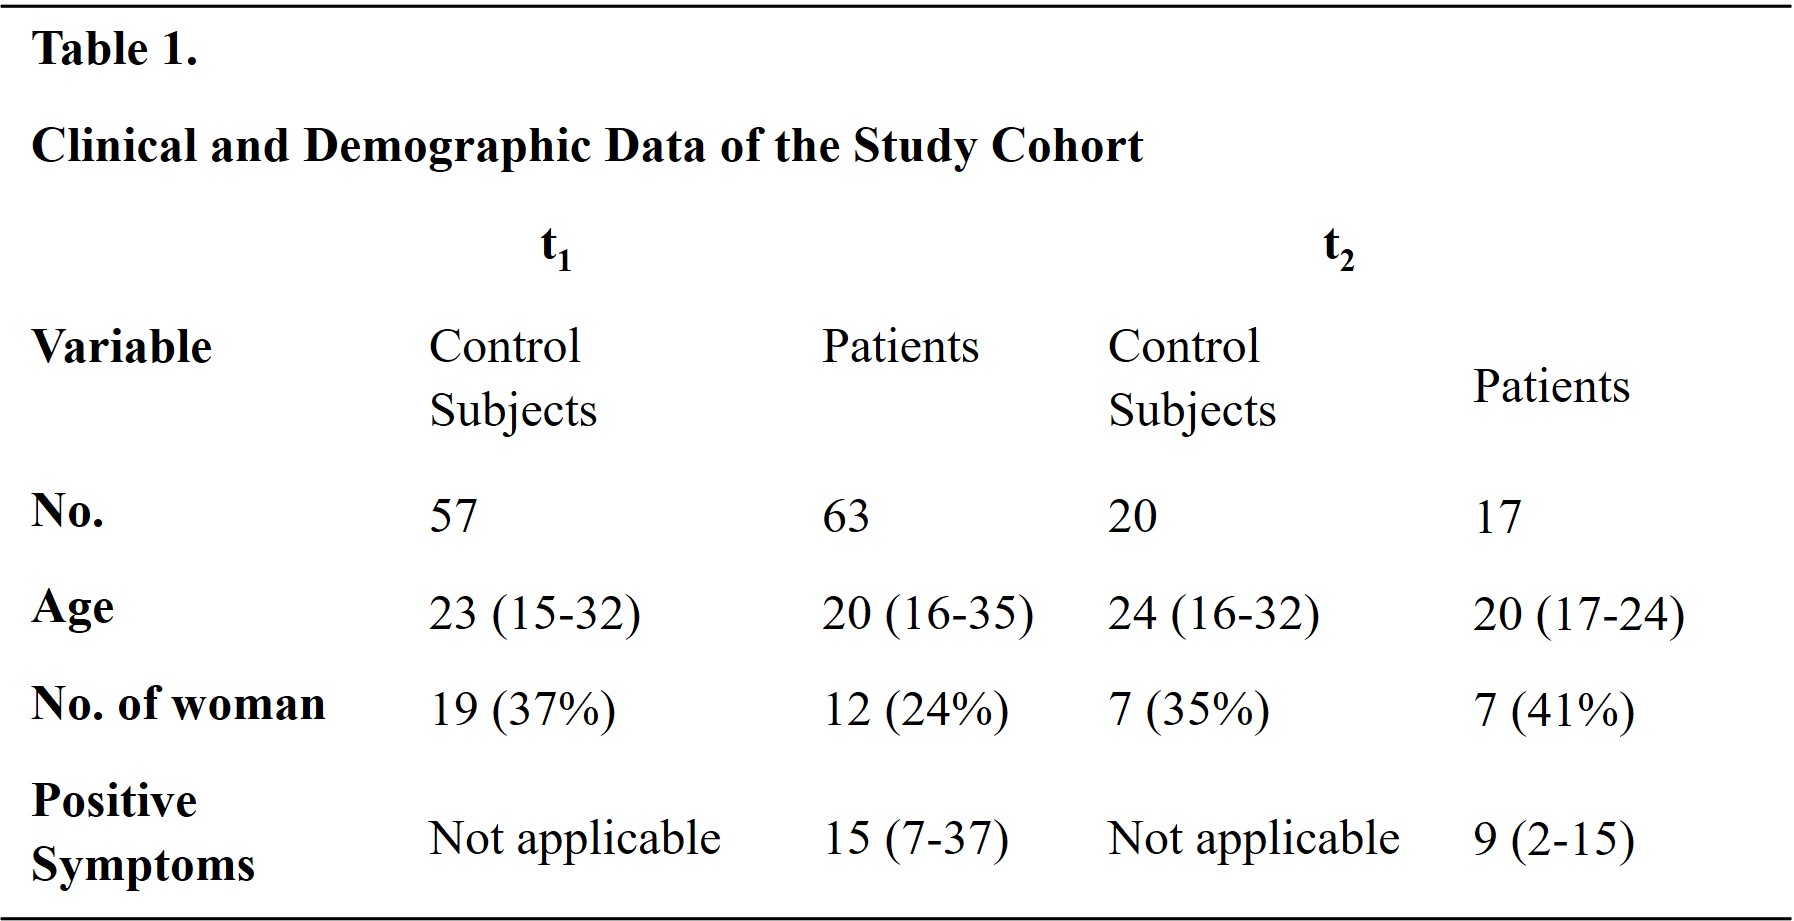
Table 1. Clinical and
Demographic Data of the Study Cohort for two acquisition sets.
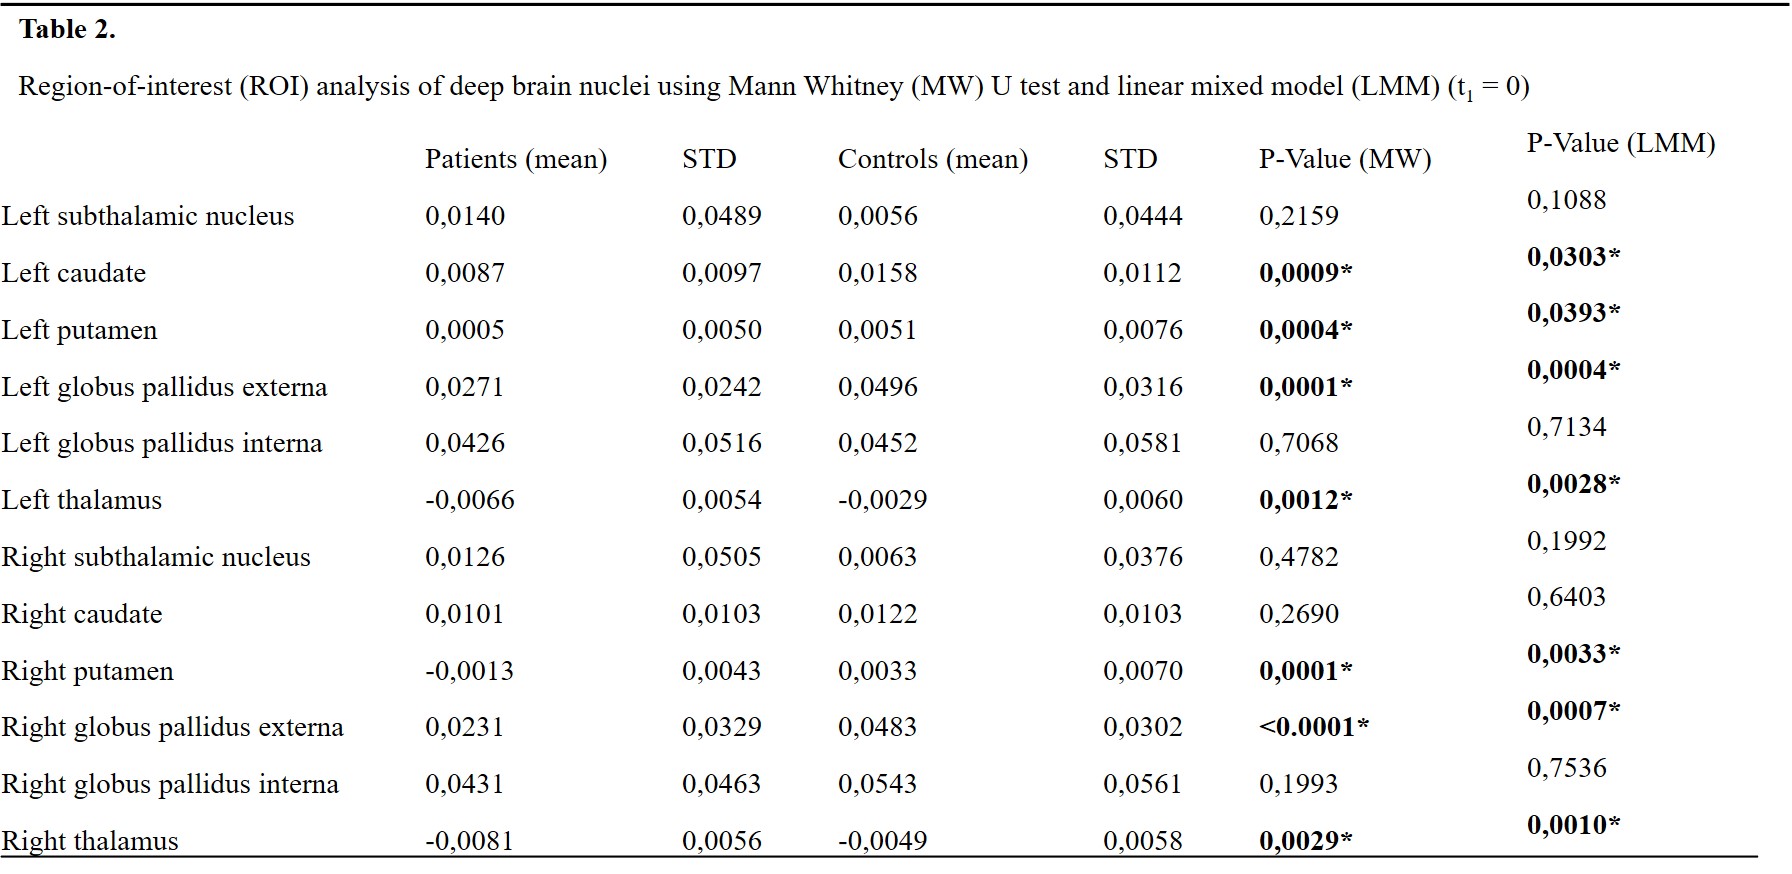
Table 2. Mean QSM values [ppm] and deviation of patients and healthy subjects. P-value obtained to make the Mann-Whitney U Test and linear mixed model test.
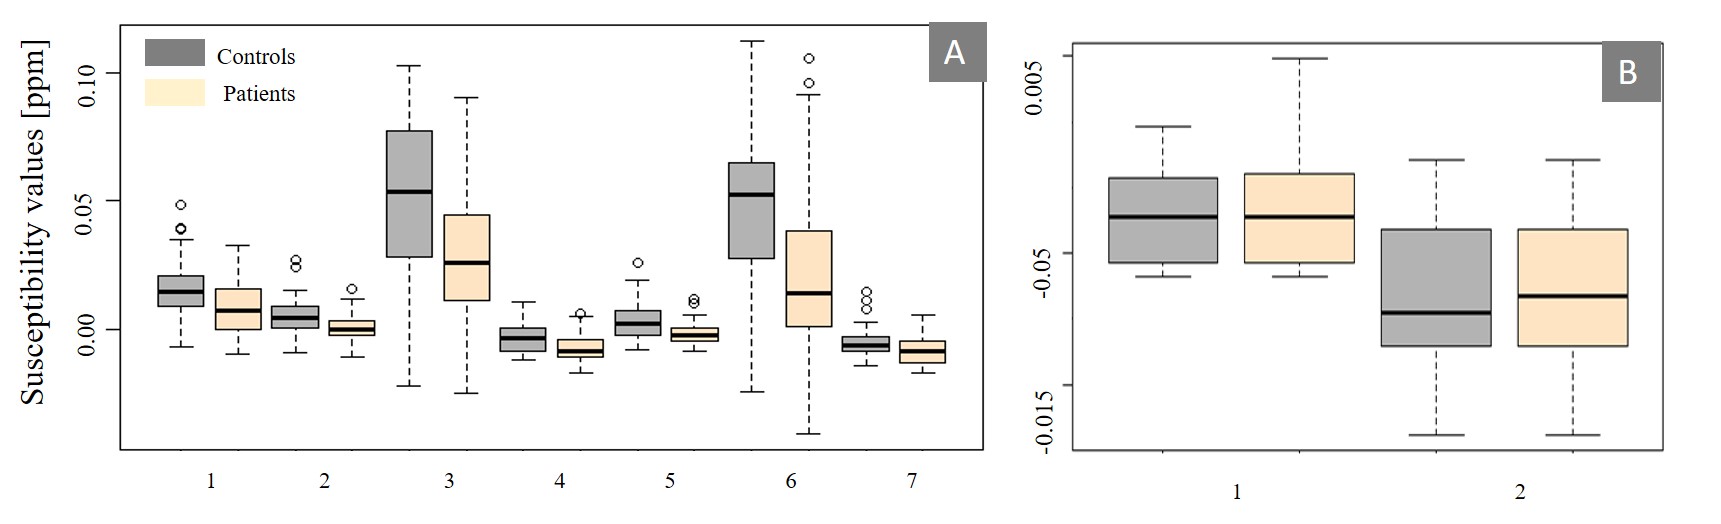
Fig 1: A) Boxplot for distribution of
susceptibility values where we found significant differences using statistical
tests at time t1. 1- Left caudate, 2- Left putamen, 3- Left globus
pallidus externa, 4- Left thalamus, 5- Right putamen, 6- Right globus pallidus
externa, 7-Right thalamus. B) Boxplot
for distribution of susceptibility values where we found significant
differences using statistical tests at time t2. 1- Left putamen, 2- Left thalamus
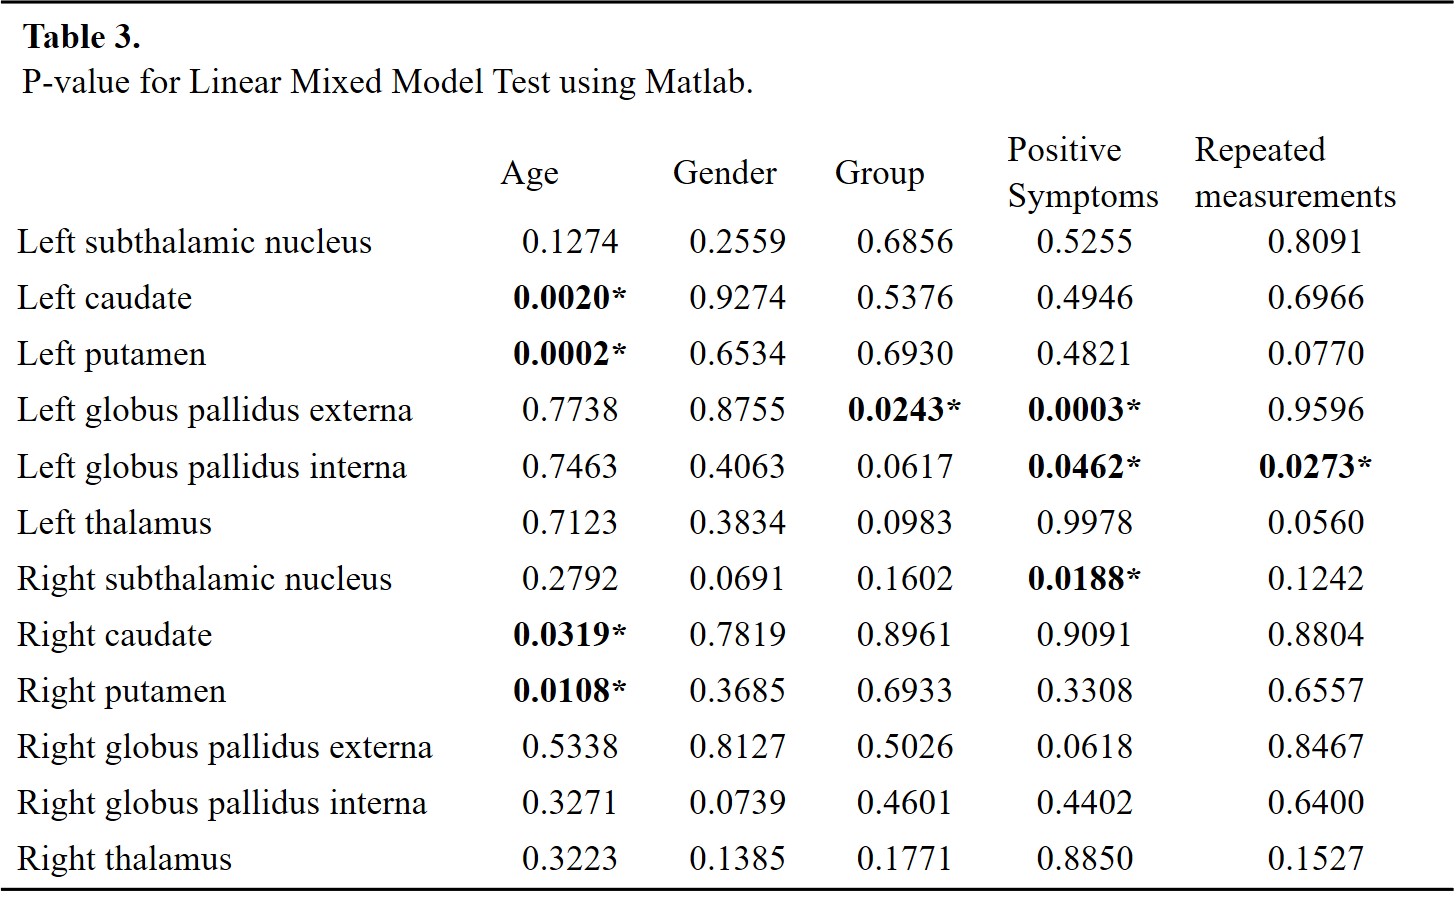
Table 3. Linear Mixed Model Test.
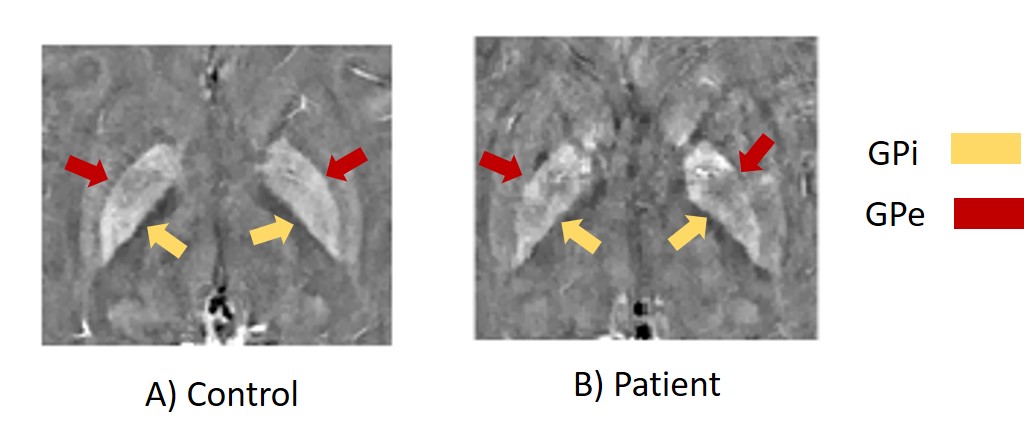
Fig 2: QSM reconstructions
showing significant differences for the Globus Pallidus externa (GPe) and
Globus Pallidus interna (GPi).