0805
Hippocampal Metabolic MR Spectroscopic Imaging Associations with Psychotic and Manic Symptoms in Patients with Schizophrenia1NYU Langone Medical Center, New York, NY, United States, 2Icahn School of Medicine at Mount Sinai, New York, NY, United States
Synopsis
Previous proton MR spectroscopic imaging of the hippocampus distinguished schizophrenia cases from controls by elevated creatine [Cr] and more variable N-acetylaspartate [NAA] and choline [Cho] concentrations. Here we examine these metabolite’s concentrations in 15 cases against their research diagnostic interviews and symptom ratings. Despite modest cohort size we find: (a) elevated [Cho] predicts psychotic; and (b) manic symptoms severity; and (c) lower [NAA] trended with negative symptoms. These findings suggest that microgliosis and demyelination, reflected by reduced [NAA] and elevated [Cho], may be related to active psychotic and manic symptoms, potentially benefiting precision medicine in selection and monitoring schizophrenia treatment.
INTRODUCTION
Clinical features of schizophrenia include psychosis (hallucinations, delusions, disorganization) and decreased emotional expression and avolition (negative symptoms), along with declining function and frequent mood symptoms.1 It is a heterogeneous clinical syndrome, of which different exposures may produce different initiating pathophysiologies.2,3Hippocampal disruption may be a central pathology for psychosis as many of its measures differ between schizophrenia cases and healthy controls, e.g., reduced volume, increased blood flow, impaired task related activation, decreased neurogenesis and reduced connectivity with other regions.4,5 As the disease entails cognitive and attention deficits, effort-independent methods, e.g., MR modalities, especially 3-dimensional proton MR spectroscopic imaging (3D 1H-MRSI), are well suited for its investigations. 1H-MRSI noninvasively yields metabolic markers of several cellular processes, most notably: N-acetylaspartate [NAA] (NAA and N-acetylaspartylglutamate) for neuronal integrity; creatine [Cr] (creatine and phosphocreatine creatine) for energy metabolism; choline [Cho] (choline, phosphocholine and glycerophosphocholine) for membrane turnover and astroglia proliferation; and myo-inositol [mIns] for inflammation and gliosis.6,7
A previous whole hippocampus 3D 1H-MRSI study found only elevated mean [Cr] concentrations and lower volume distinguished schizophrenia cases from healthy controls, consistent with increased energy usage activity.8 There was also significant association of [Cr] with [mIns], consistent with inflammatory hippocampal pathology, as a common pathway for psychosis.9 The same pattern of elevated [Cr] and [mIns] also characterized a group of prodromal subjects who later developed psychosis in the largest such study to date,10 underscoring the importance of this group-wide finding. However, the heterogeneity of schizophrenia cases must be resolved to advance personalized treatments.11
To that end, we considered the [Cho] and [NAA] levels variability that were significantly larger in cases than controls,8 suggesting heterogeneous neurochemistry. Since this may suggest specific disease related processes, this report presents a secondary descriptive analysis of [NAA] and [Cho] variability with respect to the clinical symptoms of these schizophrenia cases.
METHODS
ParticipantsRetrospective 1H-MRSI data from 15 schizophrenia cases and 11 healthy controls,8 was used for these re-analyses against their clinical symptoms. All participants were assessed with the Positive and Negative Syndrome Scale,12 to generate ratings for positive (psychotic), negative (social and emotional deficits) and general psychopathology status.
MR Acquisition and Post-Processing
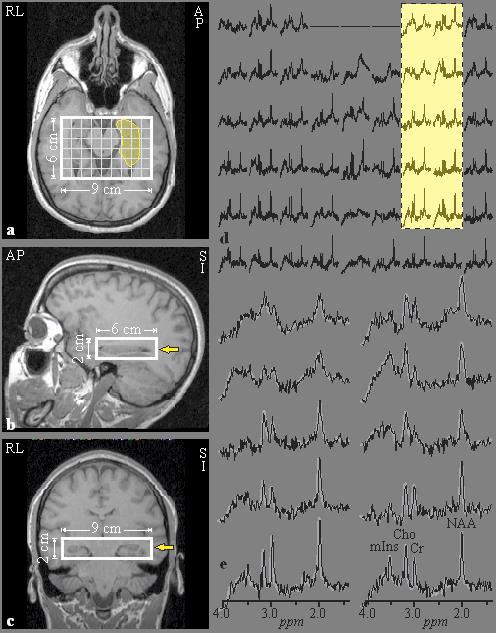
MR acquisition and post-processing was described previously.8 Briefly, the experiments were done in a 3T MRI scanner (Trio, Siemens AG). For tissue segmentation and 1H-MRSI volume of interest (VOI) guidance, T1-weighted, 3D MP-RAGE images were obtained from each subject: TE/TI/TR=2.6/800/1360 ms, 256×256 matrix, 256×256 mm2 field-of-view (FOV), 160 1 mm thick slices, reformatted into sagittal and coronal slices at 1 mm3 isotropic resolution, tilted along the hippocampi axis, as shown in Figure 1a-c. A 6 cm anterior-posterior (AP)×9 cm left-right (LR)×2 cm inferior-superior (IS)=108 cm3 VOI was then image guided over the bilateral hippocampi (Figure 1a-c) and excited with point resolved spectroscopy (PRESS: TE/TR=35/1400 ms), yielding 6×9×4 (AP×LR×IS)=216 voxels, 1.0×1.0×0.5 cm3 each, as shown in Fig 1a-c.13 1H-MRSI data were reconstructed offline using in-house software (Figure 1d): Each voxel’s relative levels of NAA, Cr, Cho and mIns were estimated using spectral modeling,14 as shown in Figure 1e, and scaled into absolute millimolar (mM) concentration with phantom replacement. Bilateral hippocampi masks were manually traced on the MP-RAGE images based on an MRI atlas,15 as shown in Fig. 1a. In-house software estimated CSF- and white-matter partial volume corrected metabolites’ concentrations within the masks.16
RESULTS
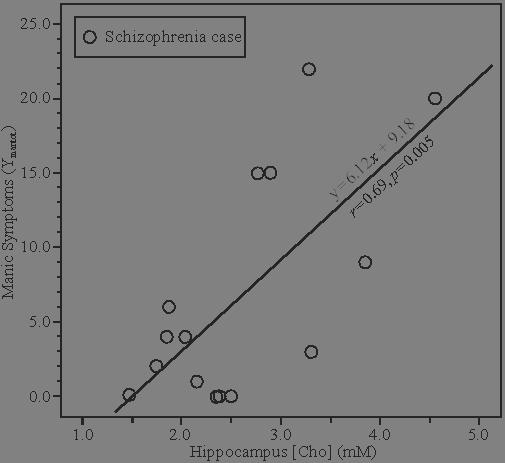
Cases’ Metabolites’ levels were compared with the controls’ [NAA], [Cr], [Cho] and [mIns] means: 8.7±1.2, 7.4±1.2, 2.1±0.4 and 6.1±1.5 mM.8 Only [Cr] distinguished cases from controls groups but did not correlate with any clinical symptoms. [Cho] predicted the cases’ positive (psychotic) symptoms on the PANSS (r=0.59, p=0.021) and manic symptoms of the Young Mania Scale (r=0.69, p=0.005), as shown in Figure 2. There was a trend association of [NAA] with negative symptoms (r=0.48, p=0.08). No symptoms associated with other metabolites.DISCUSSION
This study suggests that different schizophrenia symptoms are predicted by two different hippocampal inflammatory pathologies identified by [Cho] elevations, a marker for demyelination and by reduced [NAA], an indicator of neuronal integrity.Reduced hippocampal [NAA] is consistent with macrocytosis and/or microgliosis, demonstrated in a murine model of HIV-1 encephalitis,17 and consistent with the elevated [Cr], which correlated with elevated [mIns] for the entire group of cases.8 The relationship of [Cho] with the cases’ more severe manic and psychotic symptoms, suggests that the pathological processes associated with their active positive symptoms may entail a myelination disrupting pathology.
The presence of separate hippocampus-related pathologies may help reconcile the diverse findings reported for schizophrenia better than single models that include effects of age or progression of a single pathophysiology.18 Our findings are consistent with a model of increased hippocampal hyperactivation or perfusion,4 and pathology that reduces hippocampal volumes.19 Furthermore, the fact that [Cho], a marker of cell membrane de- and re-myelination, is linked/predicts psychosis severity, support a dysmyelination mechanism in schizophrenia as was suggested by a postmortem study.20
CONCLUSION
Separate hippocampal pathologies consistent with glial activation and demyelination predict different psychiatric symptoms in schizophrenia patients. These preliminary findings, if replicated, also suggest that a patient’s specific 1H-MRSI metrics may be used to select and monitor individually tailored treatments for psychosis and mania.Acknowledgements
No acknowledgement found.References
- American Psychiatric Association., American Psychiatric Association. DSM-5 Task Force. Diagnostic and statistical manual of mental disorders : DSM-5, 5th ed. Washington, D.C.: American Psychiatric Association, 2013.
- Tamminga CA, Pearlson GD, Stan AD, et al. Strategies for advancing disease definition using biomarkers and genetics: the bipolar and schizophrenia network for intermediate phenotypes. Biol Psychiatry Cogn Neurosci Neuroimaging 2017;2:20-27.
- Nenadic I, Gaser C, Sauer H. Heterogeneity of brain structural variation and the structural imaging endophenotypes in schizophrenia. Neuropsychobiology 2012;66:44-49.
- Heckers S, Konradi C. Hippocampal pathology in schizophrenia. Current topics in behavioral neurosciences 2010;4:529-553.
- Haukvik UK, Hartberg CB, Agartz I. Schizophrenia--what does structural MRI show? Tidsskr Nor Laegeforen 2013;133:850-853.
- Mountford CE, Stanwell P, Lin A, Ramadan S, Ross B. Neurospectroscopy: the past, present and future. Chem Rev 2010;110:3060-3086.
- Zhu H, Barker PB. MR spectroscopy and spectroscopic imaging of the brain. Methods Mol Biol 2011;711:203-226.
- Meyer EJ, Kirov, II, Tal A, et al. Metabolic abnormalities in the hippocampus of patients with schizophrenia: a 3D multivoxel MR spectroscopic imaging study at 3T. AJNR Am J Neuroradiol 2016.
- Mazgaj R, Tal A, Goetz R, et al. Hypo-metabolism of the rostral anterior cingulate cortex associated with working memory impairment in 18 cases of schizophrenia. Brain Imaging Behav 2016;10:115-123.
- Bossong MG, Antoniades M, Azis M, et al. Association of hippocampal glutamate levels with adverse outcomes in individuals at clinical high risk for psychosis. JAMA Psychiatry 2019;76:199-207.
- Tognin S, van Hell HH, Merritt K, et al. Towards precision medicine in psychosis: benefits and challenges of multimodal multicenter studies-PSYSCAN: Translating Neuroimaging Findings From Research into Clinical Practice. Schizophr Bull 2019.
- Kay SR, Fiszbein A, Opler LA. The positive and negative syndrome scale (PANSS) for schizophrenia. Schizophr Bull 1987;13:261-276.
- Goelman G, Liu S, Hess D, Gonen O. Optimizing the efficiency of high-field multivoxel spectroscopic imaging by multiplexing in space and time. Magn Reson Med 2006;56:34-40.
- Soher BJ, Young K, Govindaraju V, Maudsley AA. Automated spectral analysis III: application to in vivo proton MR spectroscopy and spectroscopic imaging. Magn Reson Med 1998;40:822-831.
- Oishi K. MRI atlas of human white matter, 2nd ed. Amsterdam: Elsevier/Academic Press, 2011.
- Tal A, Kirov I, Grossman RI, Gonen O. The role of gray and white matter segmentation in quantitative proton MR spectroscopic imaging. NMR Biomed 2012;25:1392-1400.
- Nelson JA, Dou H, Ellison B, et al. Coregistration of quantitative proton magnetic resonance spectroscopic imaging with neuropathological and neurophysiological analyses defines the extent of neuronal impairments in murine human immunodeficiency virus type-1 encephalitis. J Neurosci Res 2005;80:562-575.
- Small SA, Schobel SA, Buxton RB, Witter MP, Barnes CA. A pathophysiological framework of hippocampal dysfunction in ageing and disease. Nat Rev Neurosci 2011;12:585-601.
- Harrisberger F, Smieskova R, Vogler C, et al. Impact of polygenic schizophrenia-related risk and hippocampal volumes on the onset of psychosis. Translational psychiatry 2016;6:e868.
- Hakak Y, Walker JR, Li C, et al. Genome-wide expression analysis reveals dysregulation of myelination-related genes in chronic schizophrenia. Proc Natl Acad Sci U S A 2001;98:4746-4751.
Figures