0796
Aberrant Functional Brain Network Topology for Classification between Major Depressive Disorder and Healthy Controls1Icahn School of Medicine at Mount Sinai, New York, NY, United States
Synopsis
Currently, diagnosis for major depressive disorder (MDD) is largely reliant on self-reported symptoms. The ability to identify MDD without self-report is greatly needed. Implementing a graph-theoretical analysis on resting state fMRI (rsfMRI), we tested whether whole-brain network topology can be used as predictors of MDD using a machine learning algorithm. We found that MDD patients exhibit aberrant network centrality measures within the right hippocampus, supramarginal and parsopercularis. Using these as predictors in a machine learning algorithm we were able to classify MDD and controls with total accuracy of 81%, demonstrating the applicability of rsfMRI for diagnostics of MDD.
Introduction
Major depressive disorder (MDD) is one of the world’s largest health problems1. Currently, the diagnosis entirely depends on clinical symptoms, whereas the underlying brain pathology remains largely unclear. Recently, the mathematical field of graph theory emerged as a tool for characterizing brain network features that can distinguish between healthy and pathological states2-4. The functional brain network graph is composed of nodes, representing regions, and edges, representing connections. Based on graph theory analyses, various studies have reported aberrant topological organization among MDD patients5. Yet, it is currently unclear how these whole-brain network features can be used with data-driven machine learning tools for the classification of MDD. Implementing a graph theoretical analysis based on ultra-high field 7-Tesla functional MRI data, we tested whether whole brain network connectivity hierarchies during resting state can distinguish between MDD patients and controls, and if these can be used as predictors in a machine learning algorithm.Methods
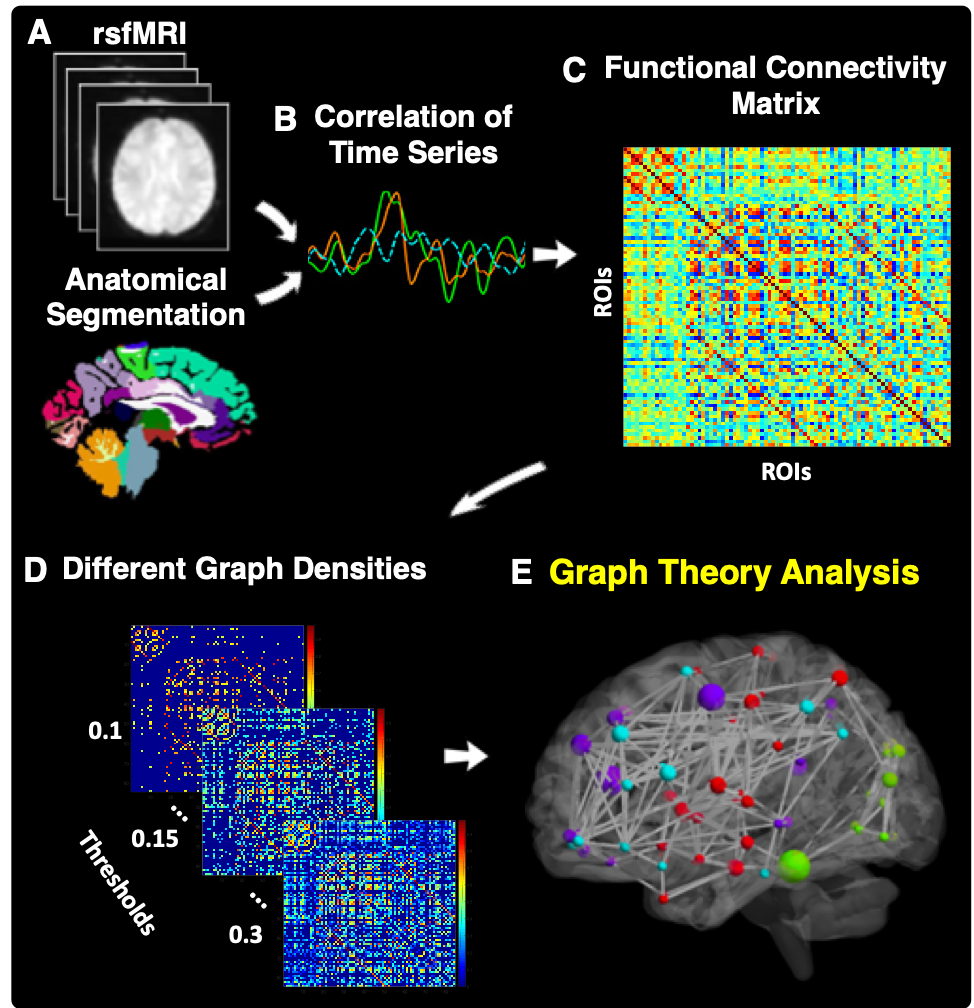
21 MDD patients and 21 controls underwent resting state fMRI. Data were acquired on a Siemens Magnetom 7T MRI scanner (Erlangen, Germany). Functional images were processed using the multi-echo independent component analysis implemented in the AFNI meica.py toolbox6. Each subjects anatomical T1 weighted brain image was segmented into the Desikan-Killiany Atlas7 applied in FreeSurfer. The segmentation resulted in 84 regions of interest each representing a node of the network (Figure 1A). To define the network edges, we calculated the partial correlation coefficients between the regional mean time-series of all pairwise regions (excluding the effects of all other regions) (Figure 1C). To enable comparison across participants, we used a sparsity threshold S, which retains S% of the top connections for each participant (Figure 1D). Using the Brain Connectivity Toolbox8, we examined common local nodal centrality features; 1) node strength, which is the sum of weights of connections to the node (Figure 1E); 2) betweenness centrality, which is a measure of the number of shortest paths that traverse a given node; and 3) local efficiency, which is the efficiency computed on the neighbors of a given node. We examined the network features across a range of thresholds (10% < S < 30% in steps of 1%)9. We then calculated the area under the curve for each network feature, which provides a summarized measure independent of single threshold selection9 (Figure 1F). Then we conducted a between-group t-test for each region's local feature. All results were corrected for multiple comparisons (number of nodes), using false discovery rate (FDR)10. Next, we conducted Pearson correlations to assess the association between the significant results and disease duration and severity among the MDD patients. Partial correlation was used to control for age, gender and region volume as covariates. Quadratic discriminant analysis (QDA)11 was used for between group classification using Matlab Classification Learner application (The MathWorks Inc., Natick, MA). All the statistically significant network features were used as predictors for the machine learning classification. We then assessed the generalization ability through fivefold cross-validation. For statistical significance 1,000 repetitions were performed and then for permutation tests another 1000 repetitions of shuffled datasets. The overall accuracy, sensitivity, specificity, and positive predictive value (PPV) were computed for each classifier.Results
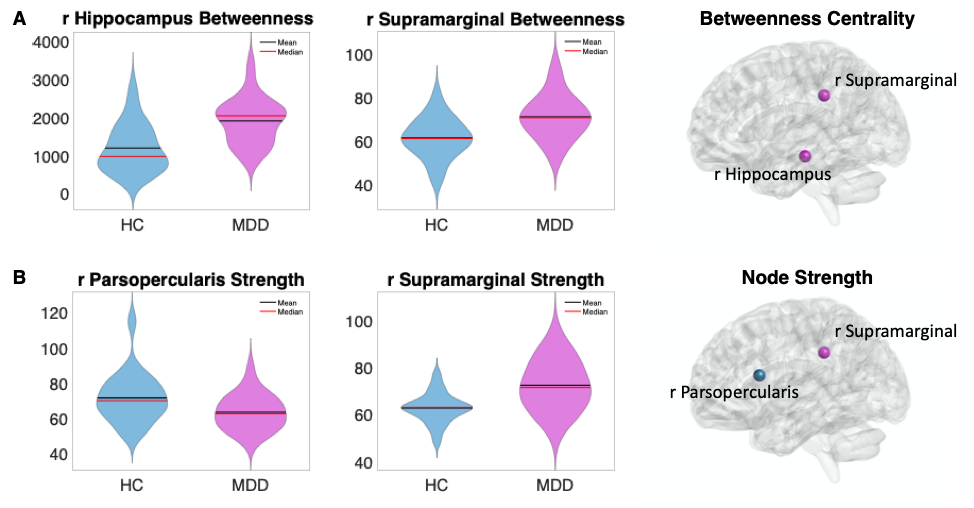
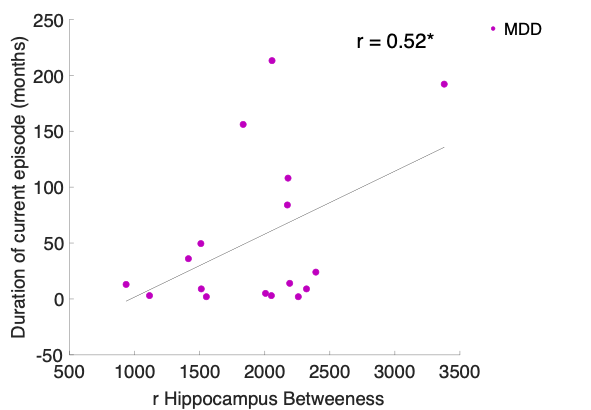
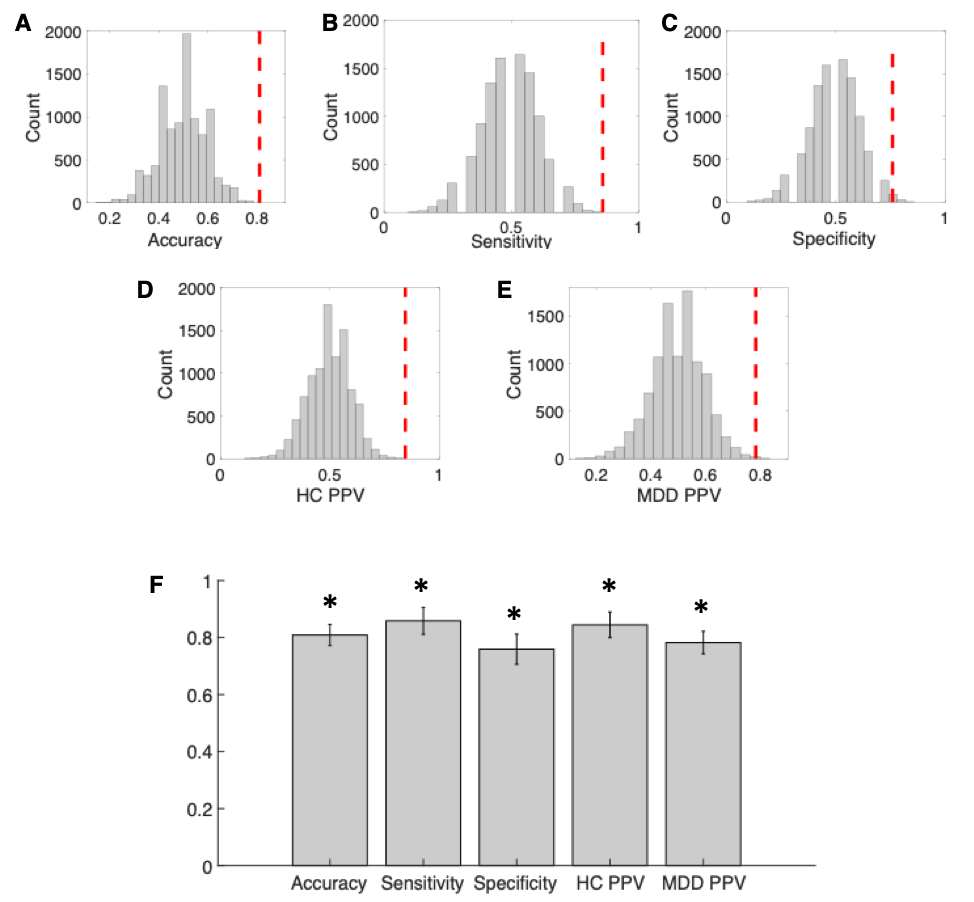
The results revealed that compared to controls, MDD patients exhibited both increased and decreased centrality measures. Specifically, there was increased betweenness centrality within the right hippocampus (t=4.45, p<0.00008) and right supramarginal (t=2.99, p<0.001), which also presented increased node strength (t=3.39, p<0.001). There was decreased node strength of the right parsopercularis (t=3.25, p<0.001). All were qFDR<0.05 corrected (Figure 2). The right hippocampus also showed a significant association with the duration of the current episode showing, whereby the higher the betweenness centrality, the longer is the depressive episode (r=0.52, p<0.04) (Figure 3). The machine learning QDA algorithm using the significant network feature values (right parsopercularis strength, right supramarginal strength and betweenness, and right hippocampus betweenness, total of 4 features) revealed significant classification power (Figure 4). The overall accuracy was 81% (0.81 ± 0.037, p<0.001), with sensitivity of 86% (0.86 ± 0.047, p<0.001) and specificity of 76% (0.76 ± 0.053, p<0.02). The PPV for the MDD were 84% (0.84 ± 0.045, p<0.001) and for the controls, 78% (0.78 ± 0.039, p<0.01).Discussion
Our results showed that the MDD patients exhibit aberrant network topology as compared to controls during resting state. We also showed that the longer the duration of the depressive episode, the higher the patients’ right hippocampus betweenness centrality. Increased betweenness centrality indicates the enhanced rapid information flow through the hippocampus, which might imply of a maladaptive functional behavior of the network. These results replicate previous studies5,12. Furthermore, using these results as predictors in a machine learning algorithm we were able to classify MDD versus controls with total accuracy of 81%. This result demonstrates the applicability of rsfMRI for the diagnostics of MDD. Further research is needed to replicate this finding and improve the generalization and predictive capacity for robust clinical translation.Acknowledgements
Funding was provided by NIH R01 MH109544. Additional support was provided by the Icahn School of Medicine Capital Campaign, Translational and Molecular Imaging Institute and Department of Radiology, Icahn School of Medicine at Mount Sinai and Siemens Healthcare.References
1. Collins, Pamela Y., et al. "Grand challenges in global mental health." Nature 475.7354 (2011): 27.
2. Bassett, Danielle S., et al. "Hierarchical organization of human cortical networks in health and schizophrenia." Journal of Neuroscience 28.37 (2008): 9239-9248.
3. Bullmore, Ed, and Olaf Sporns. "Complex brain networks: graph theoretical analysis of structural and functional systems." Nature reviews neuroscience 10.3 (2009): 186.
4. Sporns, Olaf. Networks of the Brain. MIT press, 2010.
5. Gong, Qiyong, and Yong He. "Depression, neuroimaging and connectomics: a selective overview." Biological psychiatry 77.3 (2015): 223-235.
6. Kundu, Prantik, et al. "Differentiating BOLD and non-BOLD signals in fMRI time series using multi-echo EPI." Neuroimage 60.3 (2012): 1759-1770.
7. Desikan, Rahul S., et al. "An automated labeling system for subdividing the human cerebral cortex on MRI scans into gyral based regions of interest." Neuroimage 31.3 (2006): 968-980.
8. Rubinov, Mikail, and Olaf Sporns. "Complex network measures of brain connectivity: uses and interpretations." Neuroimage 52.3 (2010): 1059-1069.
9. Korgaonkar, Mayuresh S., et al. "Abnormal structural networks characterize major depressive disorder: a connectome analysis." Biological psychiatry 76.7 (2014): 567-574.
10. Benjamini, Yoav, and Yosef Hochberg. "Controlling the false discovery rate: a practical and powerful approach to multiple testing." Journal of the Royal statistical society: series B (Methodological) 57.1 (1995): 289-300.
11. Zhang, Michael Q. "Identification of protein coding regions in the human genome by quadratic discriminant analysis." Proceedings of the National Academy of Sciences 94.2 (1997): 565-568.
12. Zhang, Junran, et al. "Disrupted brain connectivity networks in drug-naive, first-episode major depressive disorder." Biological psychiatry 70.4 (2011): 334-342.
Figures