0794
Clustering analysis differentiates clinical subtypes of major depressive disorder that identify symptom-specific brain connectivity1Huaxi MR Research Center (HMRRC), Functional and molecular imaging Key Laboratory of Sichuan Province, Department of Radiology, West China Hospital, Sichuan University, Chengdu 610041, China, Chengdu, China, 2Department of psychiatry, West China Hospital, Sichuan University, Chengdu 610041, China, Chengdu, China
Synopsis
Functional connectivity/network analyses using fMRI data have been applied to characterize diagnostic biomarkers in MDD. However, the association between brain connection and dimensional symptoms of this heterogeneous syndrome still remains unclear. In this work, we focused on first-episode and unmedicated MDD patients, firstly using unsupervised clustering analysis differentiated them into two subgroups on the basis of clinical features. Also, we compared the brain connectivity among subgroups plus healthy people. Then we used multivariate methods identified which clinical symptoms are significantly influenced by which brain connectivity. Our results may provide neurobiological mechanisms of MDD symptoms and serve as effective diagnostic biomarkers.
Introduction
Major depressive disorder (MDD) is a heterogeneous syndrome with different etiology and pathogenesis. The symptoms and severity vary across individuals and different stages of MDD, which allows multiple unique combinations of changes in mood, somatization, appetite, cognition, sleep, and motor activity function. Functional connectivity (FC)/network analyses using fMRI data have been widely used to characterize MDD subtypes from such remarkable heterogeneity and develop diagnostic biomarkers 1-3. However, the association between brain connection and dimensional symptoms of MDD remains unclear and the effects of medication, recurrence or comorbidity with other psychological disorders limited its generalization 4. Hence, we recruited only first-episode and unmedicated MDD (FED) subjects, using unsupervised clustering and multivariate methods simultaneously to differentiate patients on the basis of clinical features, and to examine relationships among brain connectivity and factor-level clinical assessments.Methods
127 clinician-diagnosed FED subjects and 131 healthy controls (HC) were included in this work. T1-weighted and resting-state fMRI data were acquired using a 3 Tesla Siemens scanner.1. Hierarchical k-means clustering (H-K-means)
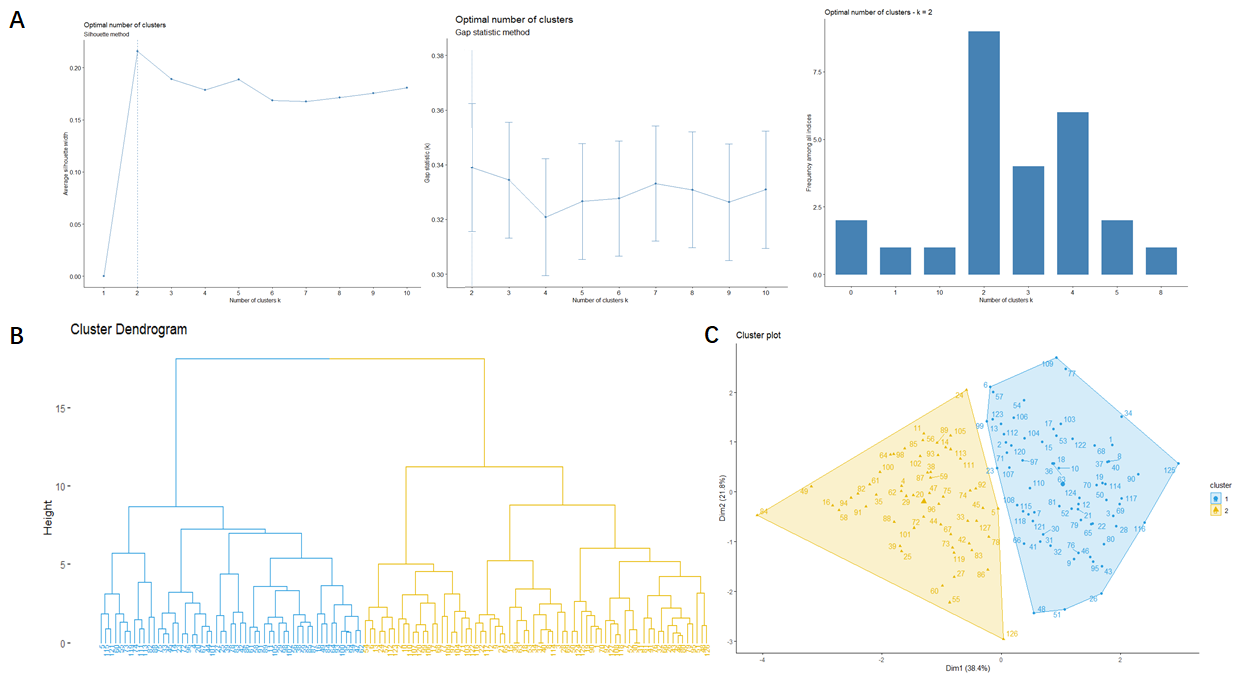
We first use the H-K-means clustering, an hybrid method combining hierarchical clustering and k-means algorithm, to group the 127 FED subjects into homogeneous variable subgroups based on five factor-level clinical scores (anxiety-related, weight loss, cognitive-disturbance, insomnia and retardation). We evaluated the dendrogram from two to ten cluster based on following indices: average silhouette width, gap statistics with 1000 bootstrap replications, and other 30 indices.
2. Whole-brain FC construction
We applied standard preprocessing procedures on resting-state fMRI data which included slice-timing, motion correction, co-registration with T1 images, segmentation and normalization, filtering, detrending and smoothing. We used the FSL Harvard-Oxford cortical and subcortical atlas and AAL cerebellar atlas to partition the brain of each subject into 132 regions of interest (ROI). Whole-brain FC was calculated between all pairs of ROIs, FC matrixes were constructed for each subgroup of FED patients and HC group. For selecting a subset of relevant, non-redundant connectivity features, we reasoned that the different FC patterns between FED subgroups would be clinically relevant. Then statistical comparisons of whole-brain FC between FED subgroups were performed using a significance level of P < 0.05 with age and gender as covariates and FDR correction was used to control multiple comparisons. The values of FC patterns showing subgroup-difference were extracted from all subjects for subsequent multivariate analyses. We also performed ANOVA and post-hoc t test in those extracted values among FED subgroups and HC to explore whether the clinically featured FC patterns were different between FED and HC.
3. Partial Least Square Regression (PLSR) analysis
To determine which FC features were most related to each clinical factor, we used a PLSR model with the defined FC features as X (predictors) and each factor scores as Y (responses). In the first-pass analysis, we ran a PLSR model using 10-fold cross-validation to determine the optimal number of components. In the second-pass, we use the number of components determined to construct the final PLSR model, and get the regression equation and coefficient for each Y and X. Finally, we test the significance of each coefficient to see which predictors significantly contributed to each response.
Results
1. H-K-means clusteringAll indices suggested the optimal number of clusters was two (Fig. 1A). So we discrete the FED patients into subgroup1 and subgroup2 with 71 and 56 subjects respectively according to the H-K-means results. The dendrogram and cluster map were shown in Fig. 1B and 1C, respectively.
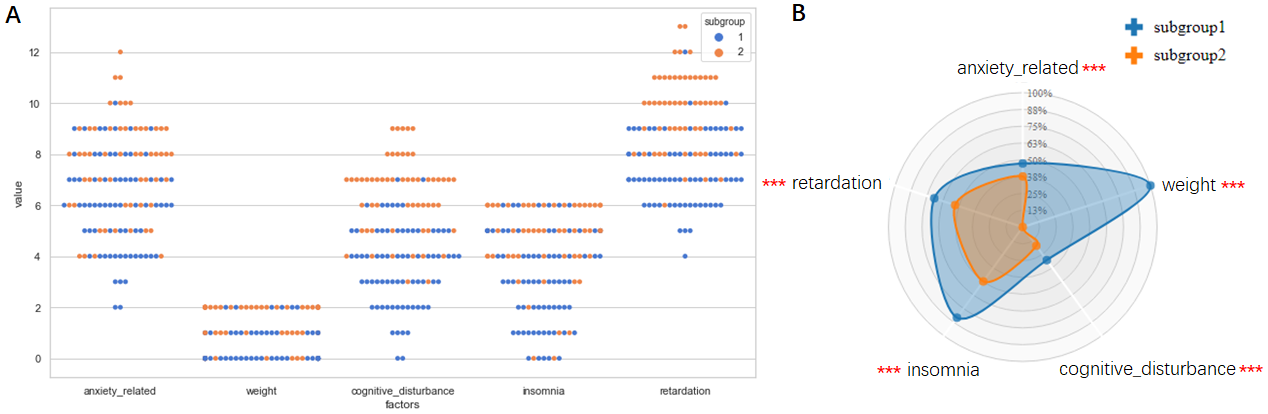
The categorical scatterplot and Radar plot of each clinical-factor of subgroup1 and subgroup2 were shown in Fig. 2A and Fig. 2B for visualization.
2. Whole-brain FC models
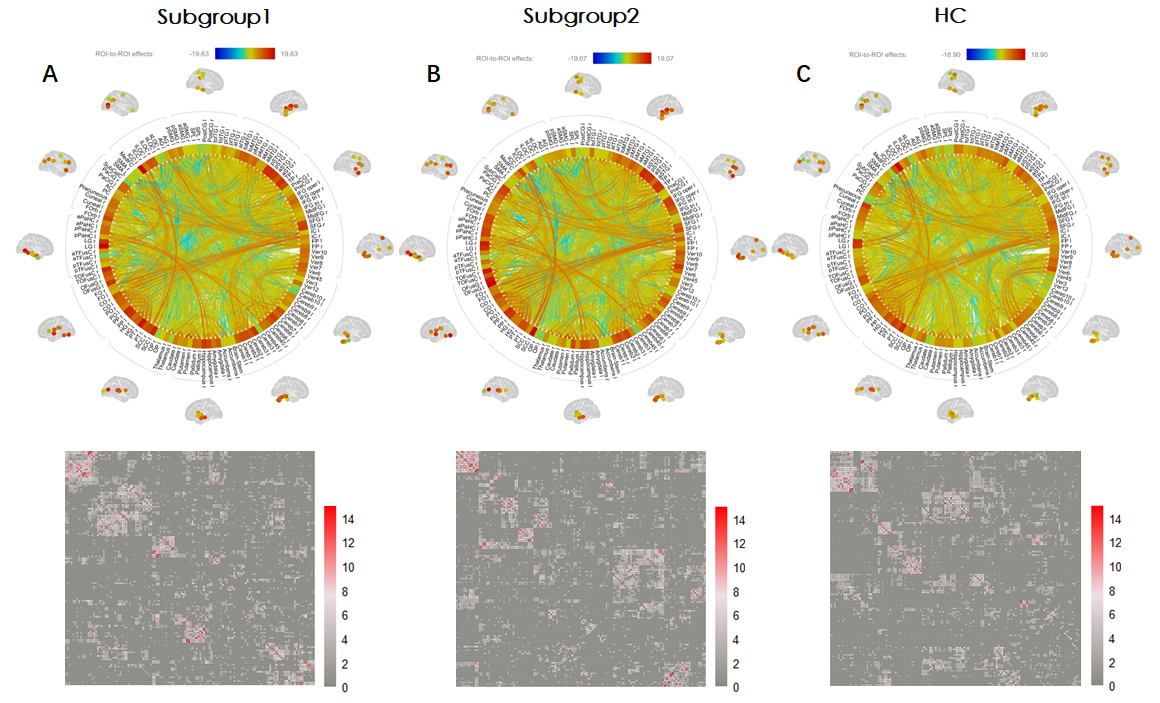
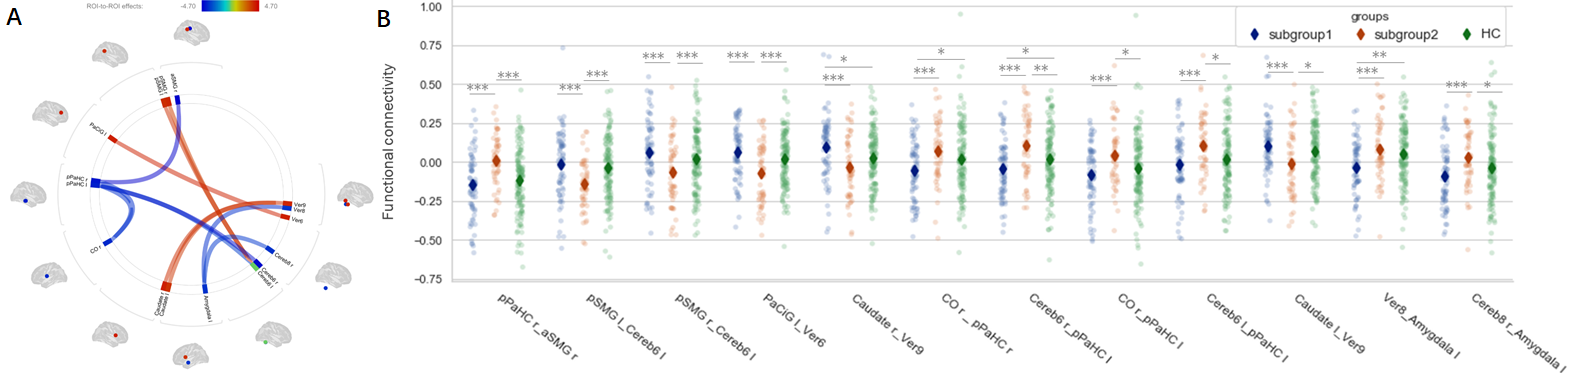
The whole-brain FC connectome rings and matrixes for subgroup1, subgroup2 and HC were shown in Fig. 3A, 3B, and 3C respectively. The FC patterns of subgroup difference were illustrated as a connectome ring in Fig. 4A. Comparing to subgroup2, subgroup1 shows increased FC between vermis-6 and bilateral caudate, between the left cerebellum-6 and bilateral posterior supplementary motor gyrus (pSMG) and between vermis-6 and the left Para cingulate gyrus (PaCiG). Subgroup1 also shows decreased FC between bilateral posterior Para hippocampus and the right anterior SMG, and between the left amygdala and vermis-8/the right cerebellum-8. Besides, these FC patterns in subgroup1 or subgroup2 were also significant different from HC group, shown as point-plot in Fig. 4B.
3. PLSR
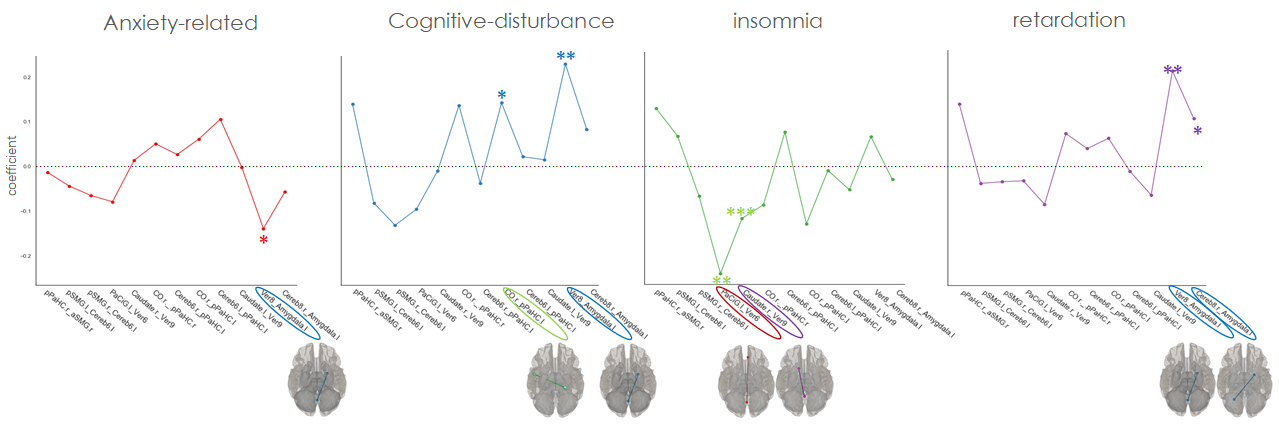
The PLSR results and test for significance of each coefficient (Fig. 5) showed that the FC between the left amygdala and cerebellum/vermis has significant negative impact on anxiety-related factor but has significant positive influence on cognitive-disturbance and retardation factors. The left pPaHC to the right central opercula (CO) FC also has positive influence on cognitive-disturbance, while the insomnia factor was negatively influenced by PaCiG/caudate-vermis FC.
Discussion
The diagnostic system assigns a single label to a clinical heterogeneous syndrome makes it more difficult to understand the pathophysiology of MDD and develop targeted treatment. By clustering and multivariate analyses, we defined clinically-differential FED subgroups and shown the association of how clinical symptoms are significantly influenced by certain brain connectivity.Conclusion
The specific brain connections that potentially contributed to different clinical profiles might provide neuroimaging biomarkers that can transcend conventional diagnostic boundaries.Acknowledgements
This study was supported by National Nature Science Foundation (Grant NO. 81671669), Science and Technology Project of Sichuan Province (Grant NO. 2017JQ0001)References
1. Drysdale AT, Grosenick L, Downar J, et al. Resting-state connectivity biomarkers define neurophysiological subtypes of depression. Nat Med. 2017; 23(1):28-38
2. Insel TR, Cuthbert BN. Medicine. Brain disorders? Precisely. Science. 2015;348(6234):499-500
3. Yu M, Linn KA, Shinohara RT, et al. Childhood trauma history is linked to abnormal brain connectivity in major depression. Proc Natl Acad Sci U S A. 2019;116(17):8582-8590
4. Otte C, et al. Major depressive disorder. Nat Rev Dis Primers. 2016; 2:16065.
Figures