0791
Quantifying the underestimation of myocardial extra cellular volume fraction measurements due to transcytolemmal water exchange1CMR Unit, The Royal Brompton Hospital, London, United Kingdom, 2National Heart and Lung Institute, Imperial College London, London, United Kingdom
Synopsis
MR based measures of myocardial extra cellular volume fraction (ECV) obtained from pre and post-contrast T1 mapping are frequently used in research studies. However, typically ECV calculations rely on rapid exchange of water molecules between the intra and extracellular space. We assess the validity of the shutter speed approximation of the full two-compartment model and use this model to assess the effect of limited water exchange rate between the cardiomyocytes and interstitial fluid. For typical conditions used in measuring ECV, we demonstrate an underestimation of ECV on a similar magnitude to the changes attributed to disease in some studies.
Introduction
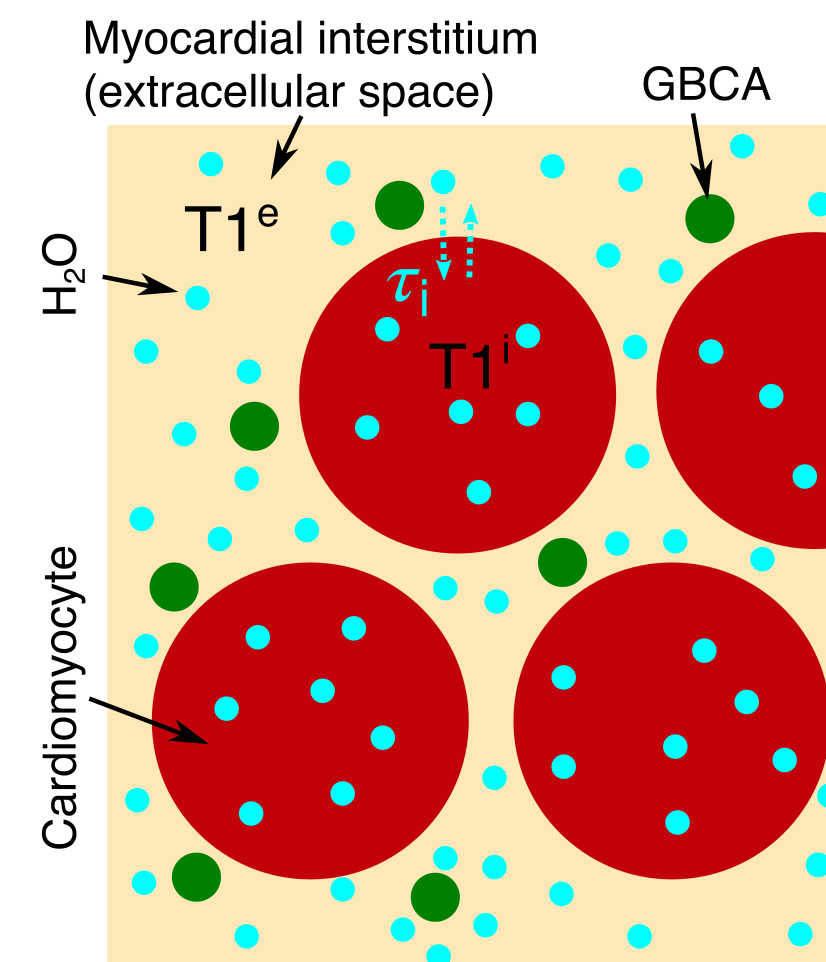
Myocardial extracellular volume fraction (ECV) measurement based on T1 mapping pre and post-administration of extracellular gadolinium-based contrast agent (GBCA) is a well-established method1. Such methods use the change in blood and myocardial T1, with blood cellular volume fraction (haematocrit, Hct) and the assumption of equilibration of myocardial interstitial fluid (MIF) and blood plasma GBCA concentration2. However, one frequently acknowledged, but rarely studied limitation is the finite lifetime of water molecules in the intracellular space (τi) due to cardiomyocyte volume and the finite membrane permeability – surface area product3. Here we estimate errors in ECV measures due to finite τi using the shutter-speed approximation of the two-compartment model4.Methods
We initially determine the validity of the shutter-speed model in myocardium.A tissue containing two exchanging compartments (figure 1) with T1s (in the absence of exchange) T1e and T1i, demonstrates bi-exponential recovery of image intensity, S, according to:
$$S=S_0∙[a⋅f(t,T1^a )+b⋅f(t,T1^b )] (1)$$
where S0 is the initial signal intensity and:
$$f(t,T1^{a/b} )=1-2∙e^{\frac{-t}{T1^{a/b}}} (2)$$
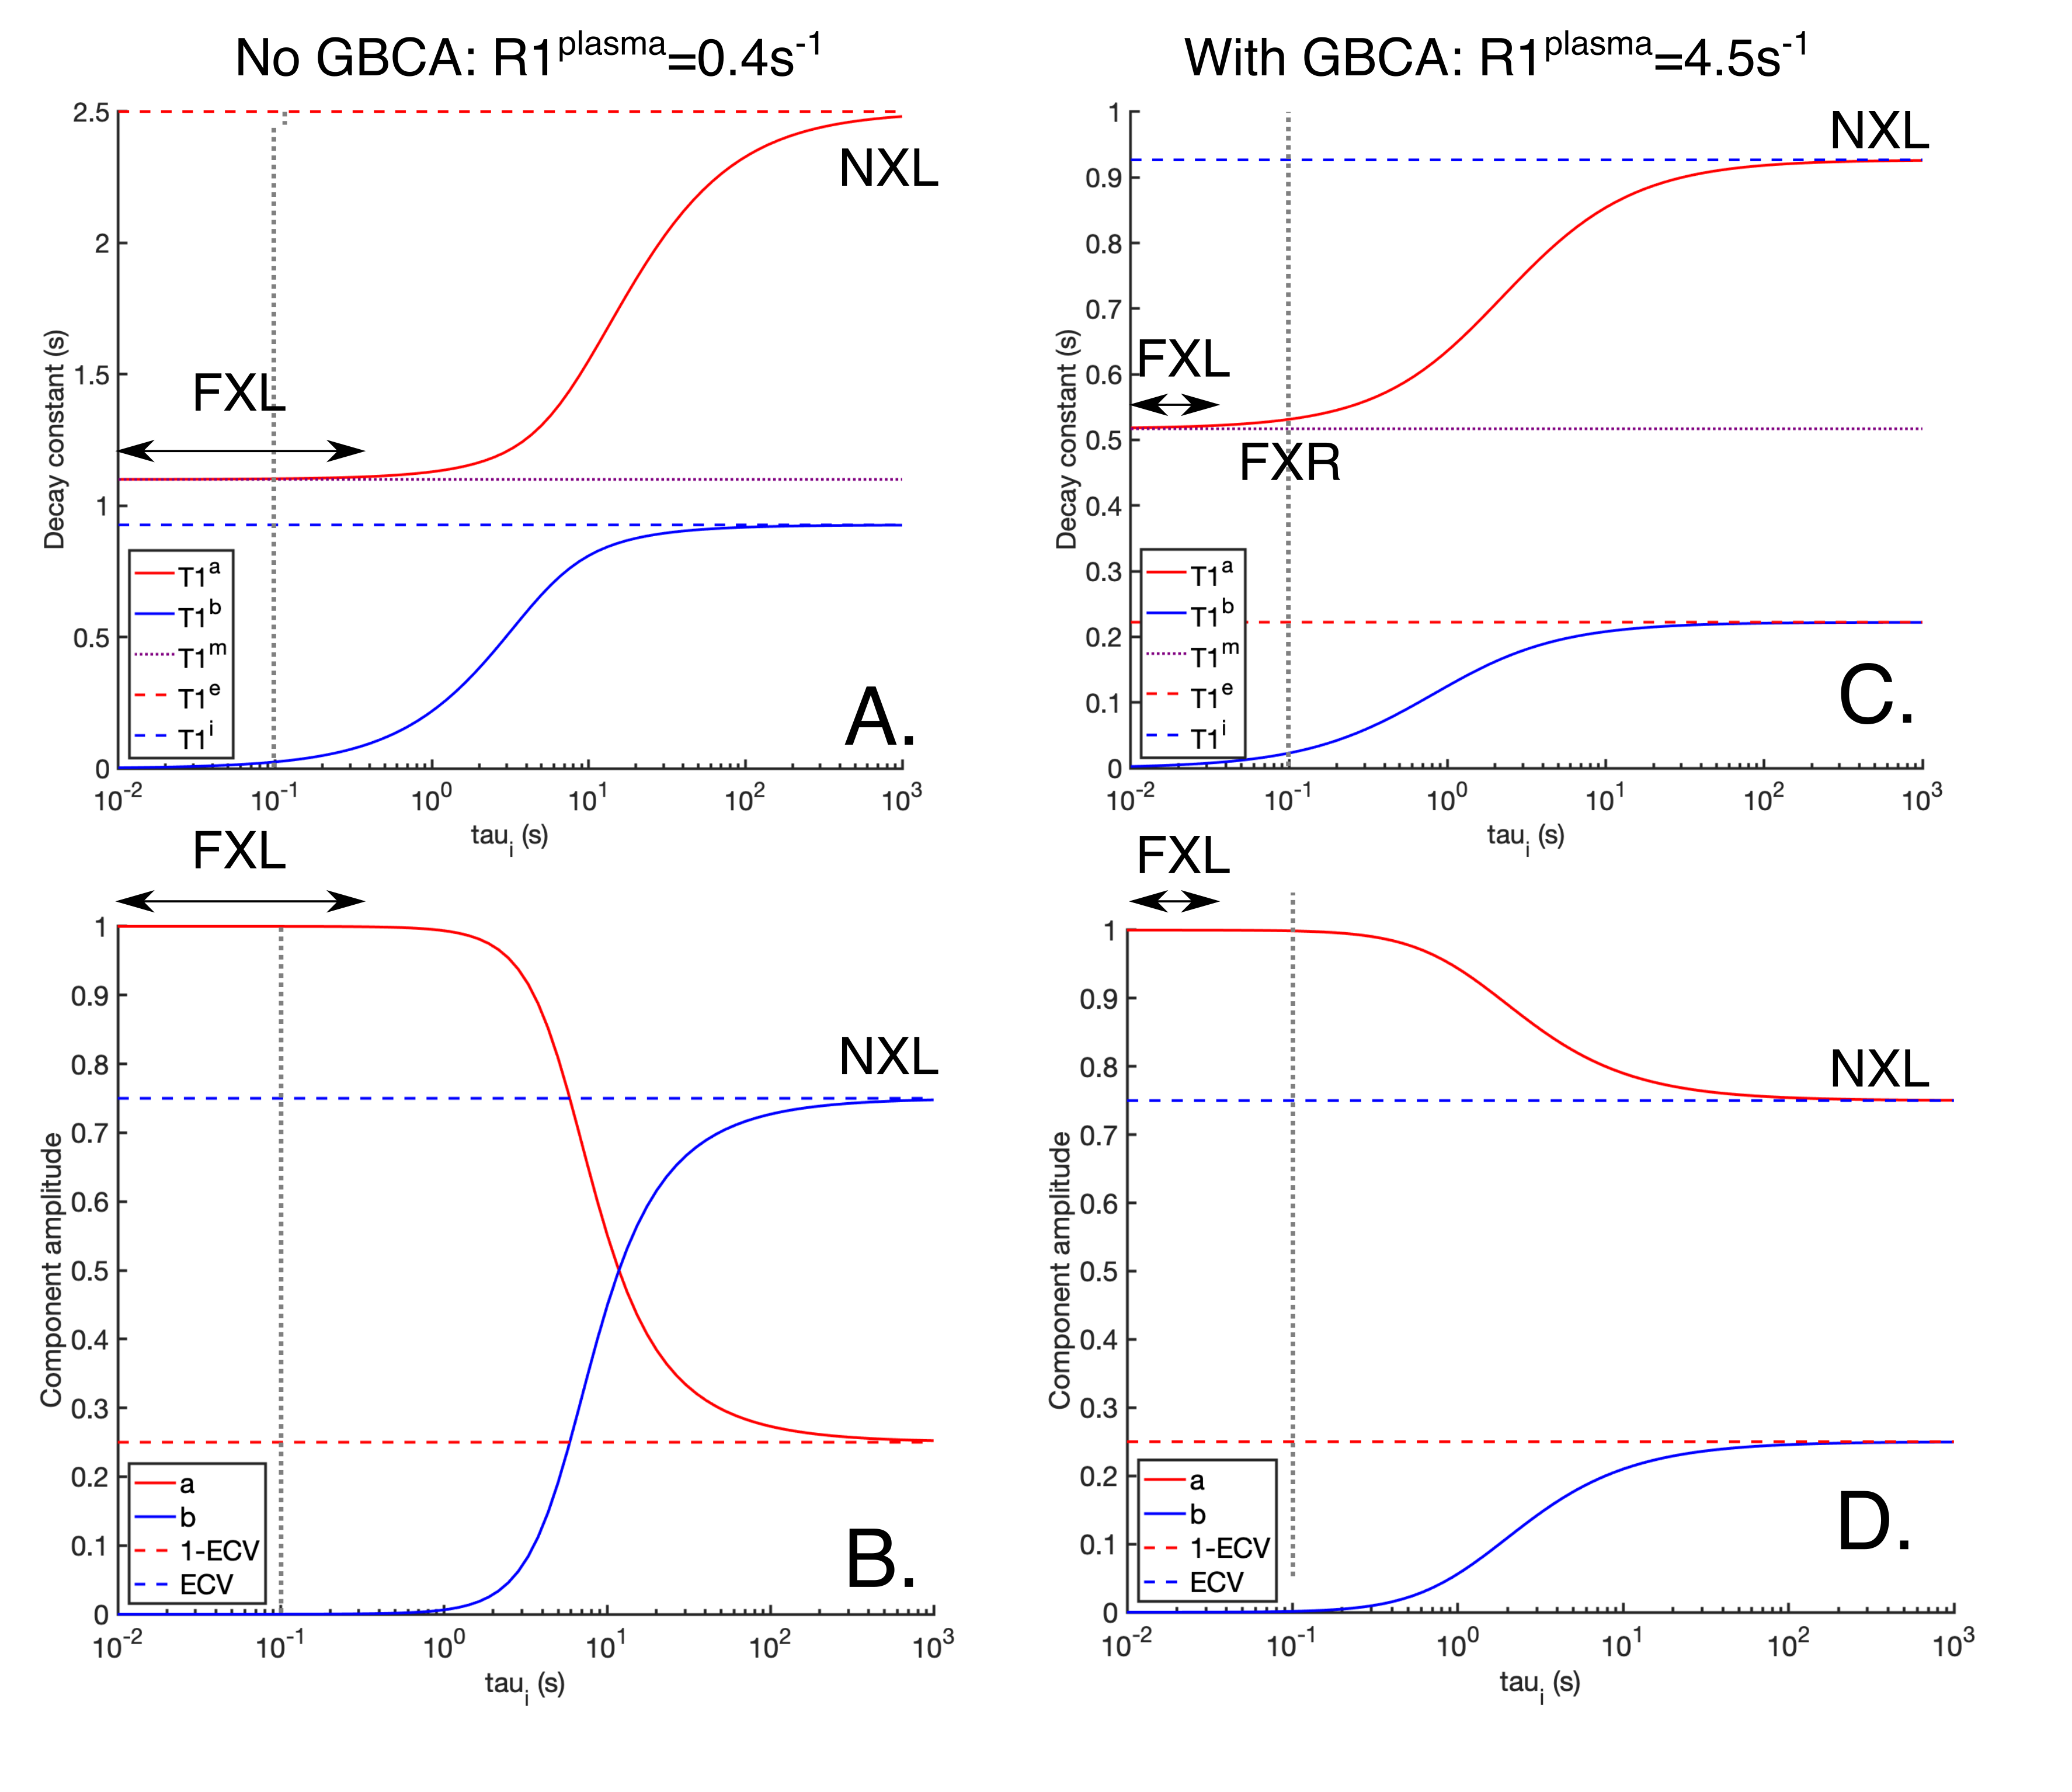
for an inversion recovery sequence, where t is the inversion time. T1a and T1b are the measurable T1s. For very fast exchange between the compartments (small cells, high membrane permeability/surface area, short τi, known as the fast exchange limit (FXL)), one of a and b is negligible and the apparent relaxation time (T1m) is the population weighted average of T1i and T1e:
$$\frac{1}{T1^m} =\frac{ECV}{T1^e} +\frac{1-ECV}{T1^i} (3)$$
When there is no exchange (the no exchange limit, NXL, long τi), a and b are the relative intra and extracellular populations (a+b=1) and T1a and T1b are equal to T1e and T1i. In the intermediate regime, a, b, T1a and T1b depend on τi via the more complex two-compartment exchange model5. However, in the fast exchange regime (FXR, τi(FXR) > τi(FXL)) or shutter-speed model, the smaller component of a or b is negligible, but there is a measurable change in the apparent T1.
We assume FXL in blood (erythrocytes high surface area to volume ratio, therefore short τi). Pintaske et al.6 measured native plasma R1 (1/T1) R1plasma pre=0.4±0.1s-1 at 3T. As blood plasma and MIF are both extracellular fluids, we assume R1plasma pre=R1MIF pre. Using a pre-contrast, whole myocardium R1myo pre=0.91s-1 7, myocardial ECV=25% and equation 1 (i.e. FXL without GBCA), gives R1i (=1/T1i)=1.08s-1 in cardiomyocytes.
Based on R1plasma pre=0.4s-1, Hct=0.4 and pre-contrast blood R1blood pre=0.625s-1 8, gives erythrocytes R1RBC=0.96s-1. A GBCA dose of 0.2mmol kg-1 with a relaxivity of 4.5 Lmmol-1s-1 6 distributed throughout a 70kg man (plasma volume 3L9 and total interstitial volume 5x plasma10) gives R1blood post=3.1s-1 and R1plasma post=4.5s-1.
Using these values we simulated the two-compartment exchange model to test the validity of the shutter-speed model. We therefore used the shutter-speed model (FXR) to estimate the error in ECV (calculated assuming FXL between cardiomyocytes and MIF) due to transcytolemmal water exchange. Using the FXL approximation and assuming equal plasma and MIF GBCA concentration, ECV is:
$$\frac{ECV}{1-Hct}=\frac{R1^{myo post}-R1^{myo pre}}{R1^{blood post}-R1^{blood pre}} (4)$$
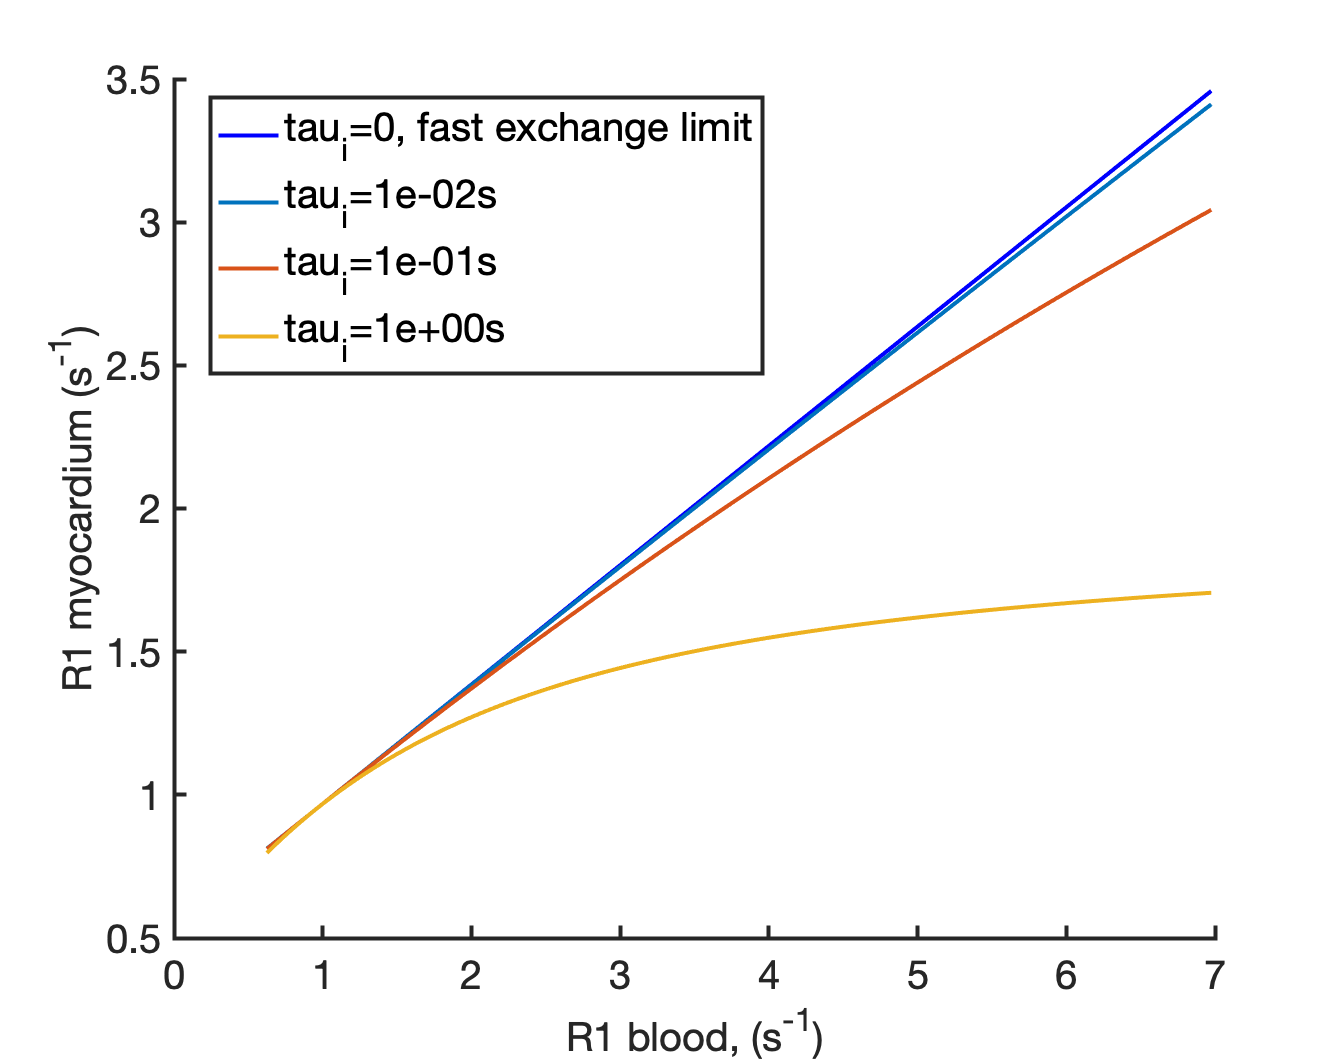
The myocardial R1myo post is therefore linearly related to the blood R1blood post in FXL. We simulated R1myo post for variable GBCA concentrations (R1blood post) using the shutter-speed model to investigate the deviation of R1myo post from the FXL. Using the simulated exchange modified R1myo post and R1blood post we calculated the ECV that would be obtained using equation 4, as typically employed in ECV studies.
Results
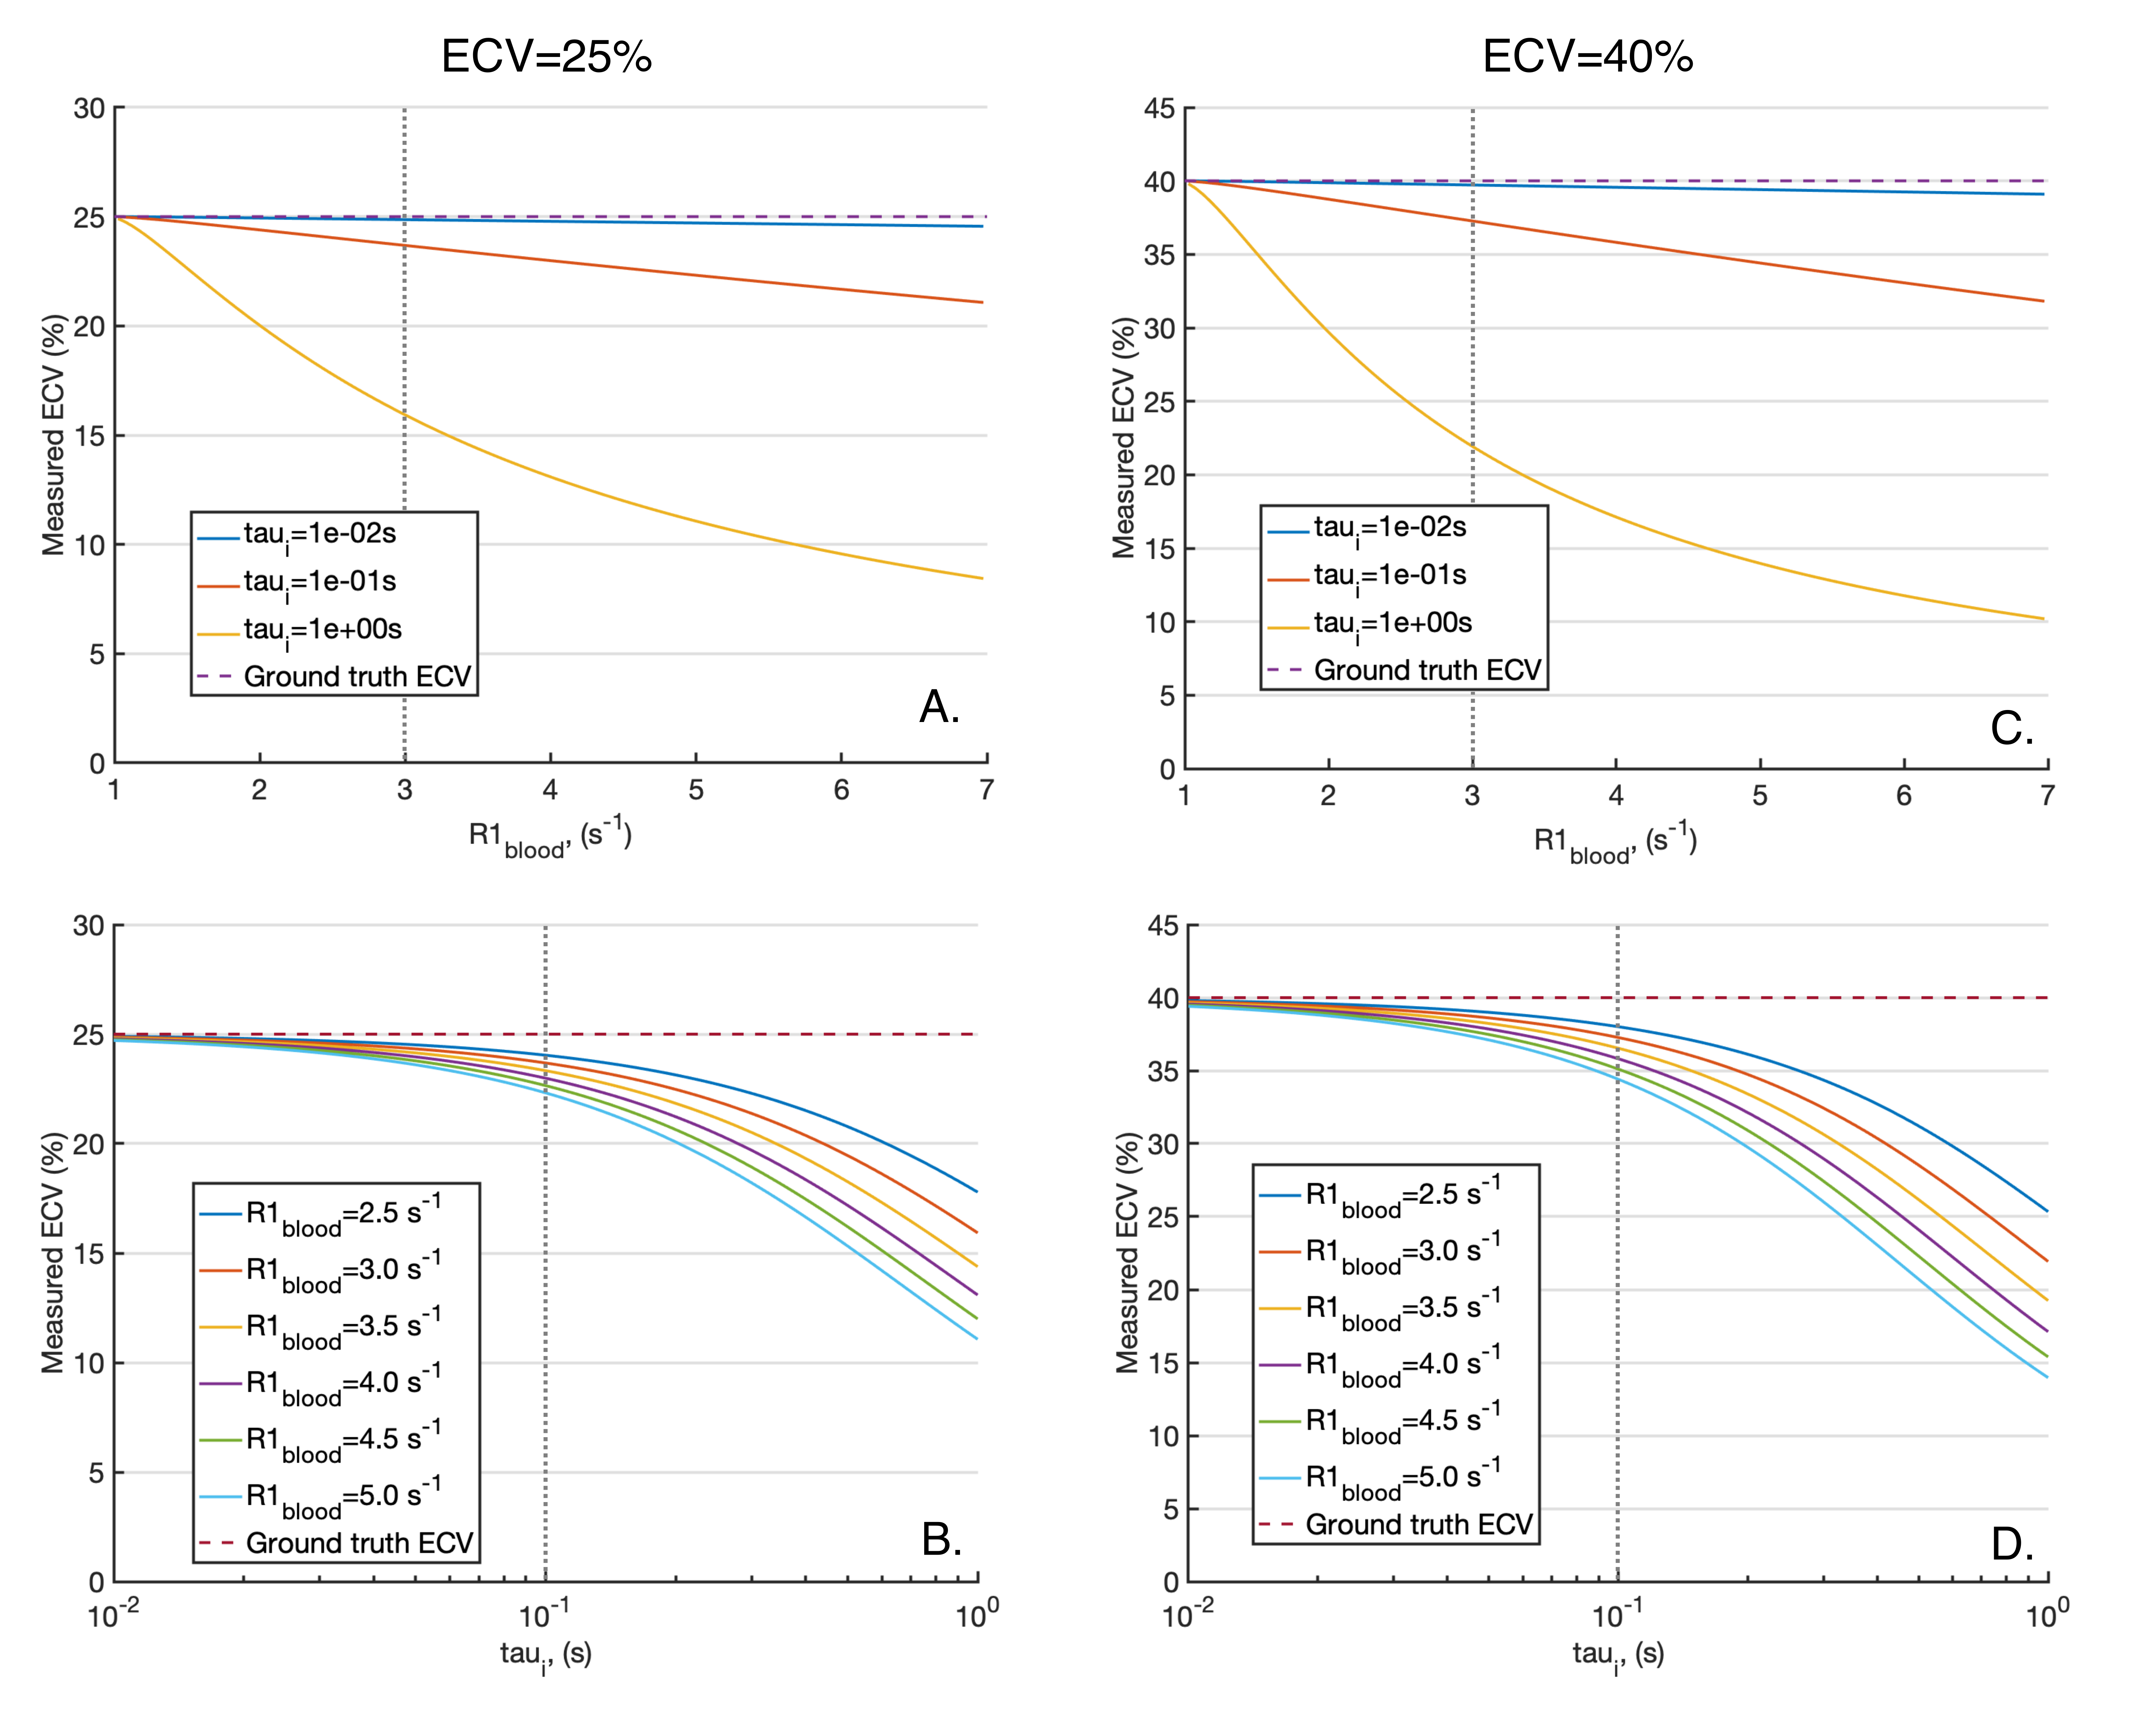
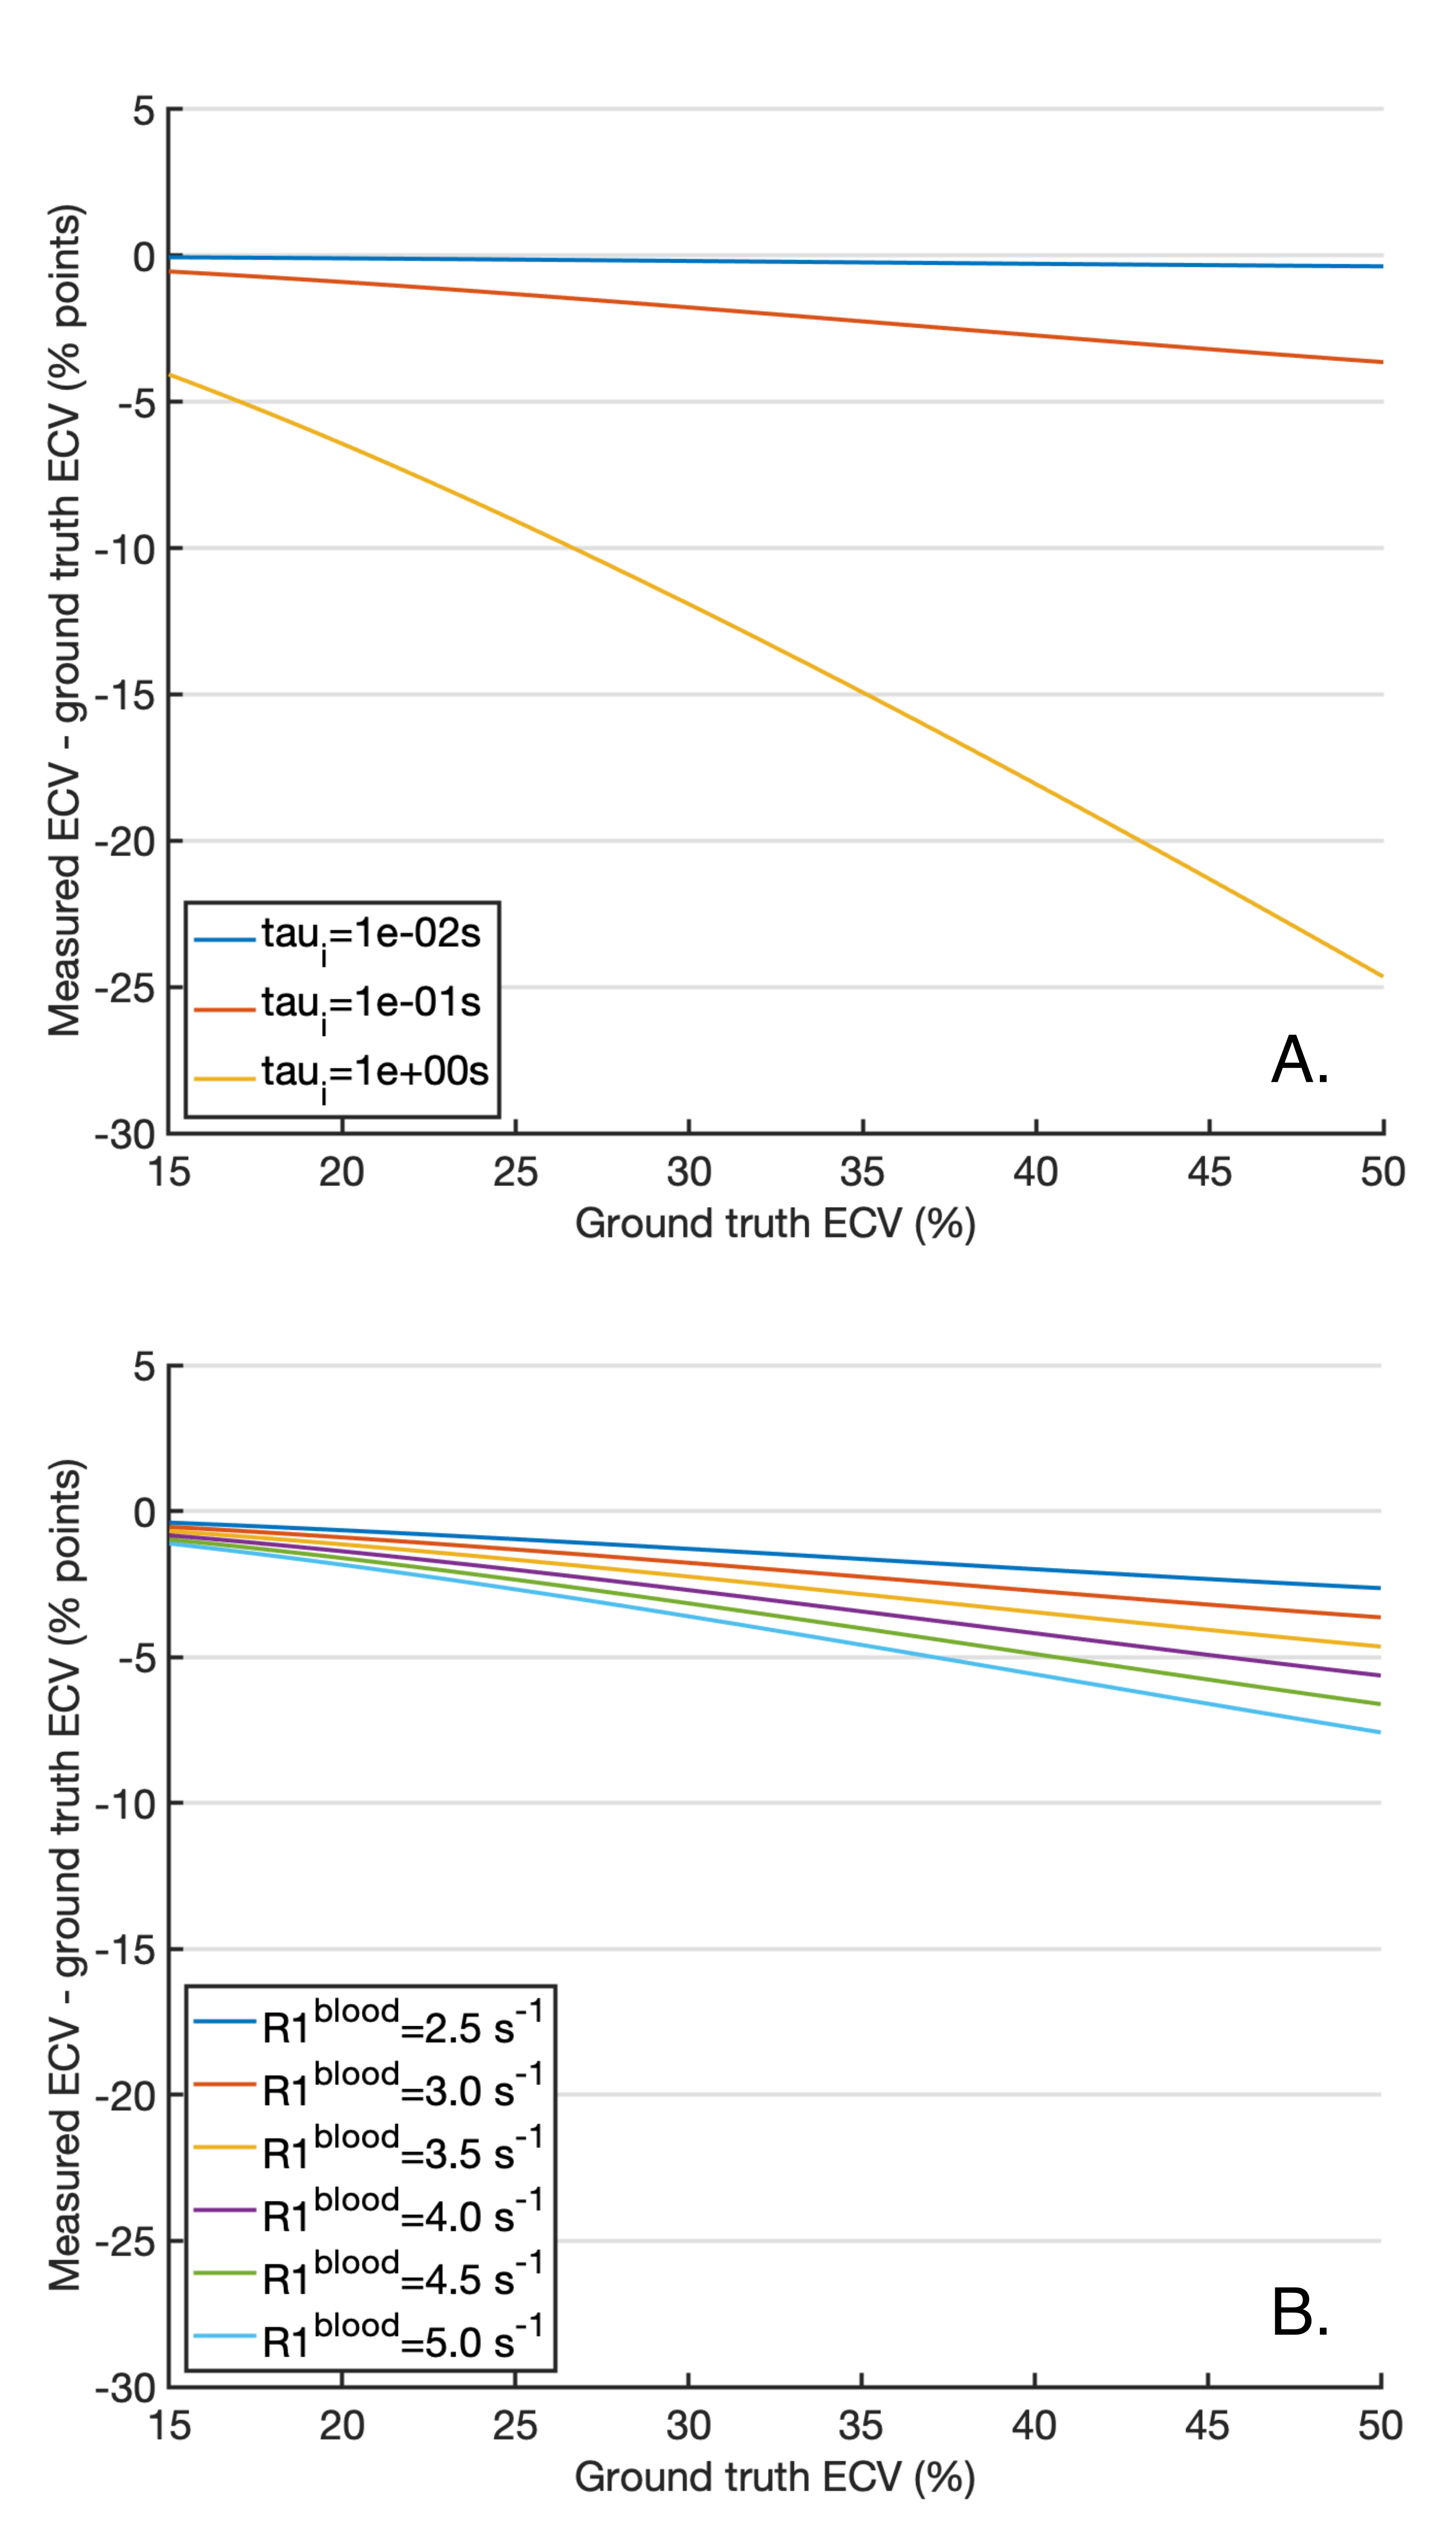
Figure 2 plots the apparent R1s and their amplitudes for varying τi pre-contrast (A and B) and post-contrast (C and D). Pre-contrast, at myocardial τi=100ms3,11, the smaller component of the biexponential (b) has amplitude b=5x10⁻⁵ and T1a is equal to the population weighted average (T1m), suggesting the FXL. Post contrast, at τi=100ms3,11, b=1.3x10⁻³, but T1a is increased by 14ms over T1m due to the effects of exchange, suggesting that the shutter-speed approximation or FXR12 is applicable.Based on the FXR/shutter-speed approximation, figure 3 shows the non-linearity of R1myo post with R1blood post at high GBCA as a consequence of finite τi. Figure 4 shows measured ECV if the exchange modified R1myo post is used in equation 4. At ground truth ECV=25%, τi=100ms and R1blood post=3s-1, the measured ECV=23.6% and at ground truth ECV=40%, measured ECV=37.2%. Figure 5 shows the error in ECV as a function of ECV.
Discussion
Based on a two-compartment model of T1, the myocardium is in the FXL pre-contrast and FXR with typical GBCA doses. In FXR the shutter-speed model applies and we estimated the error in measured ECV due to limited water exchange between the intracellular space and MIF. The typical underestimation in ECV is 1.5-3% for ground truth ECV=25-40%. However, these errors increase with R1blood and intracellular water lifetime (τi). While R1blood can be reported to help identify potential exchange related changes, τi is more challenging to measure.Coelho-Filho et al.11 compared the FXL based ECV with a shutter-speed model estimate of ECV and demonstrate larger changes in-vivo than our 1.5-3%, although their peak R1blood was higher.
Conclusion
Measured differences in ECV on the scale of the underestimations demonstrated here (e.g. 13,14) should be interpreted with caution as they could be a consequence of τi variation due to changes in cell volume, surface area or permeability rather than in ECV.Acknowledgements
This work was partly funded by the British Heart Foundation (RG/19/1/34160).References
1. Haaf, P. et al. Cardiac T1 Mapping and Extracellular Volume (ECV) in clinical practice: A comprehensive review. Journal of Cardiovascular Magnetic Resonance 18, (2016).
2. Arheden, H. et al. Reperfused rat myocardium subjected to various durations of ischemia: Estimation of the distribution volume of contrast material with echo-planar MR imaging. Radiology 215, 520–528 (2000).
3. Donahue, K. M., Burstein, D., Manning, W. J. & Gray, M. L. Studies of Gd‐DTPA relaxivity and proton exchange rates in tissue. Magn. Reson. Med. 32, 66–76 (1994).
4. Yankeelov, T. E., Rooney, W. D., Li, X. & Springer, C. S. Variation of the Relaxographic ‘Shutter-Speed’ for Transcytolemmal Water Exchange Affects the CR Bolus-Tracking Curve Shape. Magn. Reson. Med. (2003). doi:10.1002/mrm.10624
5. Callaghan, P. T. Spin relaxation in microscopically inhomogeneous media. in Translational Dynamics and Magnetic Resonance 261–269 (Oxford University Press, 2011).
6. Pintaske, J. et al. Erratum: Relaxivity of gadopentetate dimeglumine (Magnevist), gadobutrol (Gadovist), and gadobenate dimeglumine (MultiHance) in human blood plasma at 0.2, 1.5, and 3 Tesla (Investigative Radiology (2006) 41,3, (213-221)). Investigative Radiology (2006). doi:10.1097/00004424-200612000-00003
7. Roy, C. et al. Age and sex corrected normal reference values of T1, T2 T2∗and ECV in healthy subjects at 3T CMR. J. Cardiovasc. Magn. Reson. (2017). doi:10.1186/s12968-017-0371-5
8. Lu, H., Clingman, C., Golay, X. & Van Zijl, P. C. M. Determining the longitudinal relaxation time (T1) of blood at 3.0 tesla. Magn. Reson. Med. 52, 679–682 (2004).
9. Feldschuh, J. & Enson, Y. Prediction of the normal blood volume. Relation of blood volume to body habitus. Circulation (1977). doi:10.1161/01.CIR.56.4.605
10. Tortora, G. J. & Derrickson, B. Principles of Anatomy & Physiology. (Wiley, 2014).
11. Coelho-Filho, O. R. et al. Role of transcytolemmal water-exchange in magnetic resonance measurements of diffuse myocardial fibrosis in hypertensive heart disease. Circ. Cardiovasc. Imaging (2013). doi:10.1161/CIRCIMAGING.112.979815
12. Buckley, D. L. Shutter-speed dynamic contrast-enhanced MRI: Is it fit for purpose? Magn. Reson. Med. 81, 976–988 (2019).
13. Ntusi, N. A. B. et al. Diffuse myocardial fibrosis and inflammation in rheumatoid arthritis: Insights from CMR T1 Mapping. JACC Cardiovasc. Imaging (2015). doi:10.1016/j.jcmg.2014.12.025
14. Su, M. Y. M. et al. CMR-verified diffuse myocardial fibrosis is associated with diastolic dysfunction in HFpEF. JACC Cardiovasc. Imaging (2014). doi:10.1016/j.jcmg.2014.04.022
Figures