0790
Reproducibility, Repeatability and Preliminary Clinical Results of Free-Breathing Isotropic 3D Whole-Heart T2 Mapping1Biomedical Engineering Department, School of Biomedical Engineering and Imaging Sciences, King's College London, London, United Kingdom
Synopsis
Myocardial T2 mapping has emerged as a promising tool for edema characterization and detection of myocardial inflammation. T2 mapping is conventionally performed under breath-hold by acquiring multiple T2-prepared images using 2D bSSFP. However, 2D imaging and breath-holding impedes high spatial resolution, limits whole-heart coverage and can be challenging in some patients. We developed a free-breathing 3D whole-heart T2 mapping framework that achieves high isotropic resolution in a clinically feasible scan time in healthy subjects. Here we sought to quantify the reproducibility and repeatability of this technique and assess its performance to detect myocardial inflammation in a clinical setting.
INTRODUCTION
Quantitative myocardial T2 mapping has emerged as a promising tool for edema characterization and detection of subtle myocardial inflammation.1 T2 mapping is conventionally performed under breath-hold by acquiring multiple T2-prepared images using 2D bSSFP (T2p-bSSFP).2 However, 2D imaging and breath-holding impedes high spatial resolution, limits whole-heart coverage and can be challenging in patients who are unwell or unable to follow breath-holding instructions. We recently developed a free-breathing 3D whole-heart T2 mapping framework that achieves high isotropic resolution in a clinically feasible (~6min) scan time in healthy subjects.3 Here we sought to quantify the reproducibility and repeatability of this this technique and assess whether it could reliably detect myocardial inflammation in a clinical setting. The free-breathing 3D T2 mapping was evaluated in 8 healthy subjects (reproducibility and repeatability), and in 10 patients with suspected cardiac inflammation in comparison to the corresponding clinical protocol: 2D T2p-bSSFP, 2D T2-weighted images and/or 2D late gadolinium enhancement (LGE) images.METHODS
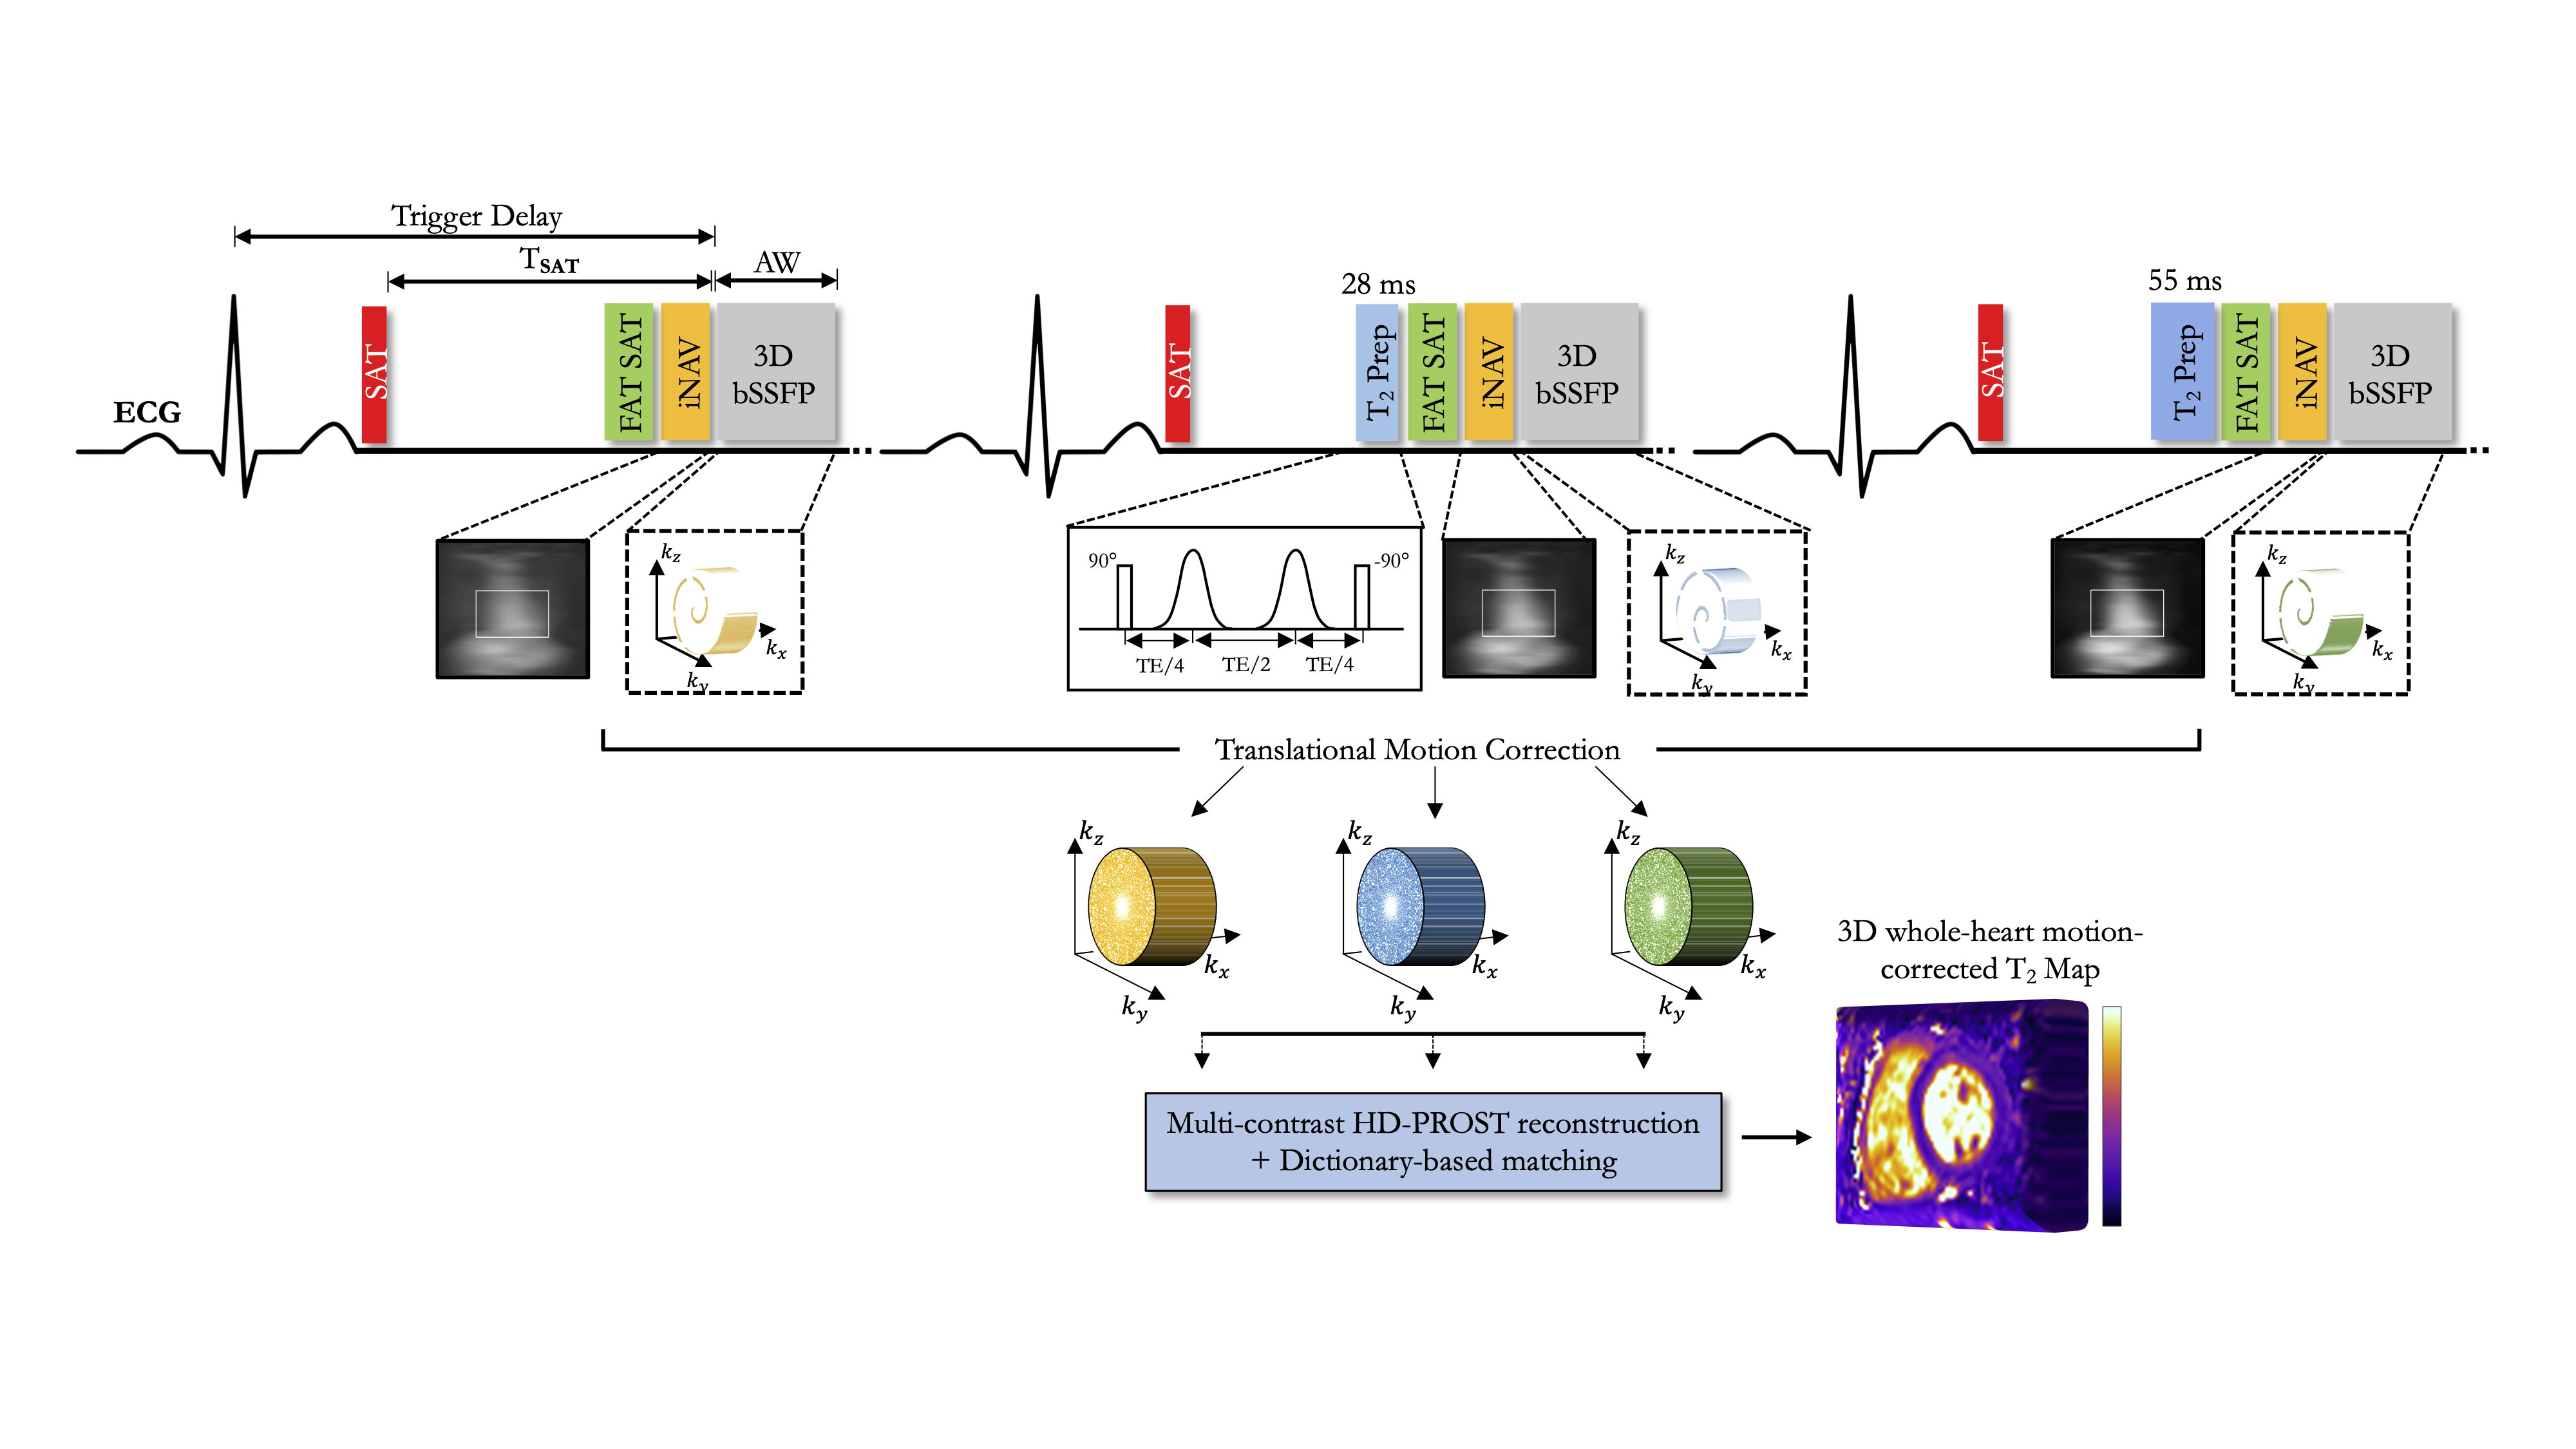
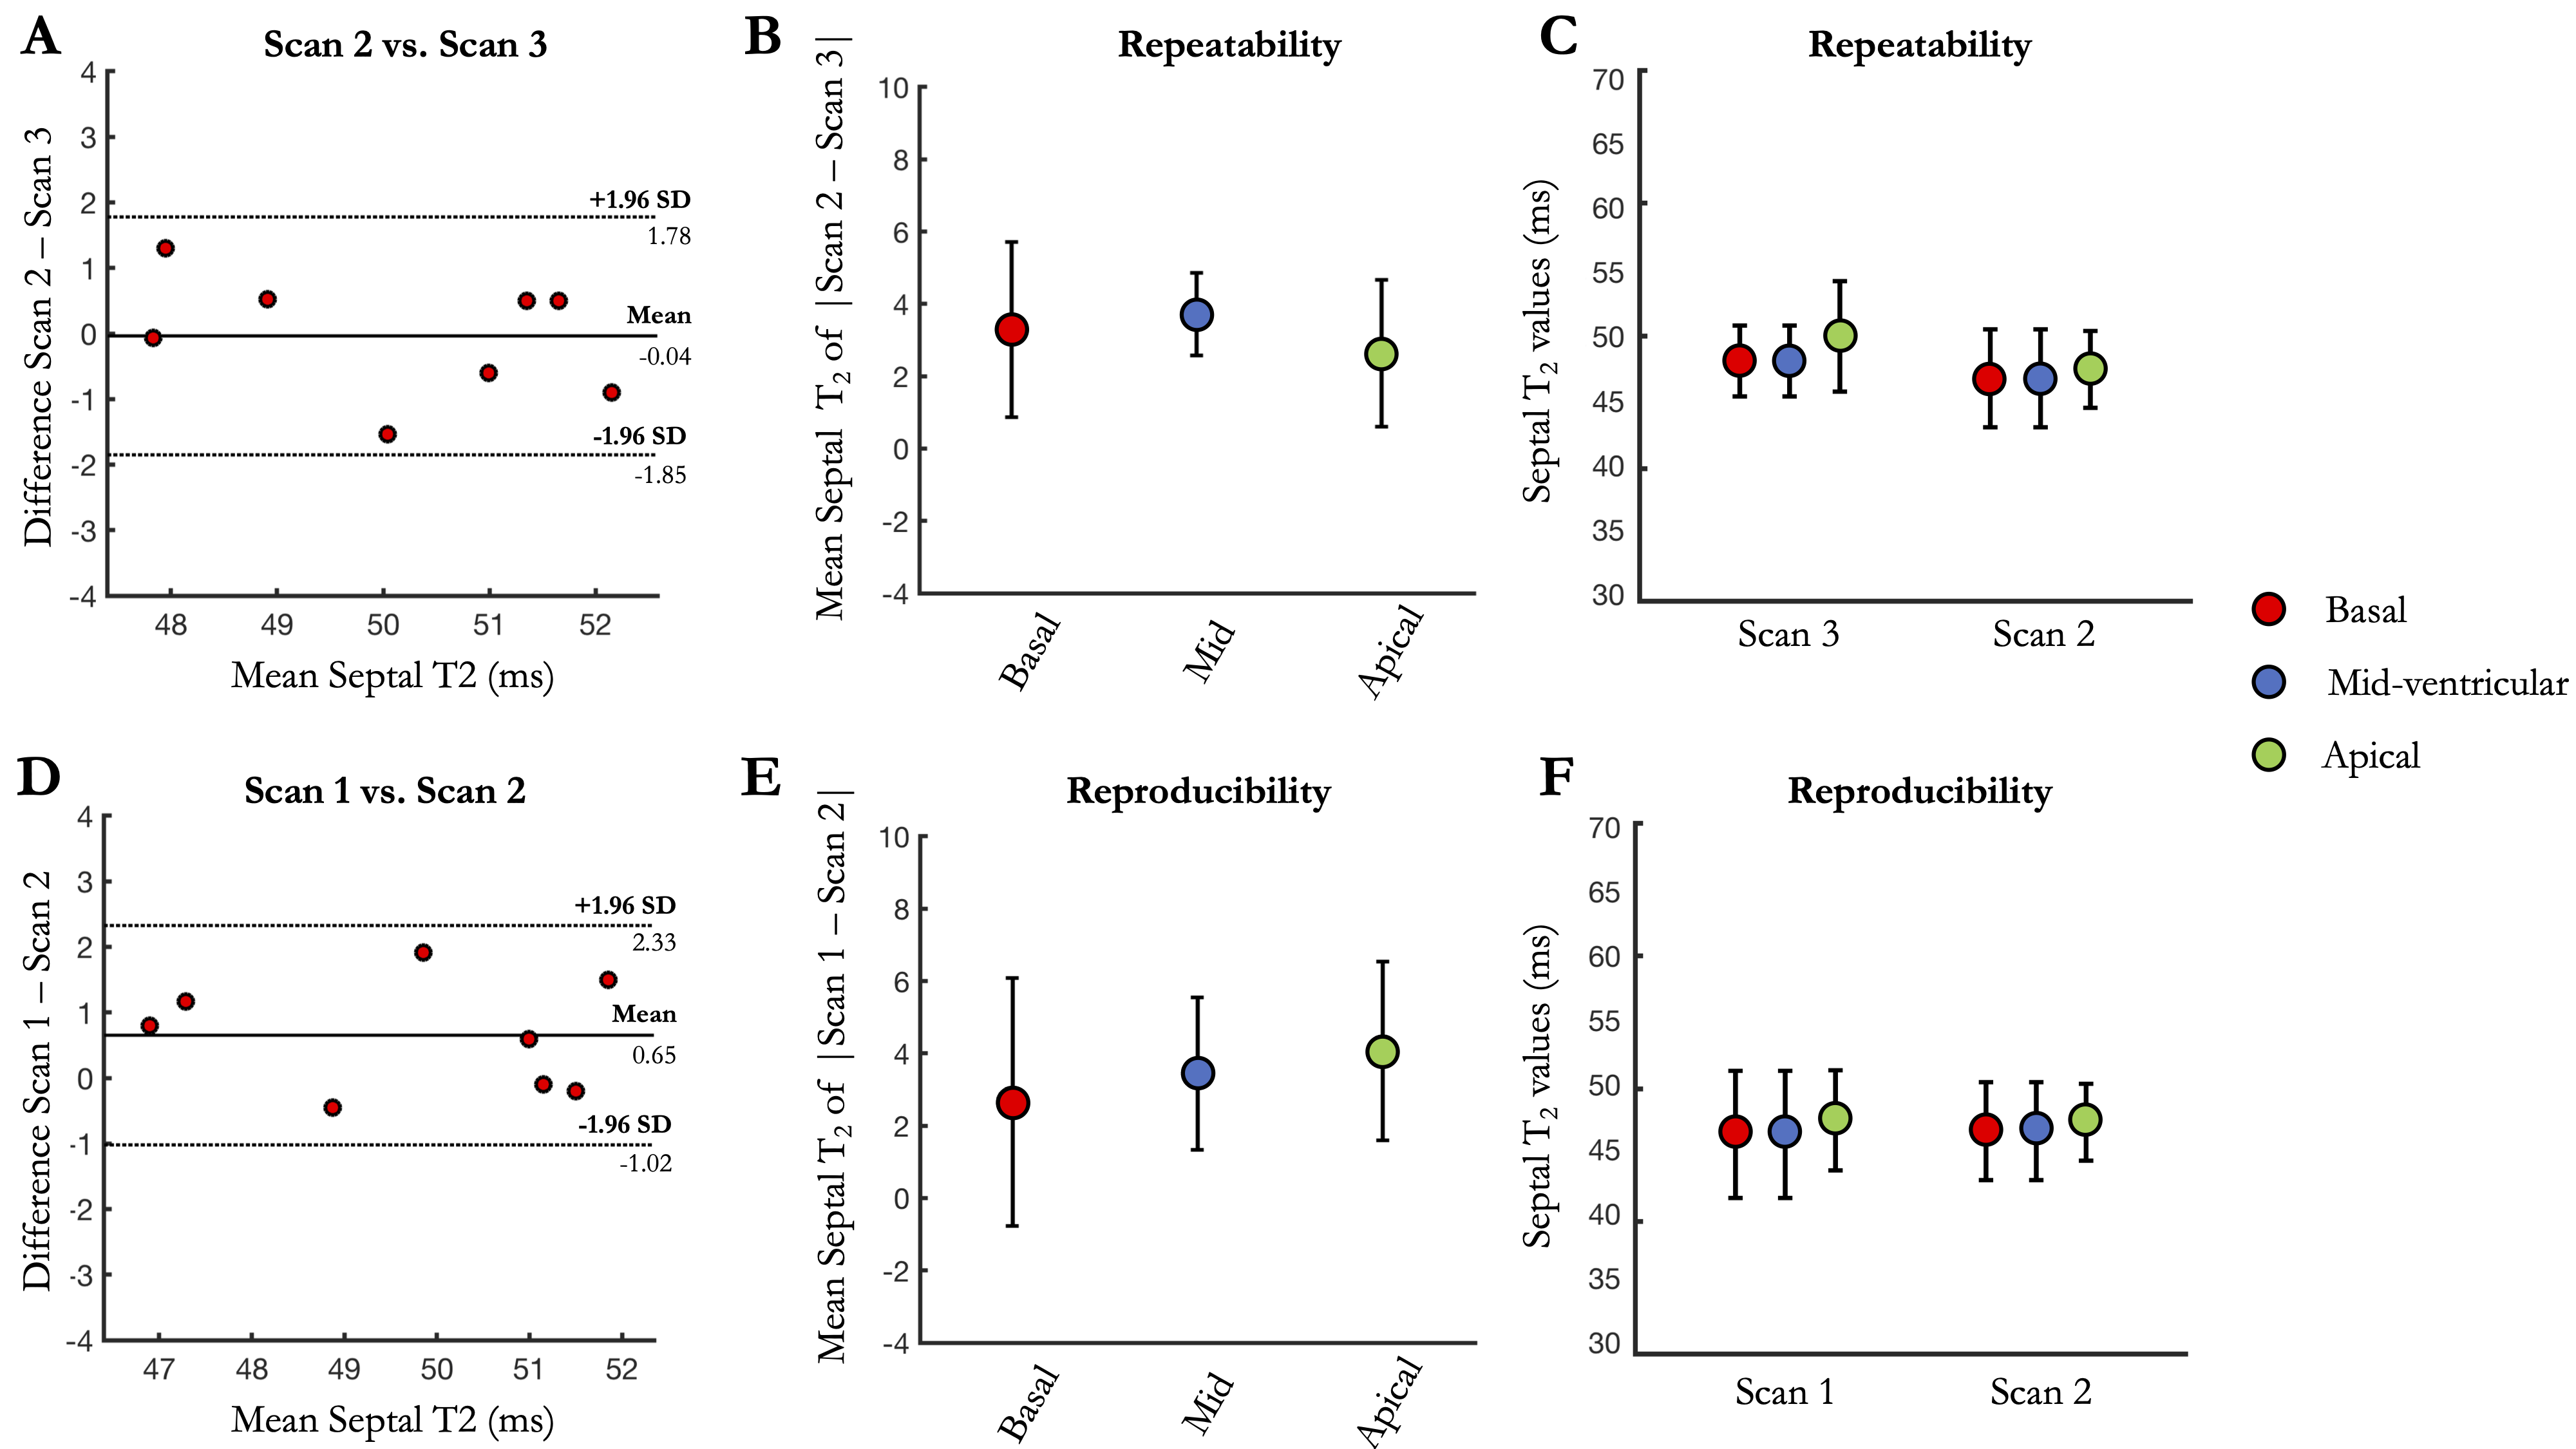
Acquisition & Reconstruction: The recently introduced 3D whole-heart T2 mapping acquisition3 consists of an ECG-triggered T2-prepared bSSFP sequence with nonselective saturation pulses4 to ensure insensitivity to heart rate variability (Figure 1). Three successive volumes are acquired with increasing T2 preparation times ([0,28,55]ms). An undersampled variable density spiral-like 3D Cartesian sampling with golden-angle shifting is employed to accelerate the scan.5,6 A 2D image-navigator preceded each spiral acquisition to enable 2D translational motion correction of the heart, achieving 100% respiratory scan efficiency (no respiratory gating) and predictable scan time.7 To ensure adequate fat suppression, a SPIR (Spectral Presaturation with Inversion Recovery) saturation pulse was applied. The 3D T2-weighted images were reconstructed using a multi-contrast HD-PROST reconstruction6 and the corresponding 3D T2 map were generated using dictionary matching.8Imaging & Analysis: Free-breathing 3D whole-heart T2 mapping was first performed in 8 healthy subjects (3 females, range 26-36 years old). To assess for reproducibility and repeatability, each subject was scanned 3 times during two separate scan sessions (mean interval: 349 days ± 4): scan 1 was performed in the first session, whereas scans 2 and 3 were performed in the second session. Reproducibility ($$$\Delta_{repro}^{T2}$$$) and repeatability ($$$\Delta_{repeat}^{T2}$$$) were obtained comparing absolute septal T2 differences between scans 1 and 2, and between scans 2 and 3, respectively. Additionally, 10 patients (6 females, range 23-75 years old), who were referred for CMR evaluation for cardiac inflammation, underwent free-breathing 3D T2 mapping. All acquisitions were performed on a 1.5T scanner (Magnetom Aera, Siemens Healthcare) with 1.5mm3 isotropic resolution and 5-fold acceleration. Relevant scan parameters included: TR/TE=3.2/1.42ms, FA=90°, bandwidth=830Hz/pixel, subject specific mid-diastolic trigger delay, acquisition window (range, 73-110 ms) and TSAT (range, 505-750 ms), FOV=320x320x84-120mm3. A conventional breath-hold 3-slice (short-axis, base, mid, apex) 2D T2p-bSSFP (resolution 1.9x1.9x8mm3, TET2prep=[0,25,55]ms, three recovery heartbeats) acquisition was performed for comparison purposes in all subjects. Mean and standard deviation of T2 values were extracted by drawing regions of interest in the myocardial septum. In the patient study, 3 to 5 short-axis slices 2D LGE and dark-blood T2-weighted STIR (short-TI inversion recovery) were also acquired under breath-hold (using clinically recommended scan parameters).
RESULTS
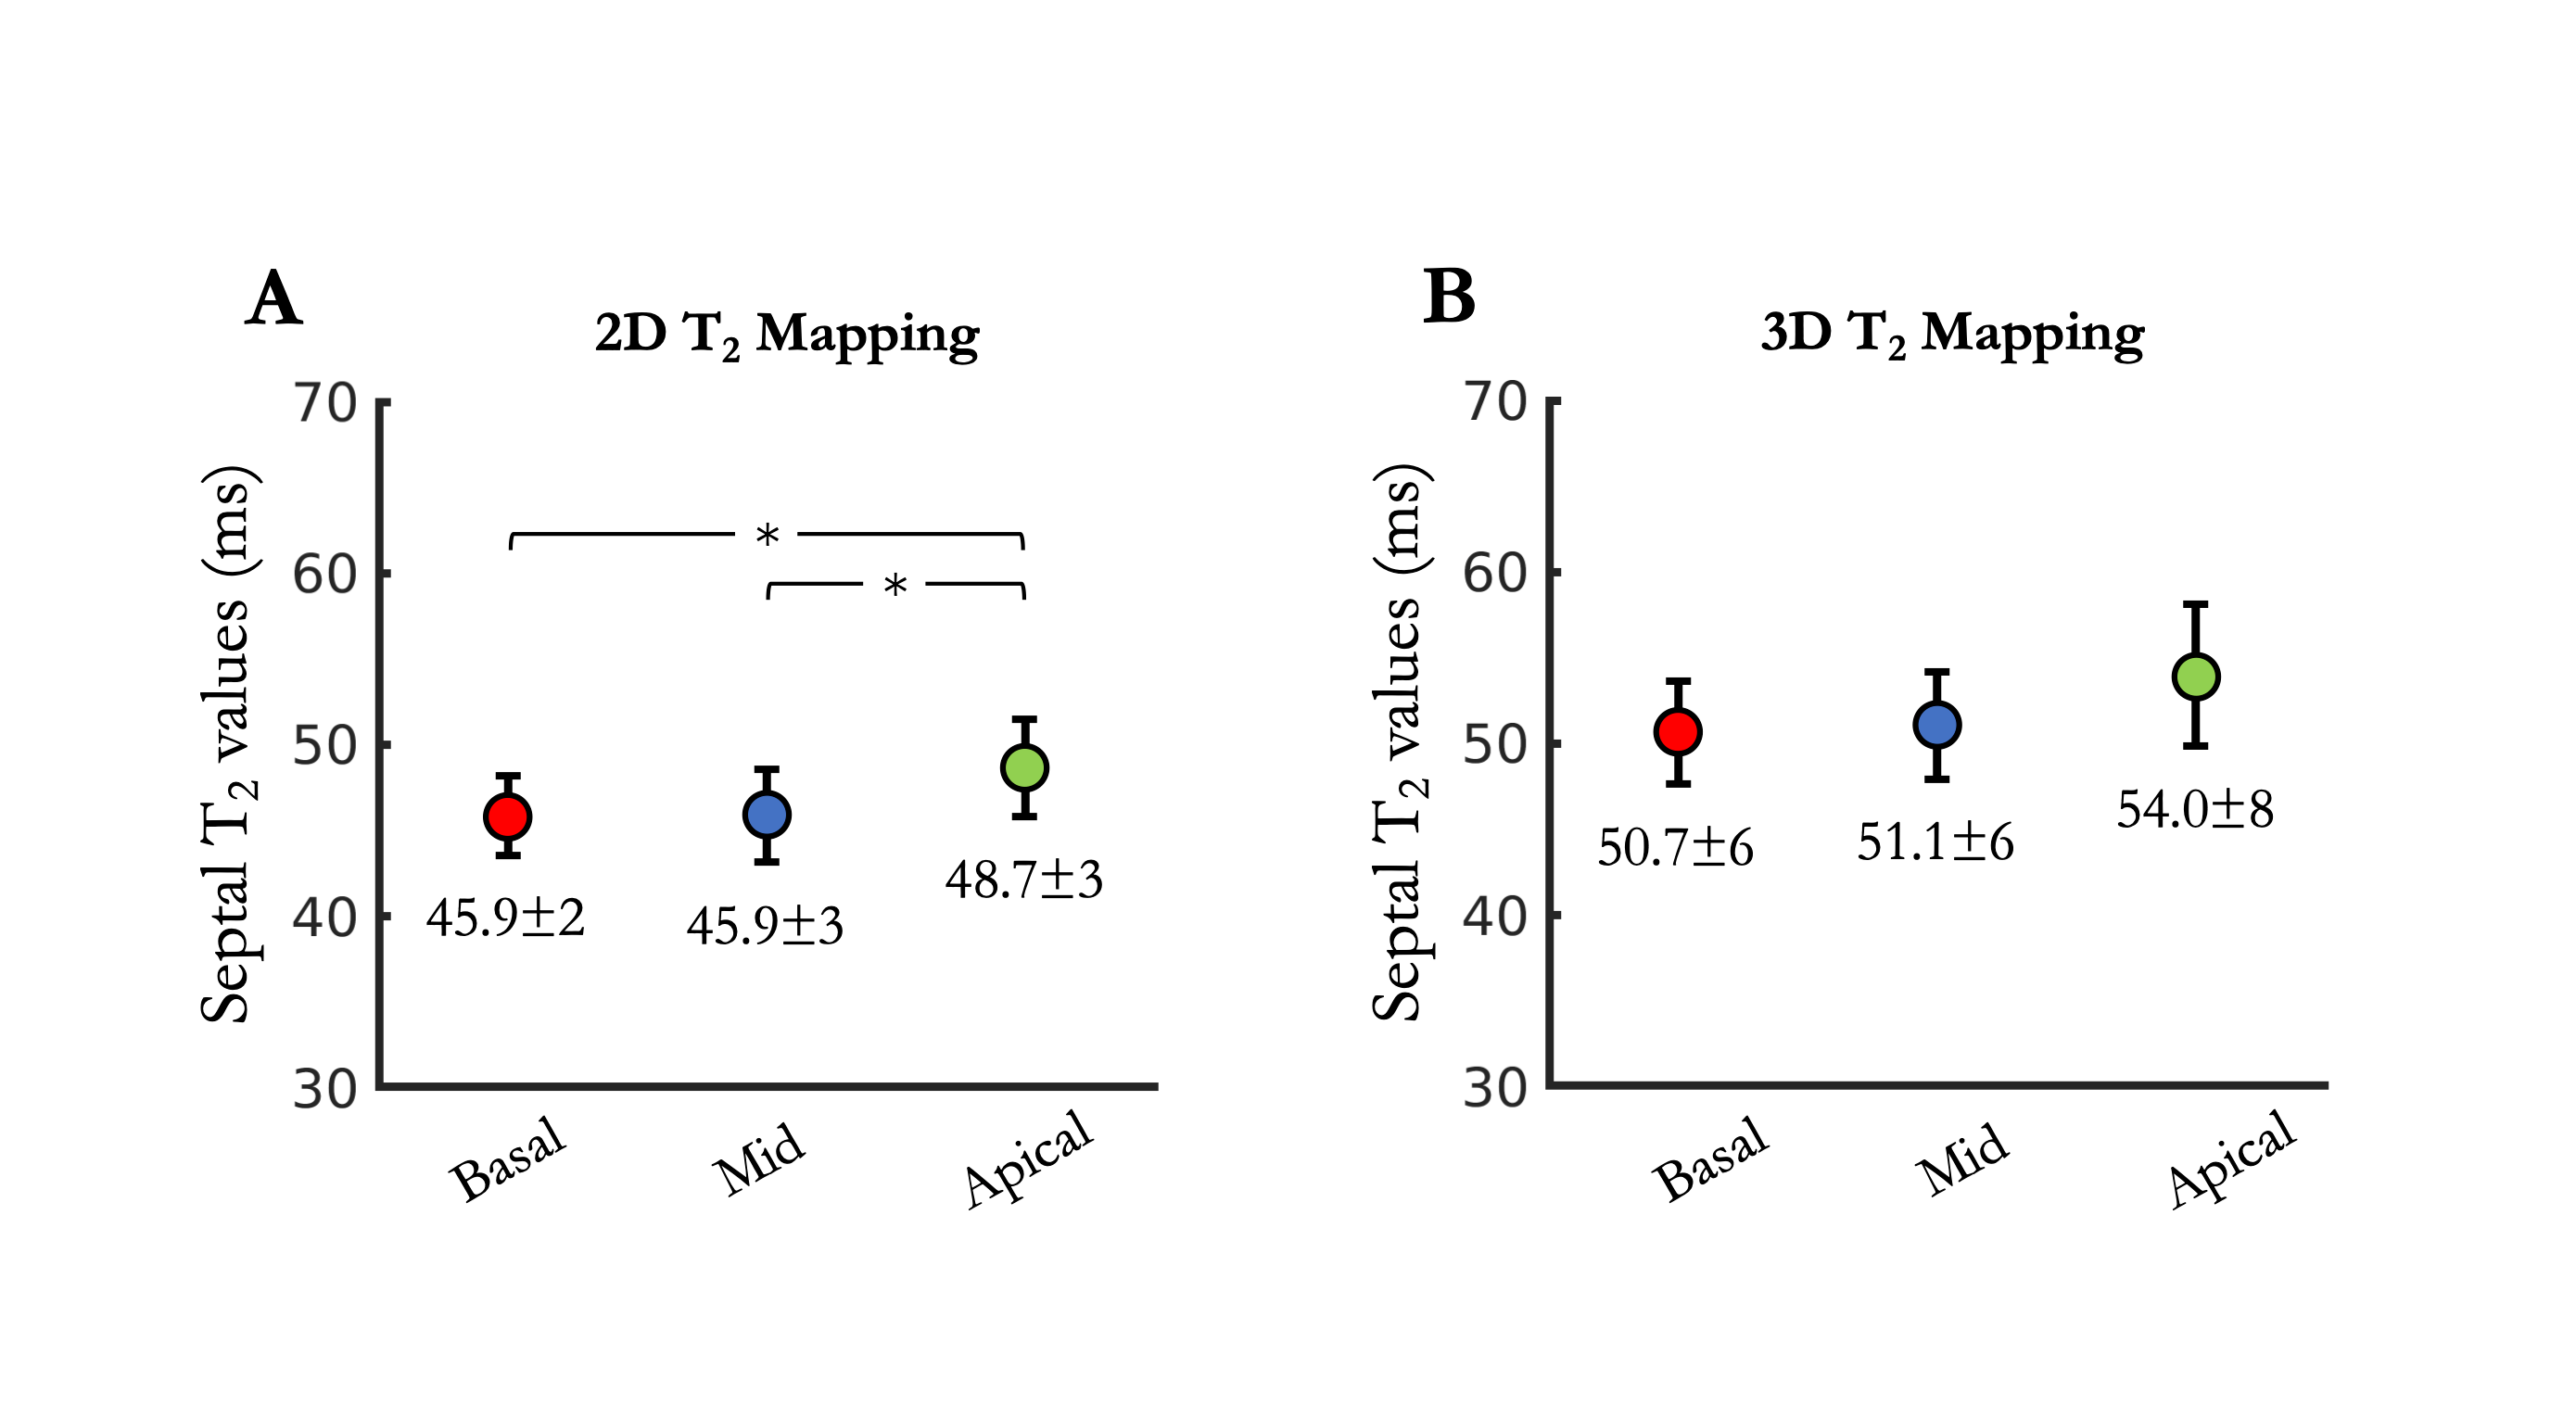
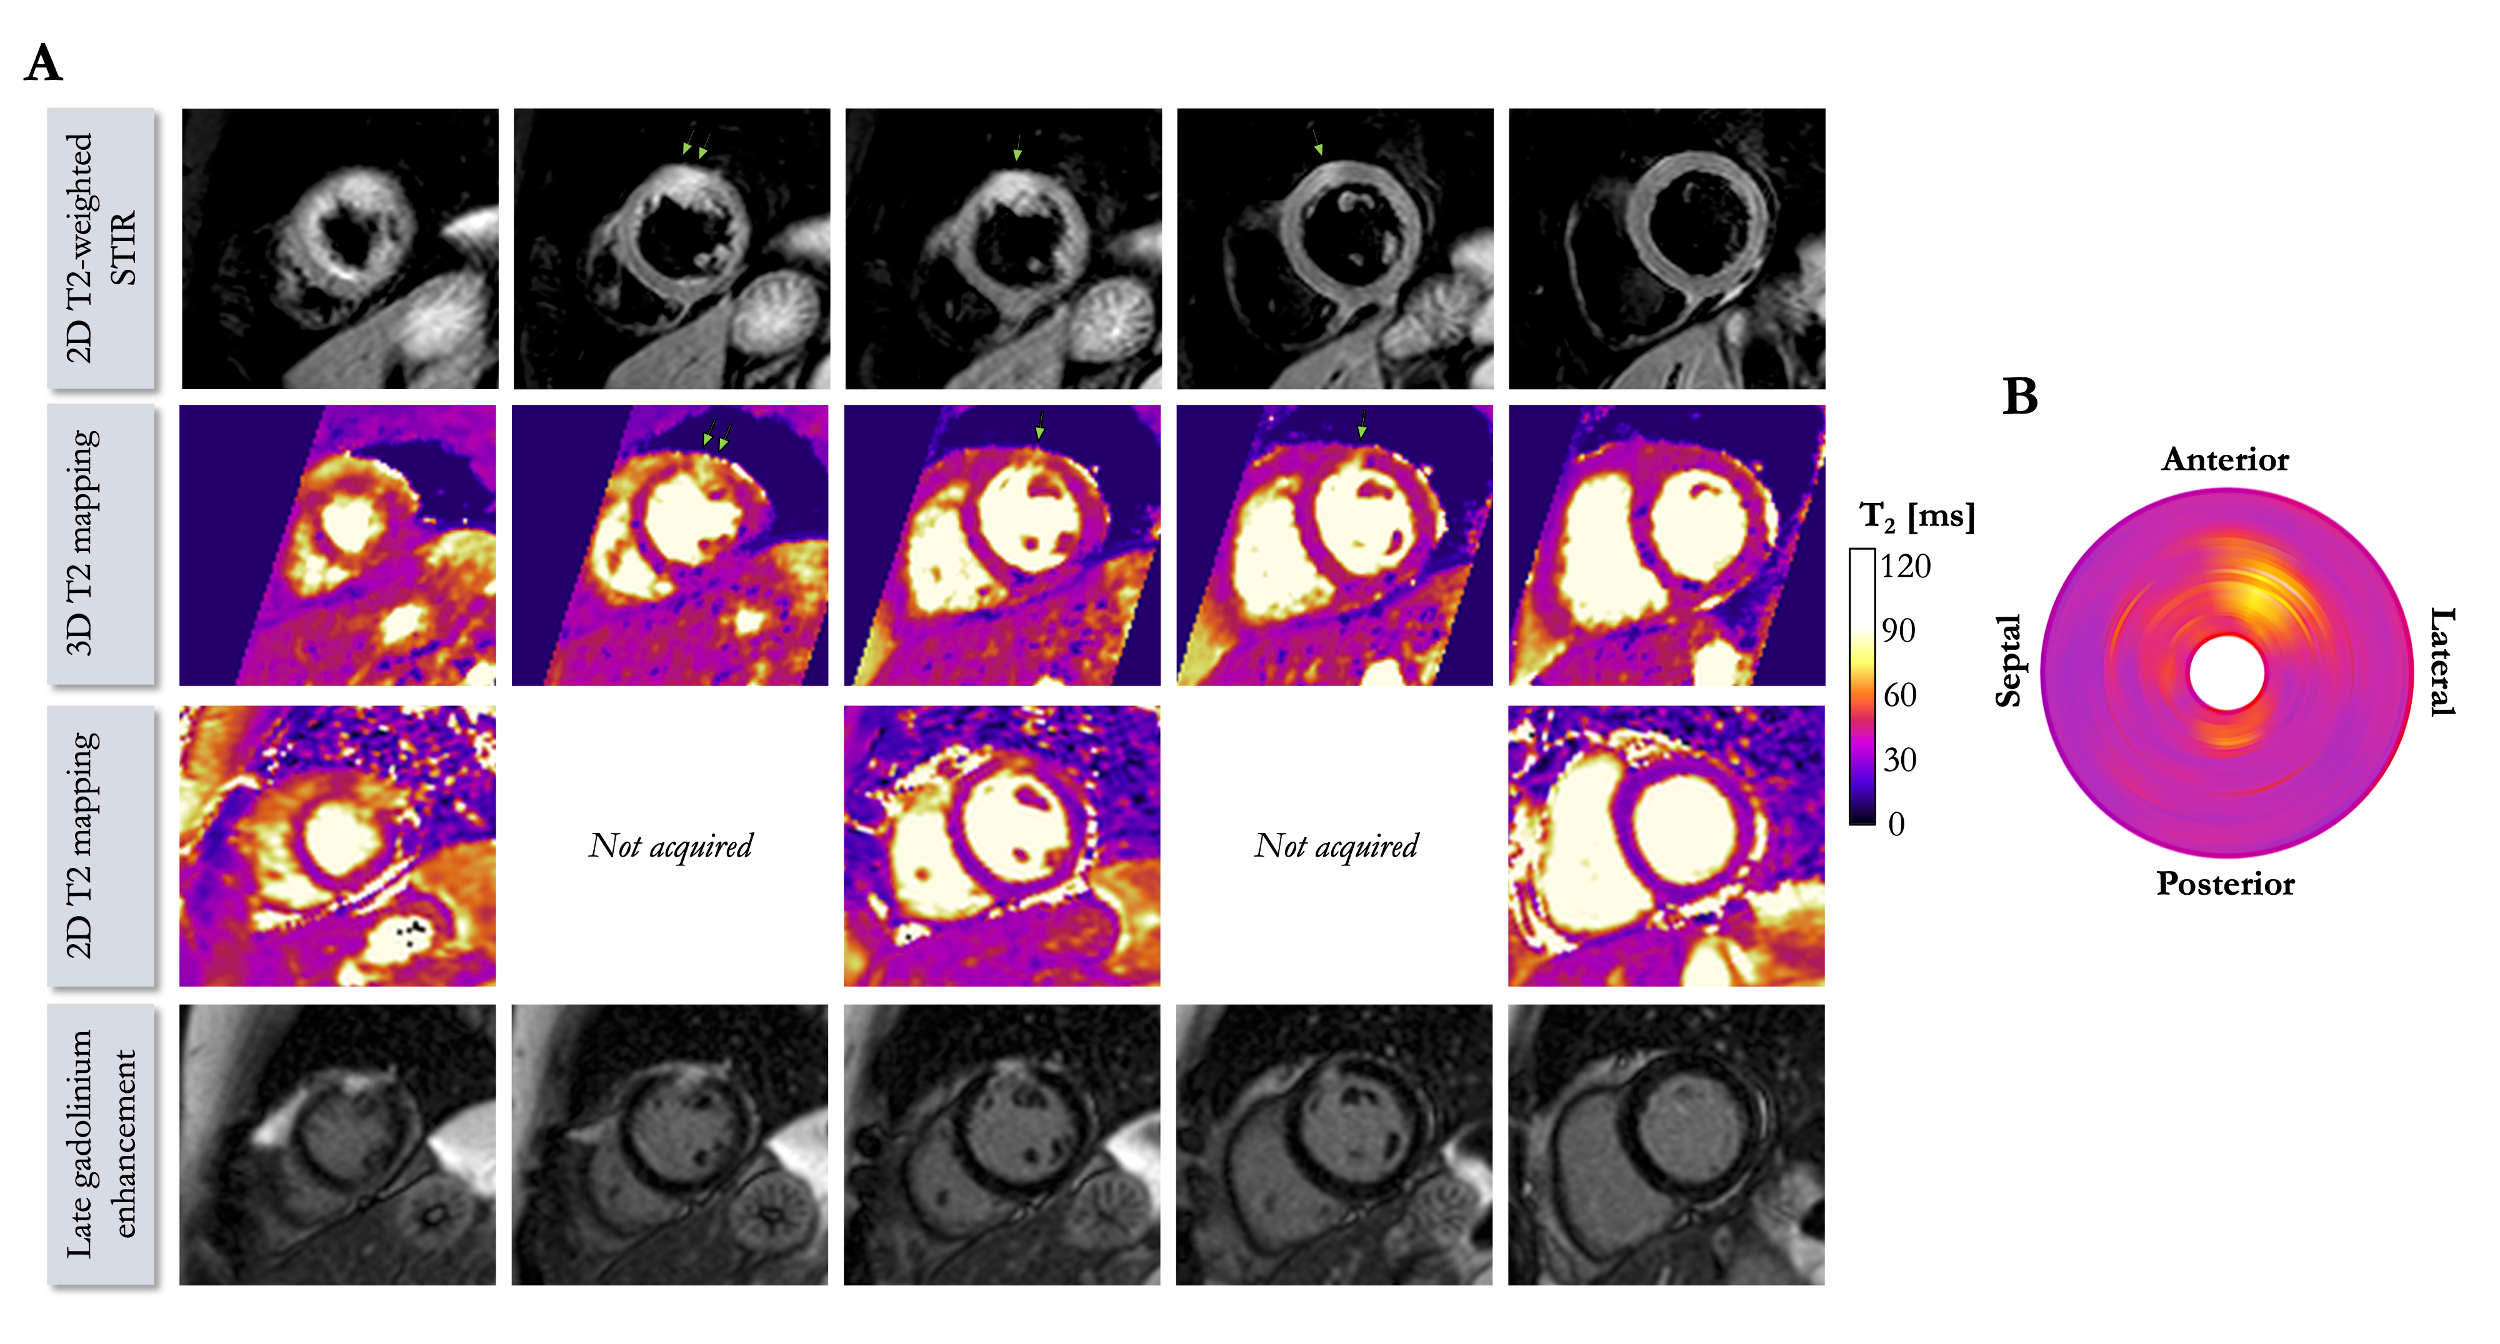
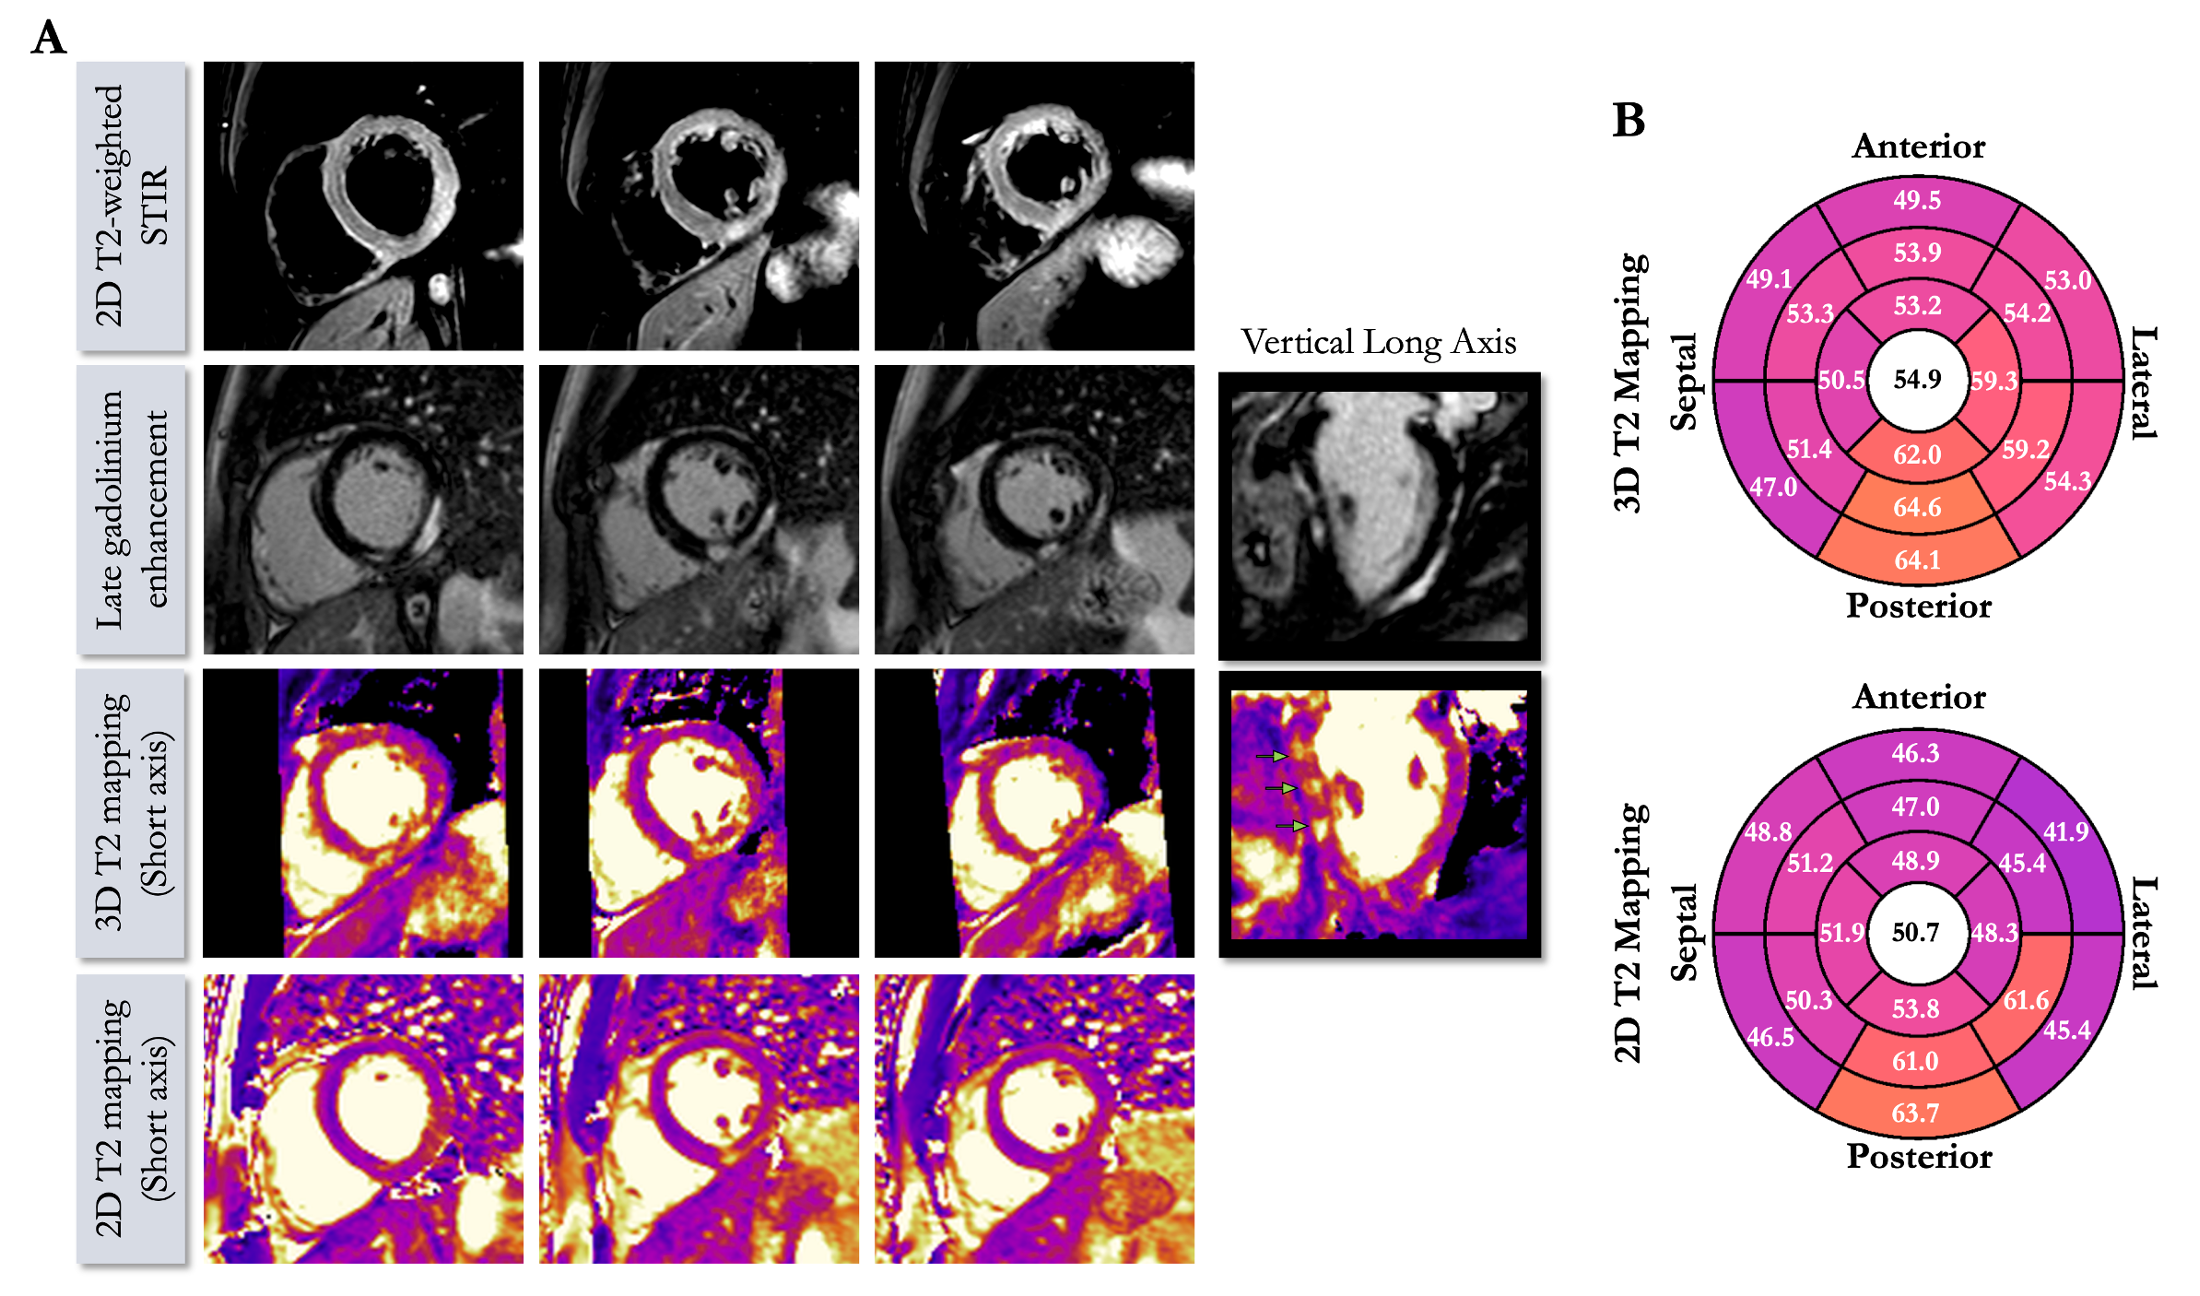
Acquisition times were 6min12s±1min16s in healthy subjects (average heart rate 65±10 bpm) and 6min32s±43s in patients (average heart rate 62±6 bpm) with 100% respiratory scan efficiency. 3D T2 mapping had good reproducibility (mid-cavity, $$$\Delta_{repro}^{T2}$$$=3.44±2ms) and repeatability (mid-cavity, $$$\Delta_{repeat}^{T2}$$$=3.72±1ms) in healthy subjects for basal, mid-cavity and apical slices (Figure 2). Mid-ventricular myocardial T2 values estimated with the proposed 3D T2 mapping sequence were in good agreement with conventional 2D T2p-bSSFP in healthy subjects (septal, T23D=49.5±6ms vs. T22D=49.4±4ms, P=0.97) and in patients (remote, T23D=51.1±6ms vs. T22D=45.9±3ms, P<0.01, Figure 3). Four out of the 10 patients had evidence of myocardial inflammation on 3D T2 mapping, with longer T2 times in the diseased areas (Figures 4-5) as compared to the remote myocardium. This was in agreement with 2D T2-weighted STIR images, 2D T2 mapping and/or LGE images. Improved visualization was observed with 3D T2 mapping in comparison to the 2D approaches due to whole-heart coverage and higher isotropic spatial resolution (Figure 4).CONCLUSION
Initial clinical results demonstrate that the recently introduced 3D whole-heart T2 mapping framework enables free-breathing acquisitions in a predictable acquisition time of ~6min in patients with myocardial inflammation. The high isotropic resolution and good T2 reproducibility and repeatability of myocardial tissue could provide an effective approach to diagnose and monitor the progression of myocardial inflammation in various cardiomyopathies and further studies are now warranted.Acknowledgements
This work was supported by EPSRC (EP/P001009, EP/P007619, EP/P032311/1) and Wellcome EPSRC Centre for Medical Engineering (NS/ A000049/1).References
[1] Haberkorn SM, et al. State of the art in cardiovascular T2 mapping: on the way to a cardiac biomarker? Curr. Cardiovasc. Imaging Rep. 2018;11.
[2] Giri S, et al. T2 quantification for improved detection of myocardial edema. J. Cardiovasc. Magn. Reson. 2009;11:1-13.
[3] Bustin A, et al. Accelerated free-breathing whole-heart 3D T2 mapping with high isotropic resolution. Magn. Reson. Med. 2019;00:1-15.
[4] Ding H, et al. Three-dimensional whole-heart T2 mapping at 3T. Magn. Reson. Med. 2015;74:803-816.
[5] Prieto C, et al. Highly efficient respiratory motion compensated free-breathing coronary MRA using golden-step Cartesian acquisition. J. Magn. Reson. Imaging 2015;41:738-746.
[6] Bustin A, et al. High-dimensionality undersampled patch-based reconstruction (HD-PROST) for accelerated multi-contrast magnetic resonance imaging. Magn. Reson. Med. 2019;81:3705-3719.
[7] Henningsson M, et al. Whole-heart coronary MR angiography with 2D self-navigated image reconstruction. Magn. Reson. Med. 2012;67:437-445.
[8] Weigel M, Extended phase graphs: dephasing, RF pulses, and echoes – pure and simple. J. Magn. Reson. Imaging 2015;41:266-295.
Figures