0786
3D sub-millimeter personalized estimation of cardiomyocyte orientation using dimensionality reduction1Institute for Biomedical Engineering, University and ETH Zurich, Zurich, Switzerland, 2Laboratoire de Mécanique des Solides, École Polytechnique, Paris, France, 3C.N.R.S./Université Paris-Saclay, Palaiseau, France, 4M3DISIM team, Inria / Université Paris-Saclay, Palaiseau, France
Synopsis
We propose a parametric low-rank representation of major characteristics of cardiomyocyte orientation in a shape-adapted coordinate system from 3D high-resolution ex-vivo cDTI data by exploiting structural similarity across hearts. We compare two dimensionality reduction methods, namely Proper Orthogonal Decomposition and Proper Generalized Decomposition. These low-order descriptions can be fit to sparse, noisy or low-resolution target data. Transferring high-resolution microstructural information with this parametric representation shows potential for in-vivo denoising and 3D extrapolation.
Introduction
In-vivo cardiac diffusion tensor imaging (cDTI) suffers from low signal-to-noise ratio, low spatial resolution and limited cardiac coverage. To this end, 3D extrapolation1 and denoising2 of in-vivo microstructural information have been proposed. The alignment of cardiomyocytes typically follows a double helical structure, suggesting the possibility of compressing the microstructural information. We propose a parametric low-rank representation in a shape-adapted coordinate system, extracting the predominant characteristics of aggregated myocyte (fiber) orientation and exploiting the structural similarity across hearts based on 3D high-resolution ex-vivo cDTI data. This parametrization serves as high-resolution prior for extrapolation of sparse and low-resolution data.Methods
Stejskal-Tanner diffusion tensor imaging with 3D multi-shot echo planar imaging readout was performed on six Formalin fixated porcine hearts on a 1.5T clinical imaging system. Fixation was performed by retrograde perfusion after suspending the heart and filling the chambers with fixative fluids to keep the in-vivo shape. The imaging parameters were as follows: spatial resolution 0.75x0.75x0.75mm3 reconstructed to 0.5x0.5x0.5mm3, TR/TE 1000/84ms, 25 profiles per shot, 2 averages, diffusion directions: 8 at b=150s/mm2 and 24 at b=1000s/mm2 distributed on two spheres. The data was down-sampled for an extrapolation experiment to a resolution of 2.5x2.5x8mm3 by cropping and zero-filling k-space.Key to the parametrization of cardiac microstructure are shape-adapted physiological coordinates defined on the segmented left ventricular myocardium ensuring that same positions with respect to the anatomy are assigned the same coordinates across hearts. A linear diffusion problem with appropriate Dirichlet Boundary conditions3,4 at distinct anatomical references is solved for transmural$$$\;(t)$$$, circumferential$$$\;(c)\;$$$and longitudinal$$$\;(l)\;$$$directions. The resulting fields are normalized for path line length along each direction yielding uniform coordinate distributions (Figure 1a). The diffusion tensor’s first eigenvector is represented in the local coordinate system at each voxel.
Two order reduction methods are compared, an adapted Proper Generalized Decomposition (PGD)2 combined with a Singular Value Decomposition (SVD) and Proper Orthogonal Decomposition (POD)5 using five hearts for mode estimation and one heart for testing (Figure 1b).
PGD modes are computed for each heart separately, allowing for a reduced order representation without prior assumptions6. A PGD mode consists of three one-dimensional functions along each coordinate direction$$\text{data}(t,c,l)\approx\sum_{m=1}^{\# PGD\;{}modes}F_{m}(t)\cdot{}G_{m}(c)\cdot{}H_{m}(l).$$ Each term of the PGD mode is discretized by$$$\;n\;$$$piecewise linear shape functions $$$\phi_{k},\;k=1,...,z\;;\;F_{m}\approx\vec{\phi}\cdot\vec{a_{F_{m}}}$$$. The number of degrees of freedom$$$\;z$$$, is set to 14, 24 and 10 for transmural ($$$F_{m}(t)$$$), circumferential ($$$G_{m}(c)$$$) and longitudinal functions ($$$H_{m}(l)$$$) according to data size along each direction. They are fitted iteratively minimizing the$$$\;L_{2}$$$-distance to the data2. The similarity across hearts is exploited to parametrize the PGD modes by means of the SVD, extracting the variation of the degrees of freedom of the one-dimensional functions over the mean of all datasets. The resulting SVD modes$$$ \;f_{m,n_{f_{m}}},\;g_{m,n_{g_{m}}},\;h_{m,n_{h_{m}}}\;$$$represent the main feature variations between hearts along one coordinate. The resulting parametrization$$\text{data}(t,c,l)\approx \sum_{m=1}^{\# PGD \; modes}\left[\left(f_{m,mean}(t)+\sum_{n_f=1}^{\#{}SVD\;modes}w_{F_{m},n_f}\cdot f_{m,n_f}(t)\right)\cdot\left(g_{m,mean}(c)+\sum_{n_g=1}^{\# SVD\;modes}w_{G_{m},n_g}\cdot{}g_{m,n_g}(c)\right )\\\cdot\left(h_{m,mean}(l)+\sum_{n_h=1}^{\#{}SVD\;modes}w_{H_{m},n_h}\cdot{}h_{m,n_h}(l)\right)\right]$$ consists of a set of PGD modes parameterized by SVD modes, respectively. An example first PGD mode with one SVD mode is shown in Figure 2. To fit the modes to a target data set, the PGD is applied, and the set of weights $$$\;w_{F_{m},n_f}\,{}w_{G_{m},n_g}\,{}w_{H_{m},n_h}.\;$$$ corresponding to the SVD modes are fitted.
The PGD based parametrization is compared to a POD along the transmural directions of all hearts after projection to a common grid of size [t=20, c=200, l=120]. The resulting parametrization$$\text{gridded data}(t_i,c_j,l_k)\approx\sum_{m=1}^{\#{}POD\;{}modes}\left[\left(w_{m,t_i} \cdot L_m\left(c_j,l_k\right)\right)\right]$$provides a set of two-dimensional POD modes (Figure 1.b): $$$ L_m\left(c_j,l_k\right)$$$. For the interpolation of sparsely distributed data points, “gappy” POD7 has been used to fit the weights.
Results
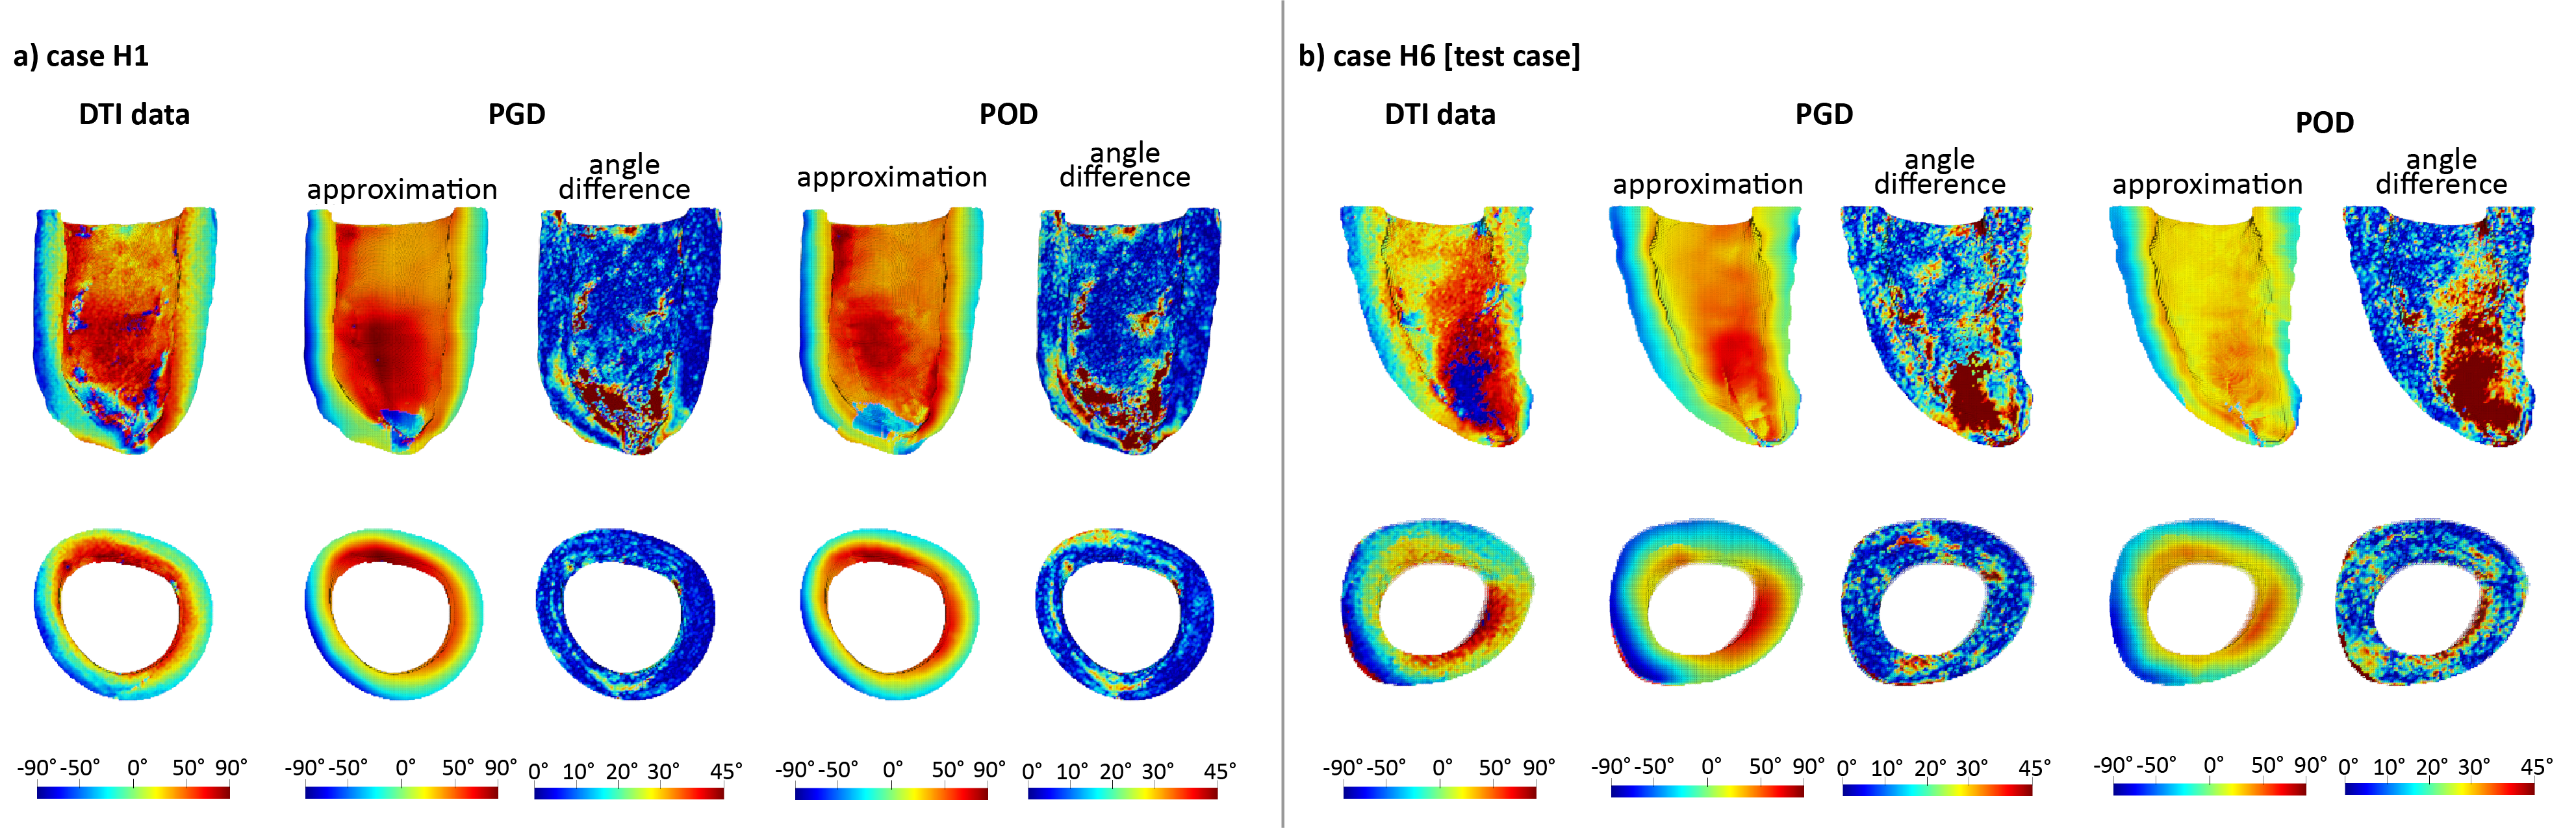
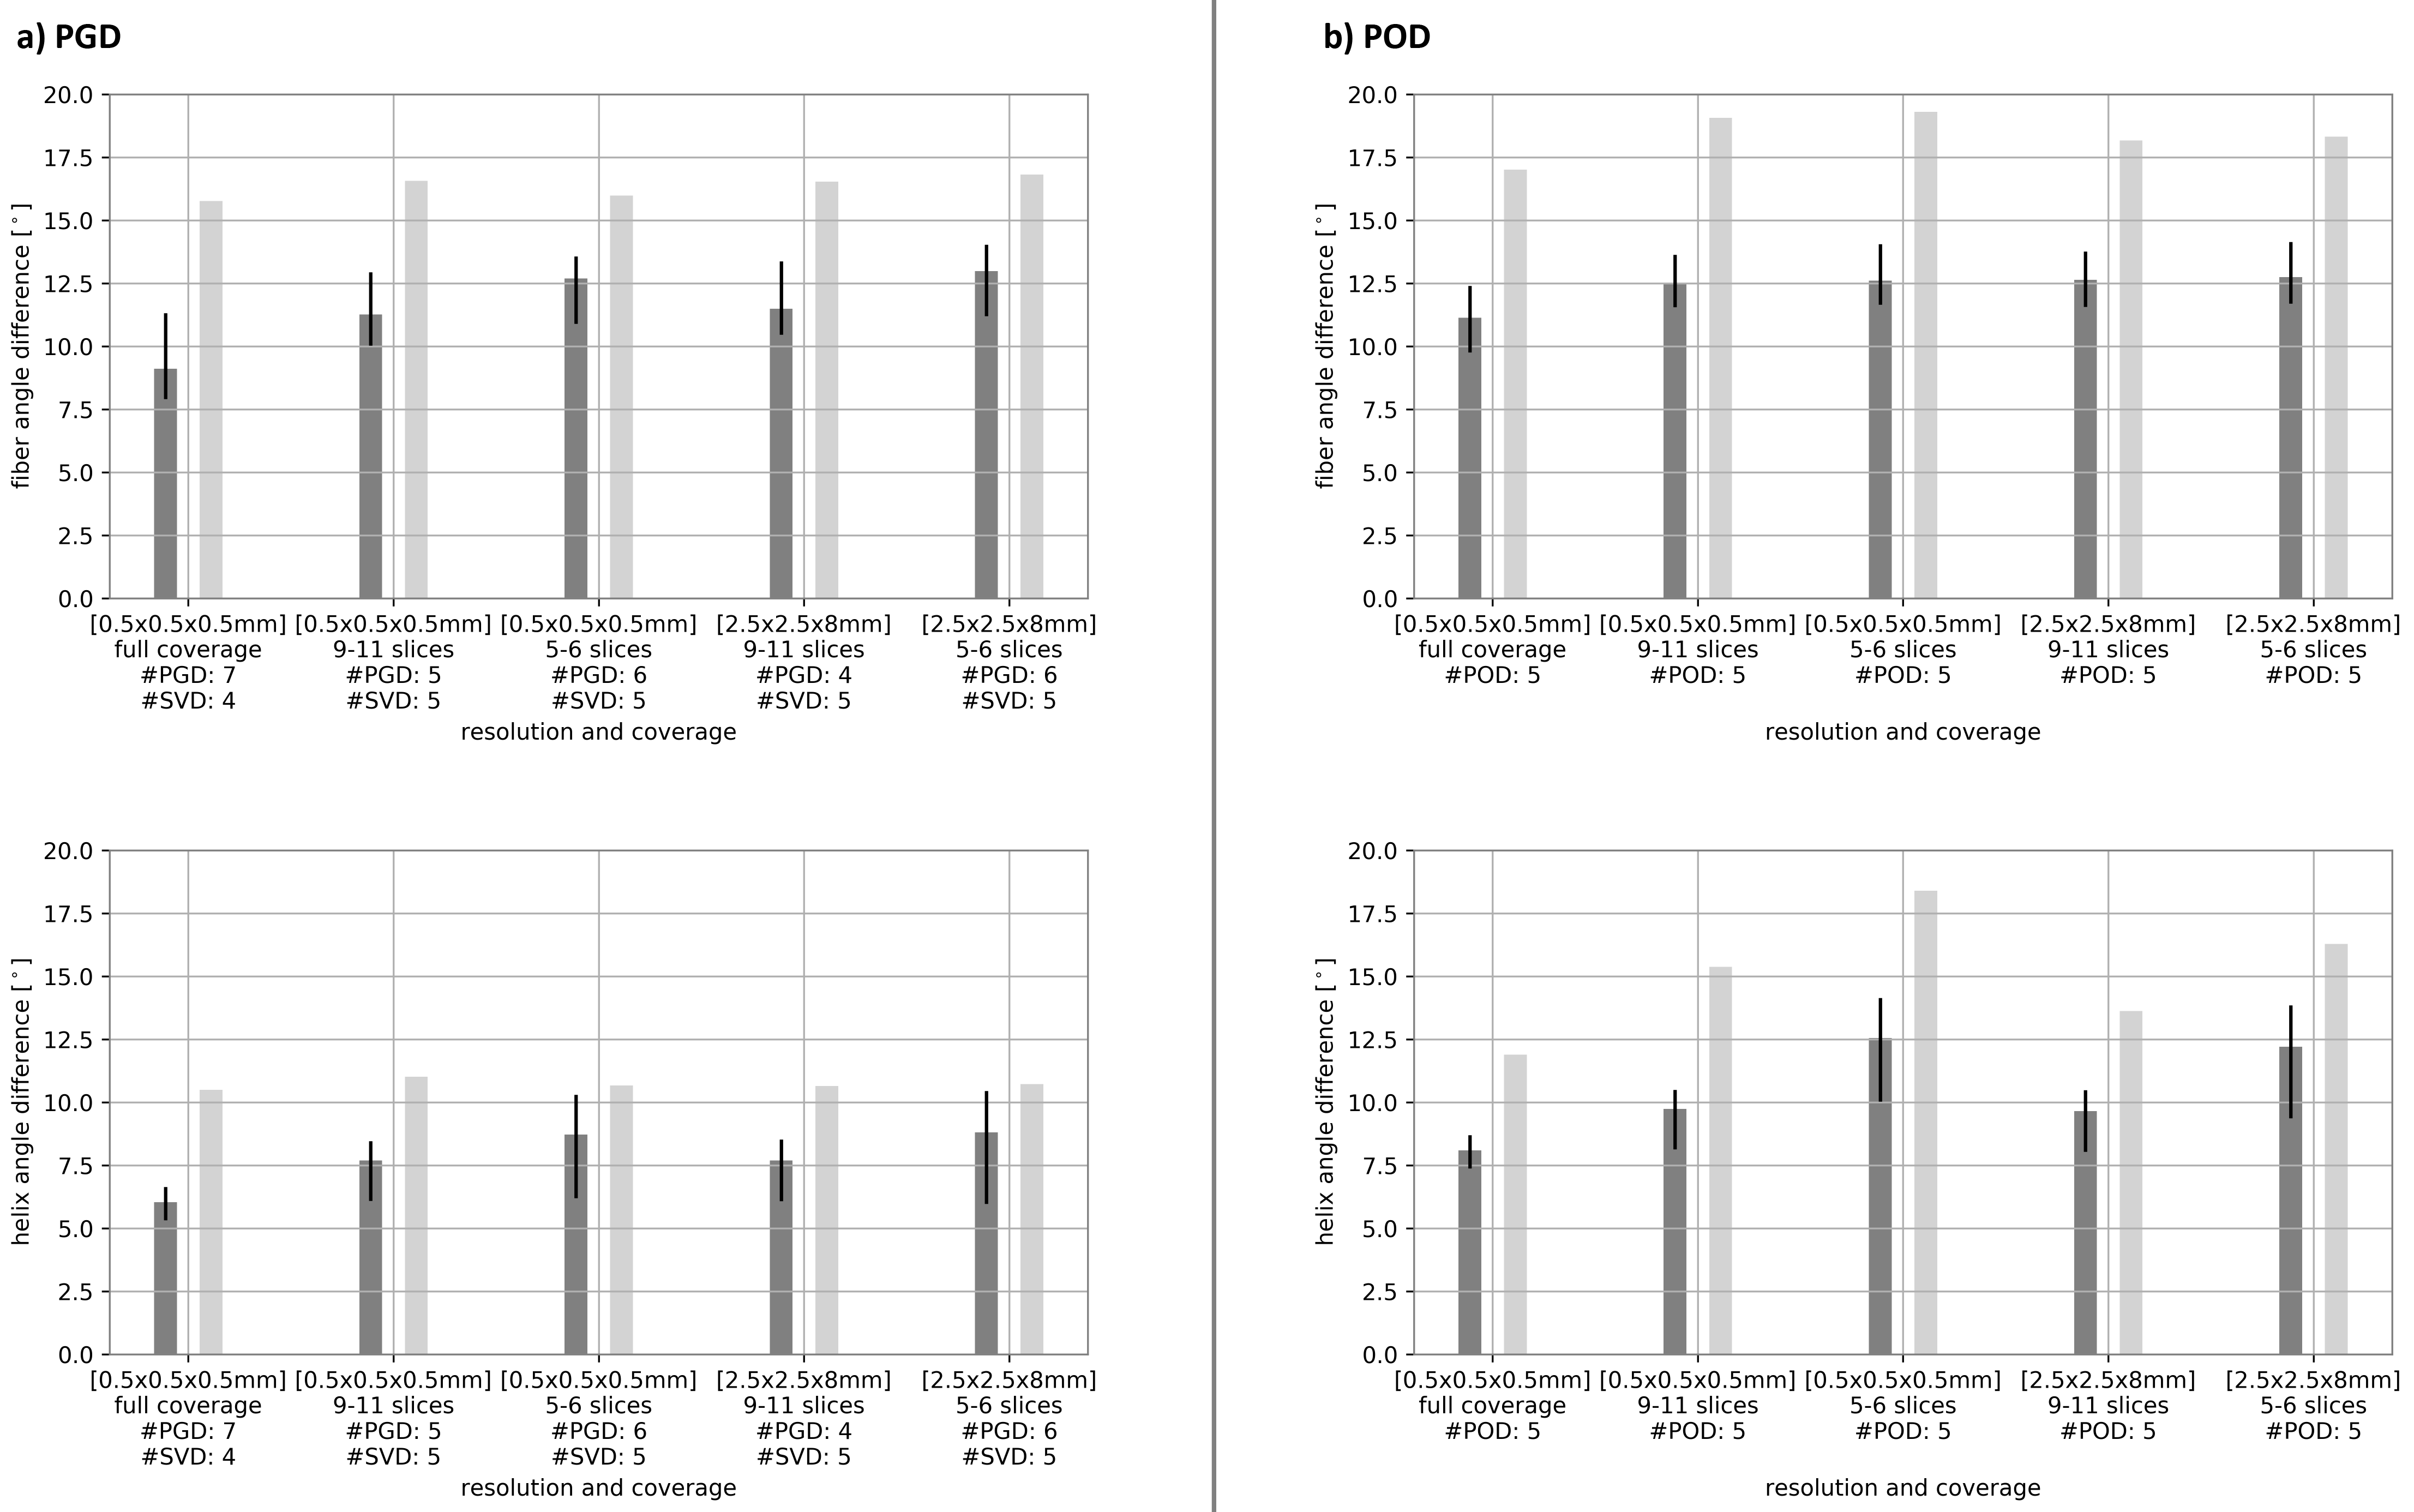
Figure 2 depicts the first mode extracted with both methods. Figure 3 shows the median of the angular difference between the measured and estimated fiber direction and helix angle8 for all hearts in the database and one additional test data set as function of the number of modes. The median of the angular difference, using the optimal number of modes is PGD: 9.1°±1.1/ POD: 11.1°±0.9 averaged across the database (mean±std) and PGD: 15.8°/ POD: 17.0° for the test data with the same mode configuration. Figure 4 compares the helix angle distribution from DTI with the reconstructions from PGD and POD. The POD approach shows over-smoothing at the endocardium. Figure 5 shows the angular differences reconstructing the datasets with reduced coverage (9-11/5-6 slices) and lower resolution 2.5x2.5x8mm3. For the datasets used to derive the PGD/POD modes, the fiber angle difference is below 14.5° for both parametrizations and the helix angle difference is below 10.5° and 14.2° for the PDG and POD, respectively, for all down-sampling schemes investigated. For the extrapolation of the test dataset the PGD approach performs better compared to POD.Discussion and Conclusion
We have shown that myocardial fiber orientation can be represented by a low-rank parametrization in shape-adapted coordinates. The spatial error distribution is heterogeneous and errors are predominantly localized at the endocardial and epicardial surfaces and in the apical region, which are particularly prone to partial-voluming and segmentation errors. The angle differences found in this study are below previously reported precision of in-vivo measurements (15.5° in systole and 31.9° in diastole)9 and shows the potential for low-rank microstructural parametrization in conjunction with a shape adapted coordinate system for data-denoising and interpolation or upsampling of sparse and low-resolution data.Acknowledgements
This work has been supported by the Swiss National Science Foundation (PZ00P2_174144)
References
1. Toussaint N, Stoeck CT, Schaeffter T, Kozerke S, Sermesant M, Batchelor PG. In vivo human cardiac fibre architecture estimation using shape-based diffusion tensor processing. Med Image Anal. 2013;17(8):1243-1255. doi:10.1016/j.media.2013.02.008
2. Genet M, Von Deuster C, Stoeck CT, Kozerke S. 3D myofiber reconstruction from in vivo cardiac DTI data through extraction of low rank modes. In: ISMRM 23rd Annual Meeting and Exhibition 2015. Toronto, Canada: MRM; 2015.
3. Bayer JD, Blake RC, Plank G, Trayanova NA. A novel rule-based algorithm for assigning myocardial fiber orientation to computational heart models. Ann Biomed Eng. 2012;40(10):2243-2254. doi:10.1007/s10439-012-0593-5
4. Doste R, Soto-Iglesias D, Bernardino G, et al. A rule-based method to model myocardial fiber orientation for simulating ventricular outflow tract arrhythmias. In: Lecture Notes in Computer Science (Including Subseries Lecture Notes in Artificial Intelligence and Lecture Notes in Bioinformatics). Vol 10263 LNCS. Springer Verlag; 2017:344-353. doi:10.1007/978-3-319-59448-4_33
5. Buoso S, Manzoni A, Alkadhi H, et al. Reduced-order modeling of blood flow for noninvasive functional evaluation of coronary artery disease. Biomechanics and Modeling in Mechanobiology; 2019; 18(6):1867-1881
6. Chinesta F, Keunings R, Leygue A. The Proper Generalized Decomposition for Advanced Numerical Simulations. Cham: Springer International Publishing; 2014. doi:10.1007/978-3-319-02865-1
7. Willcox K. Unsteady flow sensing and estimation via the gappy proper orthogonal decomposition. Comput Fluids. 2006;35(2):208-226. doi:10.1016/j.compfluid.2004.11.006
8. Stoeck CT, von Deuster C, Fleischmann T, Lipiski M, Cesarovic N, Kozerke S. Direct comparison of in vivo versus postmortem second-order motion-compensated cardiac diffusion tensor imaging. Magn Reson Med. 2018;79(4):2265-2276. doi:10.1002/mrm.26871
9. Aliotta E, Moulin K, Magrath P, Ennis DB. Quantifying precision in cardiac diffusion tensor imaging with second-order motion-compensated convex optimized diffusion encoding. Magn Reson Med. 2018;80(3):1074-1087. doi:10.1002/mrm.27107
Figures
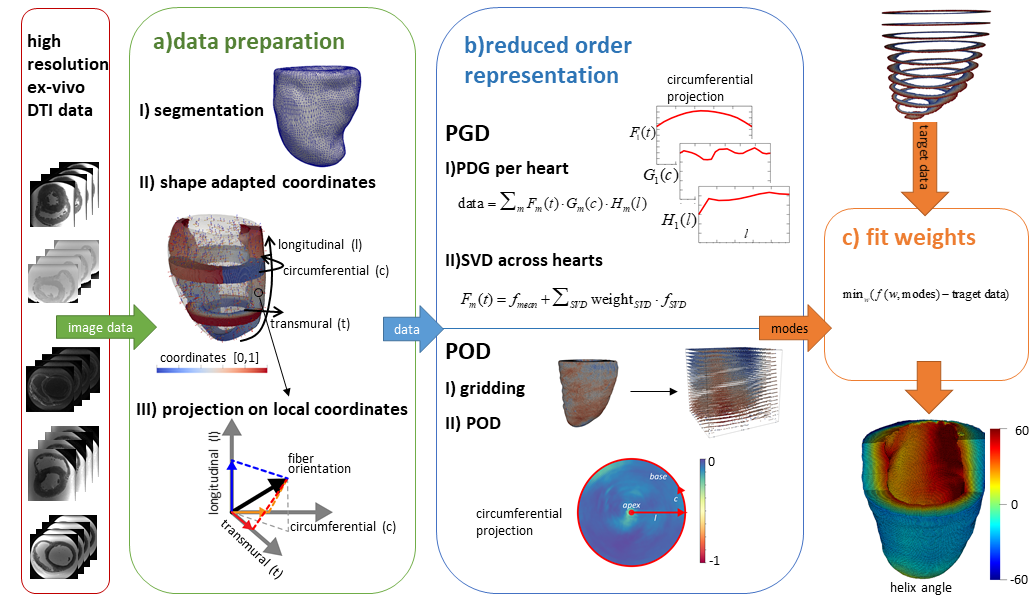
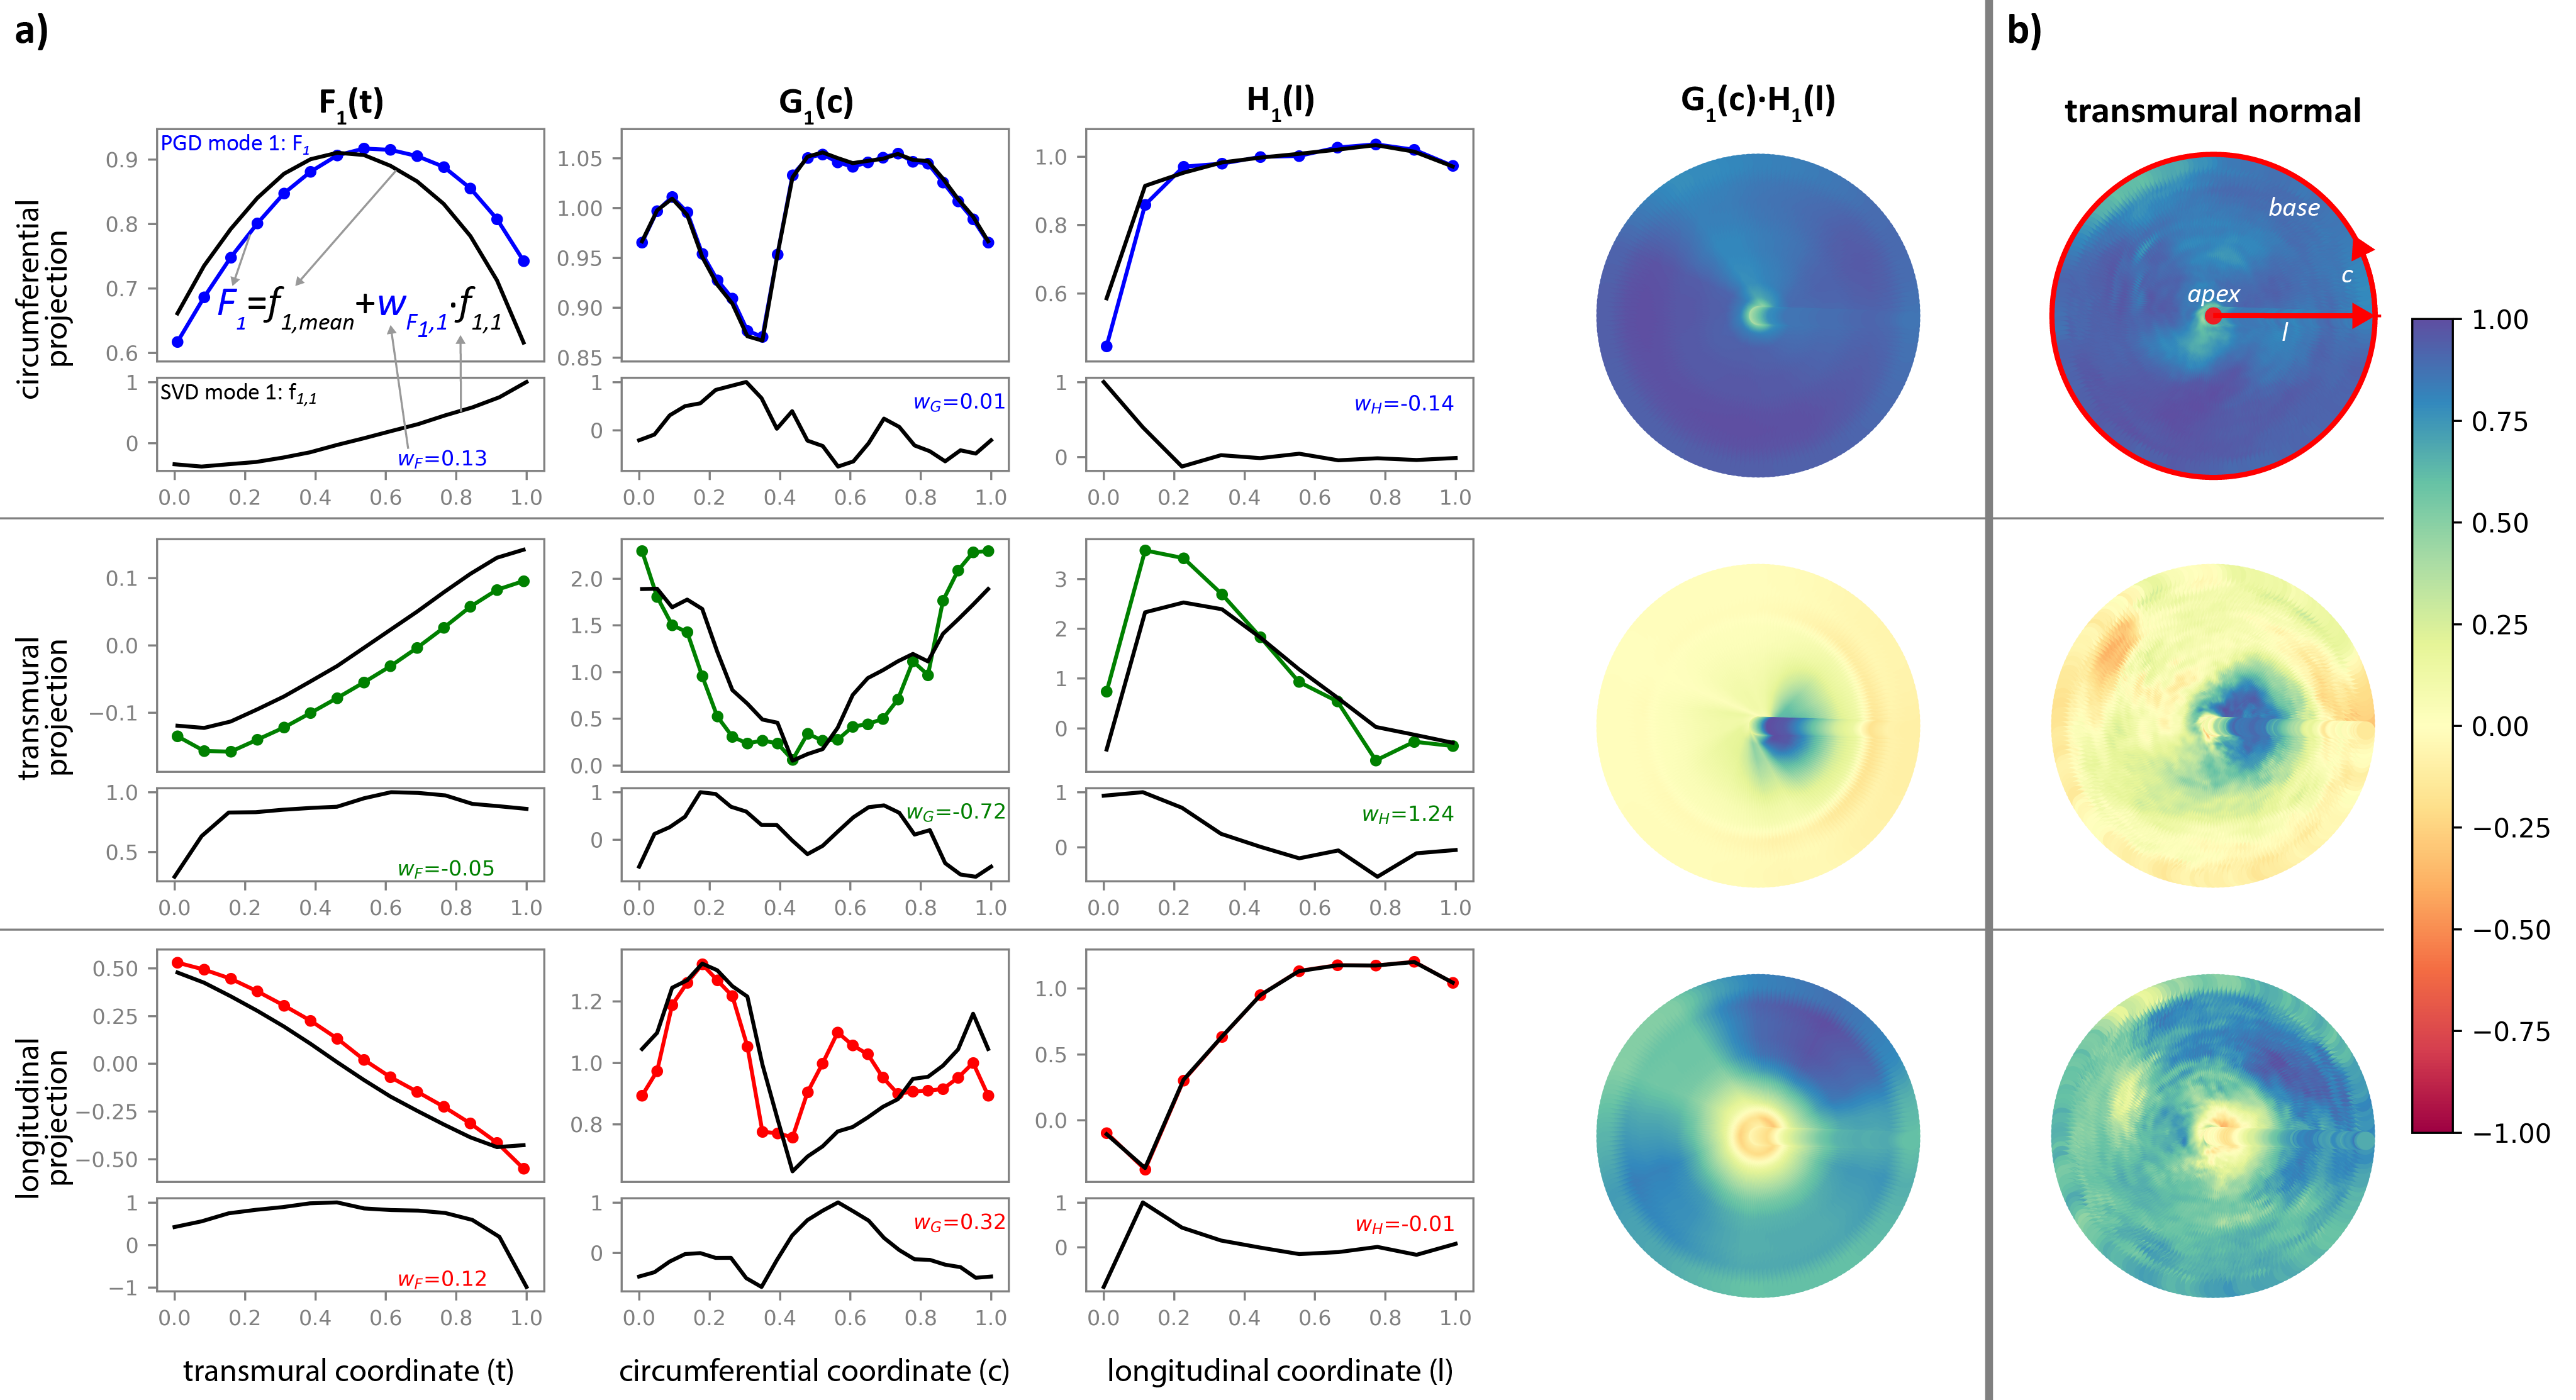
Figure 2: PGD mode 1 using 1 SVD mode (a) and POD mode 1 (b). The rows represent the projections of the diffusion tensor’s first eigenvector on the local coordinate system. The first PGD mode is the product of three 1D functions F(t), G(c) and H(l) represented by colored curves with the population mean as black curve in the upper plot for each projection. The first SVD mode used to parametrize F(t), G(c) and H(l) together with an exemplary weight for one heart is shown in the subplot below. Columns 4-5 show a 2D PGD mode reconstruction and the first 2D POD mode.
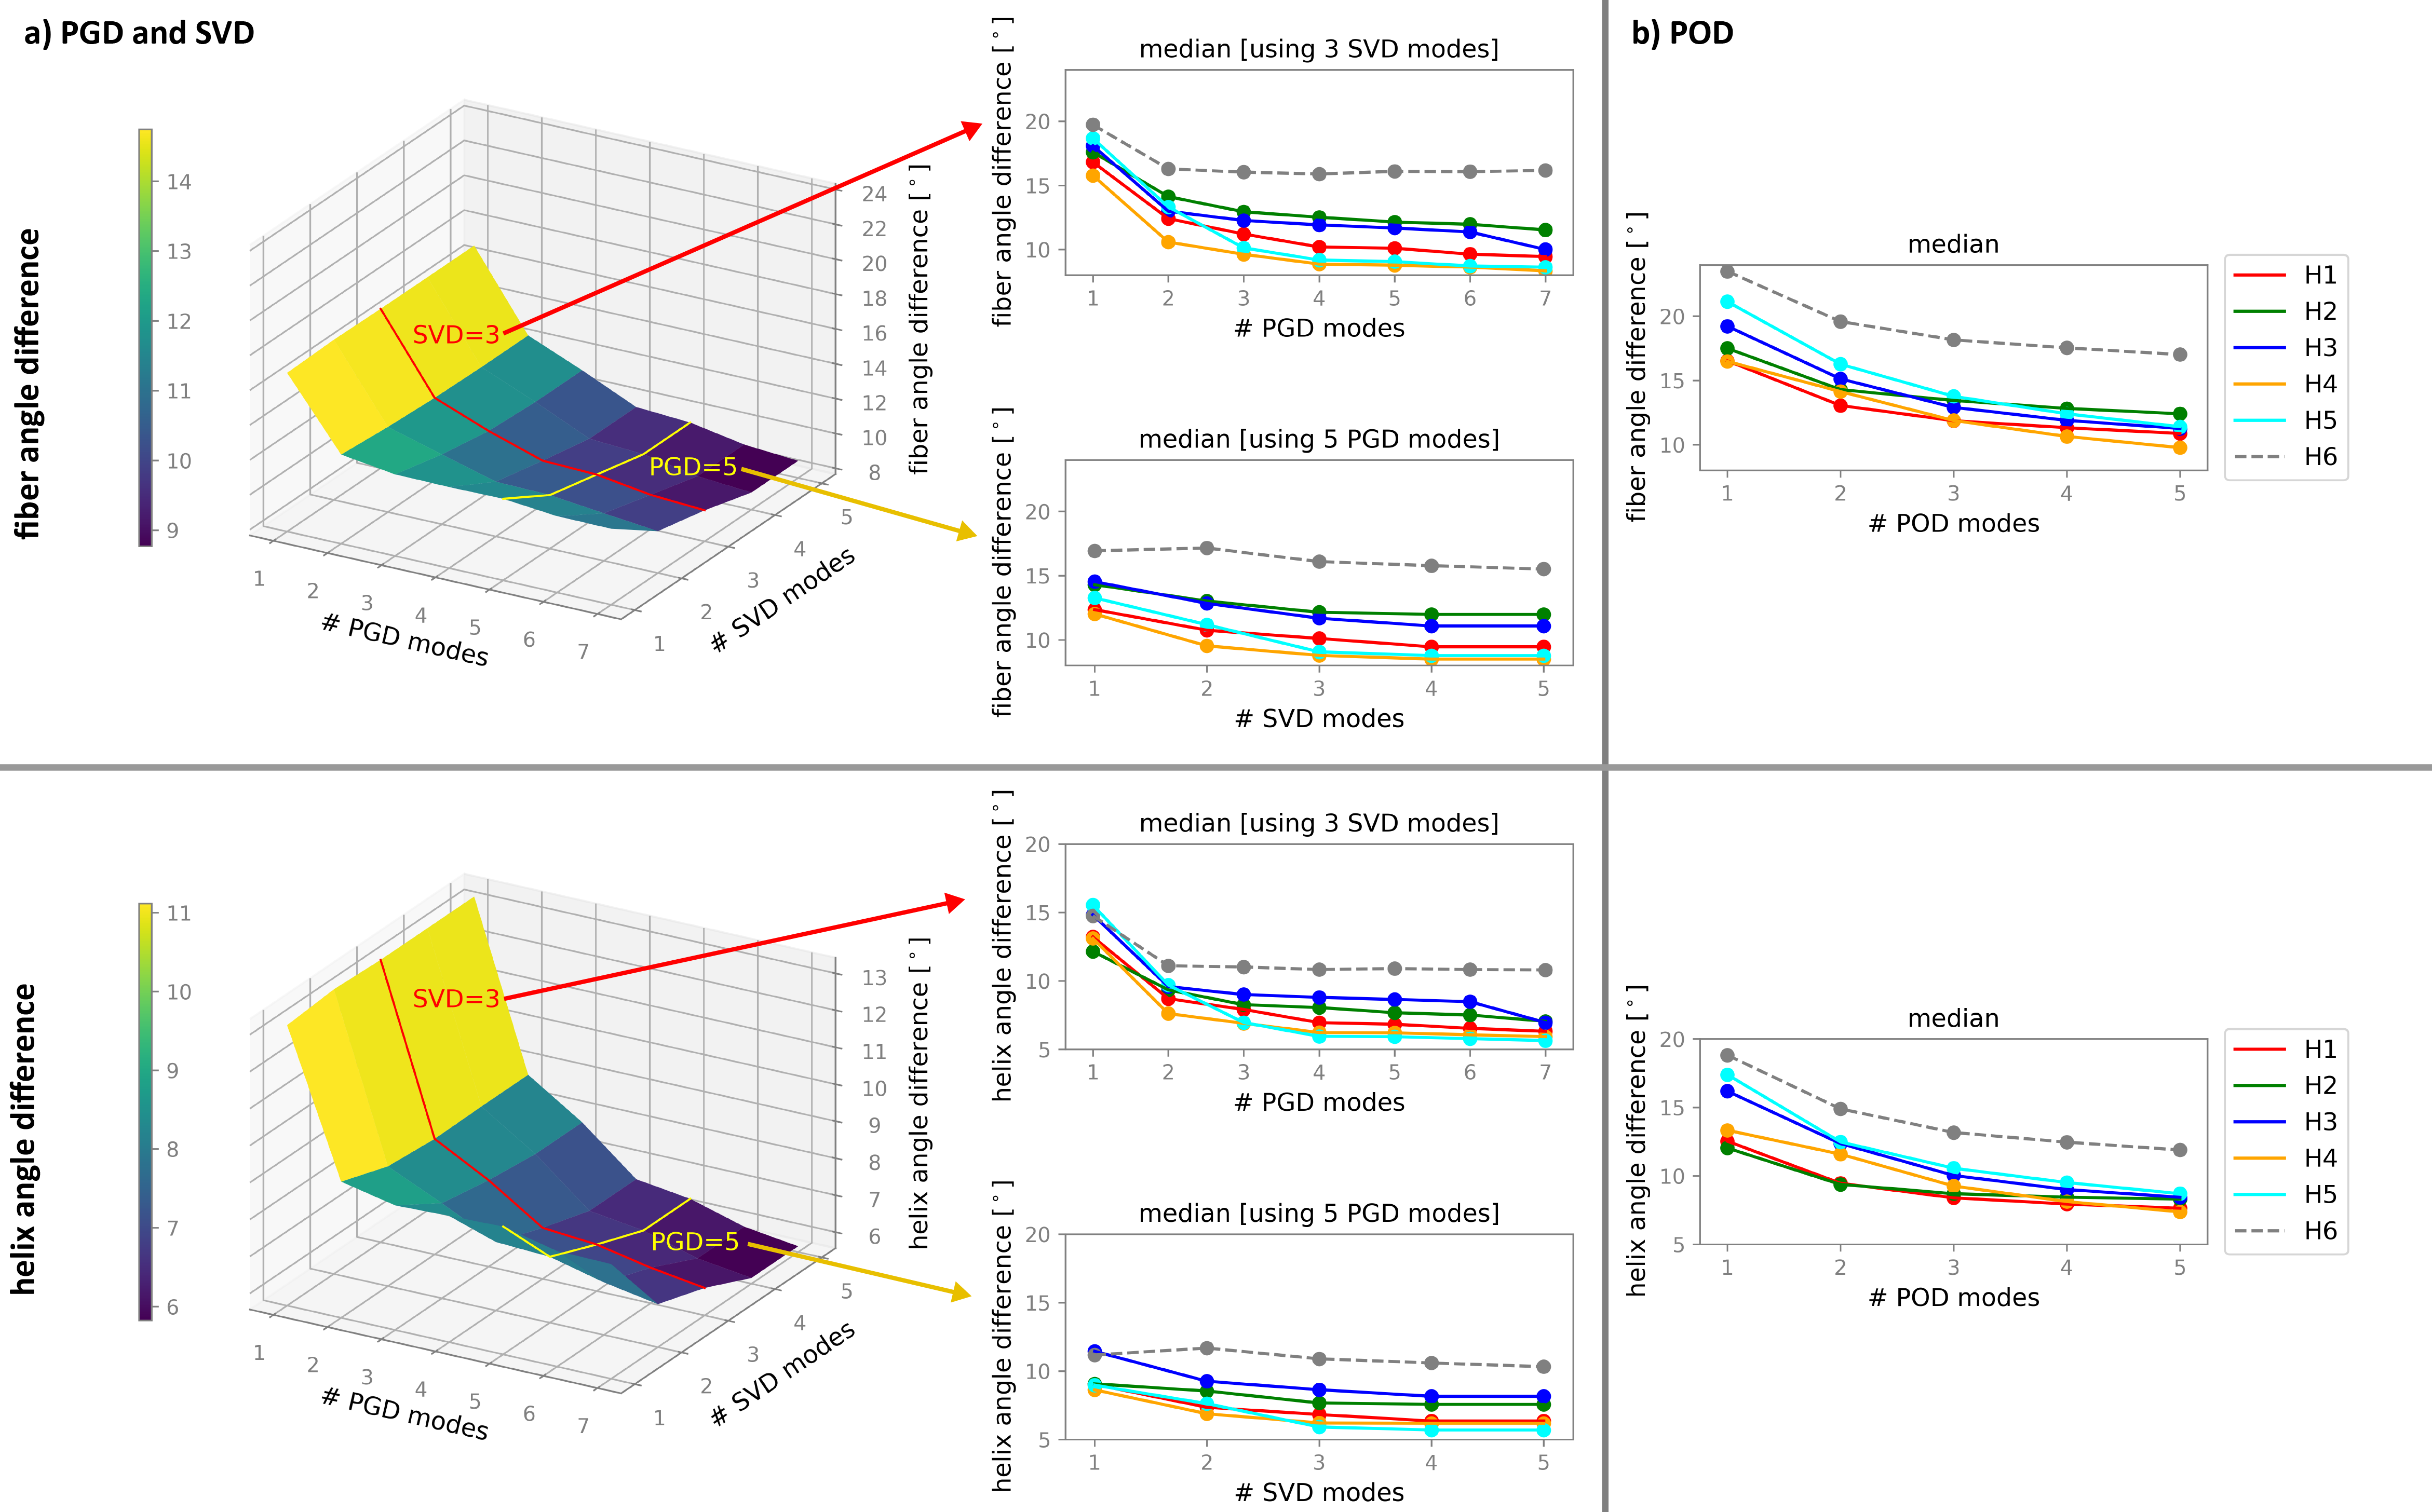
Figure 3: Median across the myocardium of the angular difference between measured and parametric fiber orientation using PGD&SVD (a) and POD (b) depending on the number of modes. The first and second rows show the fiber angle and helix angle differences, respectively. The left plots show the reconstruction error as function of number of PGD and SVD modes for one heart. The mid column shows the angles difference fixing the number of SVD or PGD modes for all hearts. The test dataset is represented by a dashed line. The corresponding variation over the number of POD modes is shown on the right.