0784
Cardiac MR fingerprinting with a short acquisition window in healthy volunteers and 62 consecutive patients referred for clinical CMR1Department of Radiology, Lausanne University Hospital (CHUV), Lausanne, Switzerland, 2Cardiology Service, Lausanne University Hospital (CHUV), Lausanne, Switzerland, 3Department of Radiology, University of Michigan, Ann Arbor, MI, United States
Synopsis
Cardiac magnetic resonance fingerprinting (cMRF) can be used to simultaneously acquire myocardial T1 and T2 maps in a single breath-hold. However, the common 250 ms acquisition window of cMRF might leave it vulnerable to motion artefacts. The goal of this study was therefore to compare the performance of cMRF with a short acquisition window (150ms) and low-rank reconstruction to that of routine cardiac parametric mapping techniques. In 7 healthy volunteers, and 62 cardiac patients, cMRF resulted in similar native relaxation times, but slightly different post-contrast T1 and ECV values compared to routine techniques.
Introduction
Cardiac magnetic resonance fingerprinting (cMRF[1]) has been demonstrated to be a robust and accurate T1 and T2 mapping technique. However, the common 250ms acquisition window of cMRF might leave it vulnerable to motion artifacts in patients with high heart rates. A shorter acquisition window would thus be desirable, especially if the loss in precision due to less acquired signal can be compensated with a low-rank reconstruction. The goal of this study was therefore to compare the accuracy and robustness of a cMRF sequence with a short acquisition window and low-rank reconstruction[2] to routine T1, T2, and ECV mapping techniques. The comparison was performed both in a small cohort of healthy volunteers and in a heterogeneous group of consecutive patients referred for clinical CMR.Methods
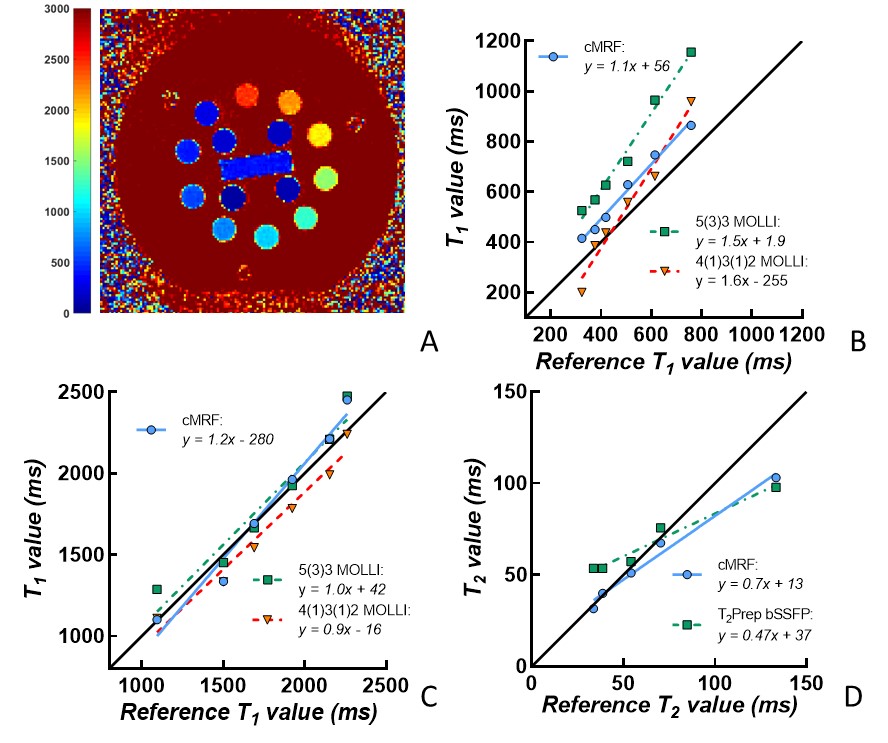
The accuracy of cMRF with a short acquisition window was first compared to reference and clinical routine parameter mapping techniques (MOLLI[3]; T2-prepared bSSFP[4]) in the ISMRM-NIST phantom (QalibreMD) at 1.5T (Sola, Siemens). Reference T1 and T2 relaxation times were obtained with inversion-recovery TSE and multi-echo SE, respectively. Due to the sensitivity of the routine cardiac T2 mapping sequence to short T1 values, only those spheres with T1>500ms were taken into the T2 analysis. In vivo, cMRF was performed with the following parameters in both subject groups: 29 readouts/heartbeat, duration 15 heartbeats, pixel size=1.6x1.6mm2, slice thickness=8mm3, acquisition window=150ms. For each slice, a heart-rate dependent low-rank dictionary was created and used to reconstruct the parametric maps. The dictionaries were designed to take the slice excitation profile and B1+ inhomogeneity into account [2]. The human study was approved by the Institutional Review Board, and participants provided informed consent. In the healthy volunteers group (n=7, average age=27, 80% female), routine T1 and T2 maps and cMRF were acquired at three short-axis and a four-chamber orientation. In consecutive patients referred for CMR (n=62, average age=58y, 30% female), routine native T1 (n=62) and T2 (n=12) mapping as well as cMRF (n=62) were acquired in one basal slice; routine T1 mapping (n=47) and cMRF (n=47) were also performed 20-25 minutes after gadolinium injection (0.2 ml/kg Dotarem). The parameter maps were manually segmented, and the synthetic ECV was calculated[6]. Linear regression against the reference values was used to assess accuracy in the phantom, while Student’s t-tests and Bland-Altman analyses were used to assess differences between routine techniques and short acquisition window cMRF in vivo.Results
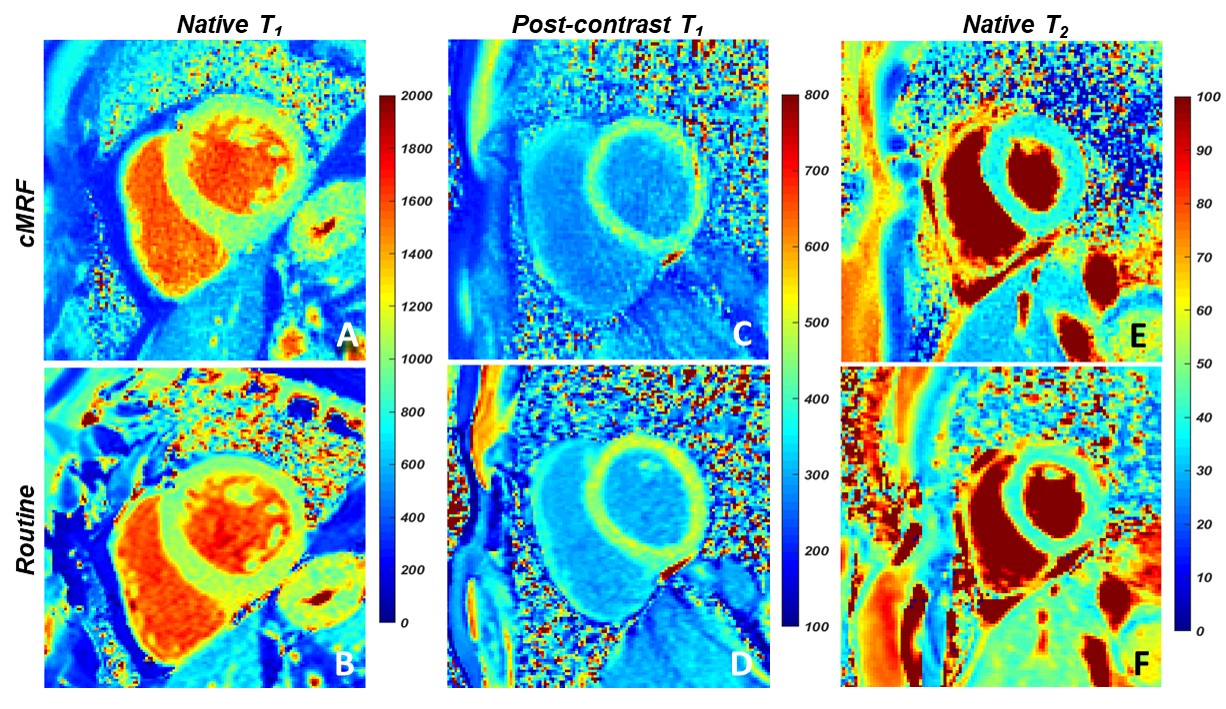
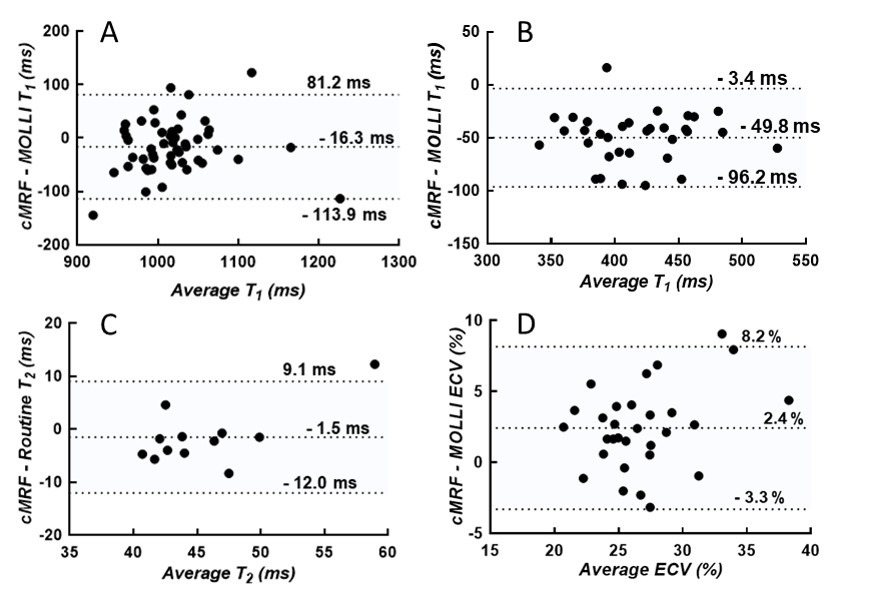
The phantom mapping demonstrated similar or higher T1 and T2 accuracy of the cMRF over a wider range than the routine mapping techniques (Fig.1). In the healthy volunteers (Table 1), the cMRF myocardial T1 and T2 values showed small but non-significant differences compared to MOLLI (cMRF: 1019±90ms; Routine: 1001±48ms, p=0.28) and T2-prepared bSSFP (cMRF: 43±4ms; Routine: 46±4ms, p=0.02). In the patients, both the native T1 (cMRF: 1011±61ms; Routine: 1028±56ms, P=0.17) and T2 (cMRF: 44±7ms; Routine: 46±3ms, p=0.53) values confirmed the good agreement (Fig.2). However, post-contrast myocardial T1 values (Fig.2C-D, Fig.3B) were lower than the routine values (cMRF: 391±43ms; Routine: 441±43ms, p<0.001), while the blood pool values did not differ (cMRF: 268±42ms; Routine: 282±47ms, p=0.23). This was then reflected by slightly higher estimations of the synthetic ECV (cMRF: 28±4%; Routine: 26±3%; p=0.02).Discussion
cMRF with a short acquisition window and low-rank reconstruction performed similarly or better than routine techniques when tested against reference relaxation times obtained from the NIST phantom. In vivo, the overall average cMRF and routine relaxation times appeared to be highly similar in healthy volunteers and patients. The small but significant T2 difference observed in healthy volunteers might be due to the small sample size. The difference in post-contrast myocardial T1 is more significant, and might for example be caused by partial volume effects, through-plane motion, or a T2 influence on the 4(1)3(1)2 MOLLI fit[7]. These findings warrant that ECV be measured with cMRF in a cohort of healthy volunteers in order to establish healthy reference values. Overall, we conclude that in 62 consecutive patients, cMRF with a short acquisition window and low-rank reconstruction resulted in comparable native cardiac T1 and T2 values when compared to routine techniques, but resulted in slightly different post-contrast myocardial T1 and ECV estimations.Acknowledgements
Swiss Heart Foundation and Swiss National Science Foundation (32003B_182615)References
1. Y. Liu et al., JACC: Cardiovascular Imaging. 2018; 11(12), 1837–1853
2. J. I. Hamilton et al., Magn. Reson. Imaging. 2018; 53(May), 40–51
3. D. R. Messroghli et al., Magn Reson Med. 2004, 52(1):141-6
4. T. Y. Huang et al., Magn. Reson. Imaging. 2007; 57(5), 960–966
5. M. D. Cerqueira et al., Circulation. 2002; 105(4), 539–542
6. T.A. Treibel et al., JACC: Cardiovascular Imaging. 2016; 9(1), 54–63
7. P. Kellman et al., J. Cardiovasc. Magn. R. 2014; 16(1), 1–20.
Figures