0782
A Joint Multi-Scale Variational Neural Network for Accelerating Free-breathing Whole-Heart qBOOST-T2 mapping1Biomedical Engineering Department, School of Biomedical Engineering and Imaging Sciences, King's College London, London, United Kingdom, 2Pontificia Universidad Católica de Chile, Santiago, Chile
Synopsis
T2 mapping is a promising technique for the characterization of myocardial inflammation and oedema. We recently proposed a quantitative 3D whole-heart sequence (qBOOST-T2) which provides co-registered 3D high-resolution bright-blood and T2 map volumes from a single free-breathing scan. However, high-resolution qBOOST-T2 requires long scan times of ~10 min. Here we propose a joint Multi-Scale Variational Neural Network (jMS-VNN) to enable the acquisition of 3D high-resolution bright-blood and accurate T2 map volumes in ~3 mins, and their reconstruction in ~30s. The proposed jMS-VNN jointly reconstructs data from multiple contrasts and efficiently apply dictionary-based signal matching for fast T2 map generation.
INTRODUCTION
T2 mapping is a promising technique for the characterization of myocardial inflammation and oedema1. Conventional 2D T2 mapping is performed under several breath-holds with limited spatial resolution and coverage. We recently introduced a novel accelerated quantitative 3D whole-heart sequence2 (qBOOST-T2) which provides co-registered high-resolution 3D bright- blood and T2 map volumes from a single free-breathing scan. qBOOST-T2 relies on image-navigators3 (iNAVs) to achieve 100% respiratory efficiency and predictable scan time. However, high-resolution qBOOST-T2 still requires long acquisition times of ~10 min for 3-fold acceleration (~30 mins for fully sampled acquisition). Here we propose a joint Multi-Scale Variational Neural Network (jMS-VNN) to enable the acquisition of qBOOST-T2 in ~3 mins. This is achieved by extending a novel joint Multi-Scale Variational Neural Network4-5 (jMS-VNN) to jointly reconstruct data from multiple contrasts and to efficiently apply dictionary-based signal matching6 for fast T2 map generation, enabling qBOOST-T2 reconstruction in ~30 seconds. All parameters of this formulation, including the reconstruction parameters, are learned during the offline training procedure. The proposed approach is evaluated for undersampling factor of 9-fold in 4 healthy subjects in comparison to iterative SENSE7 (it-SENSE) and Wavelet-based Compressed Sensing (CS)8 reconstruction.METHODS
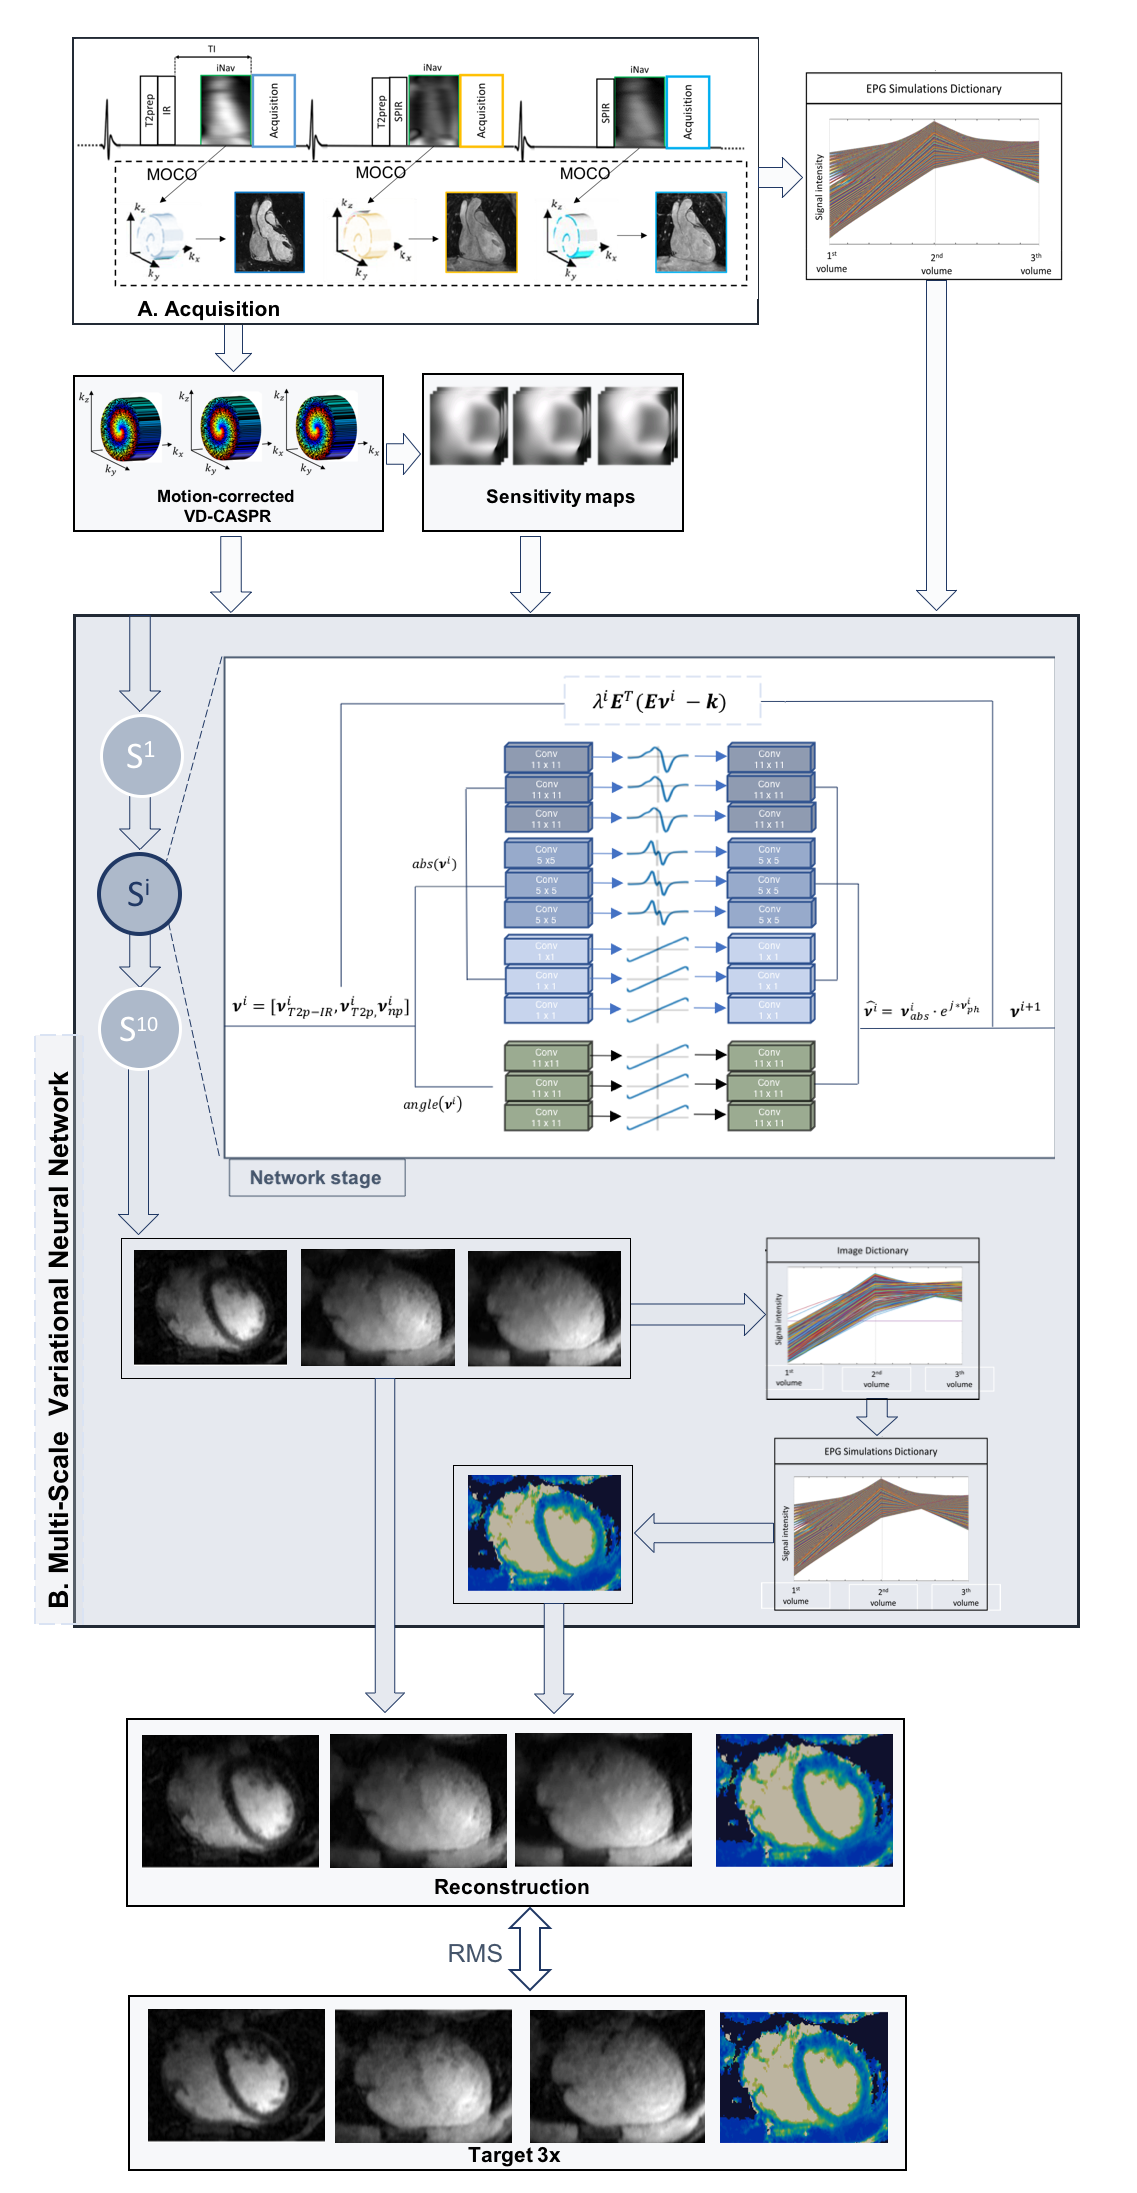
Acquisition: The framework of the 3D qBOOST-T2 sequence is shown in Fig. 1A. Three interleaved bSSFP bright-blood volumes are acquired with a Variable Density Cartesian trajectory with spiral profile order9. A T2-prepared inversion recovery (T2prep-IR) module is applied prior to the first dataset acquisition. T2-preparation is performed prior to the second volume (T2prep), whereas the third volume is acquired with no preparation. iNAVs are aquired at each heartbeat to estimate and correct for foot-head and right-left translational motion. Fourteen healthy subjects were scanned on a 1.5T scanner (Siemens Magnetom Aera). 3D qBOOST-T2 acquisition parameters included: resolution 1x1x2mm3 (reconstructed to 1mm3 isotropic), FOV 320x320x88-120mm3, subject specific diastolic trigger-delay and acquisition window (90-104ms), flip-angle 90o, T2prep 1st-heartbeat 50ms, T2prep 2nd-heartbeat 30ms, TI 110ms. Acquisitions were performed with an undersampling factor of 3x (all subjects) and 9x (4 subjects). Conventional T2prep-based 2D bSSFP T2 mapping sequences were acquired in 3 short axis views in all subjects for comparison purposes: resolution 1.8x1.8x8mm in a ~10sec breath-hold for each slice.jMS-VNN Architecture: Translational motion corrected undersampled k-space data for the 3 different contrasts and coil sensitivity maps are stacked in the channel dimension and provided as input to the jMS-VNN. In each of the 10 stages of the network, the initial reconstruction is updated according to the joint variational scheme in Fig.1B. A first path enforces data consistency with the motion corrected undersampled k-space data. The second path is a regularization operator that jointly applies two parallel sets of real-valued filter kernels and corresponding activation functions to the magnitude and phase of the complexed-valued images. For the magnitude image, a multi-scale approach is applied with 3 parallel sets of 11x11, 5x5 and 1x1 filters. A joint reconstruction is performed by sharing the parameters (at every stage) along the channel dimension. EPG simulations6, matching the acquisition parameters, are carried out to generate a subject-specific signal evolution dictionary that is given as an additional input to the network. T2 maps are then generated within the network by matching each measured signal evolution to the closest dictionary entry.
MS-VNN Training: All parameters of this formulation, including the filter kernels, activation functions and data term weights, are learned during an offline training procedure. The network was trained on 2D complex-valued images obtained from retrospectively undersampled 9-fold T2prep-IR, T2prep and no-preparation data from 10 subjects (7200 images). During the training procedure, the output of the jMS-VNN is compared to the corresponding 3-fold accelerated reference images (reconstructed with SENSE) and corresponding T2 maps. The root mean-squared error was used as loss function.
Experiments: 9-fold prospectively undersampled data of 4 healthy subjects (not included in the training) were used to evaluate the framework. The proposed jMS-VNN approach was compared to it-SENSE7 and CS8 reconstruction, and to the 3-fold accelerated reference images, in terms of image quality and septal T2 quantification.
RESULTS
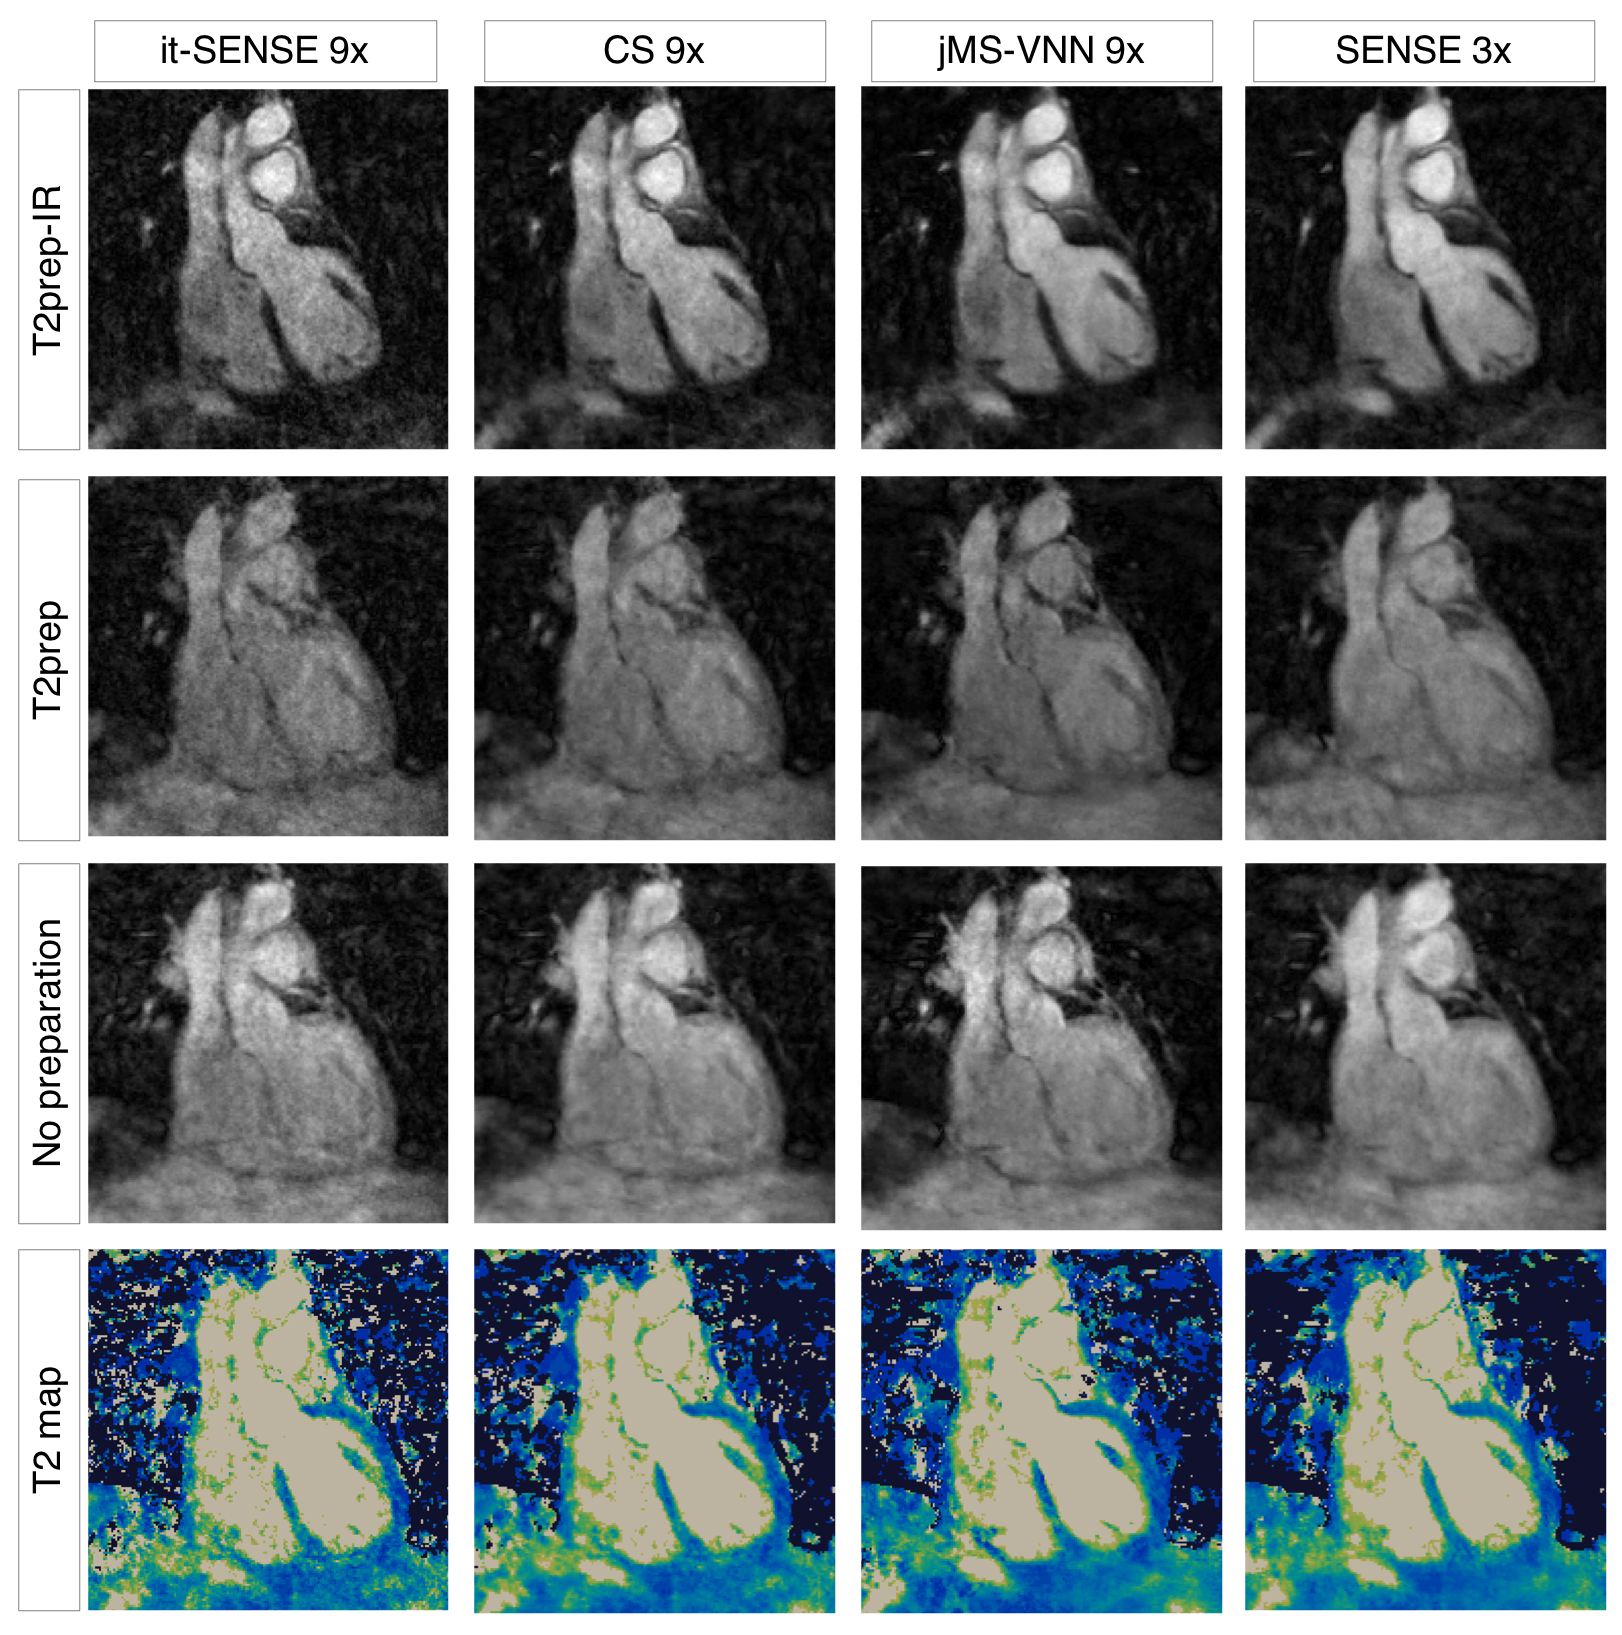
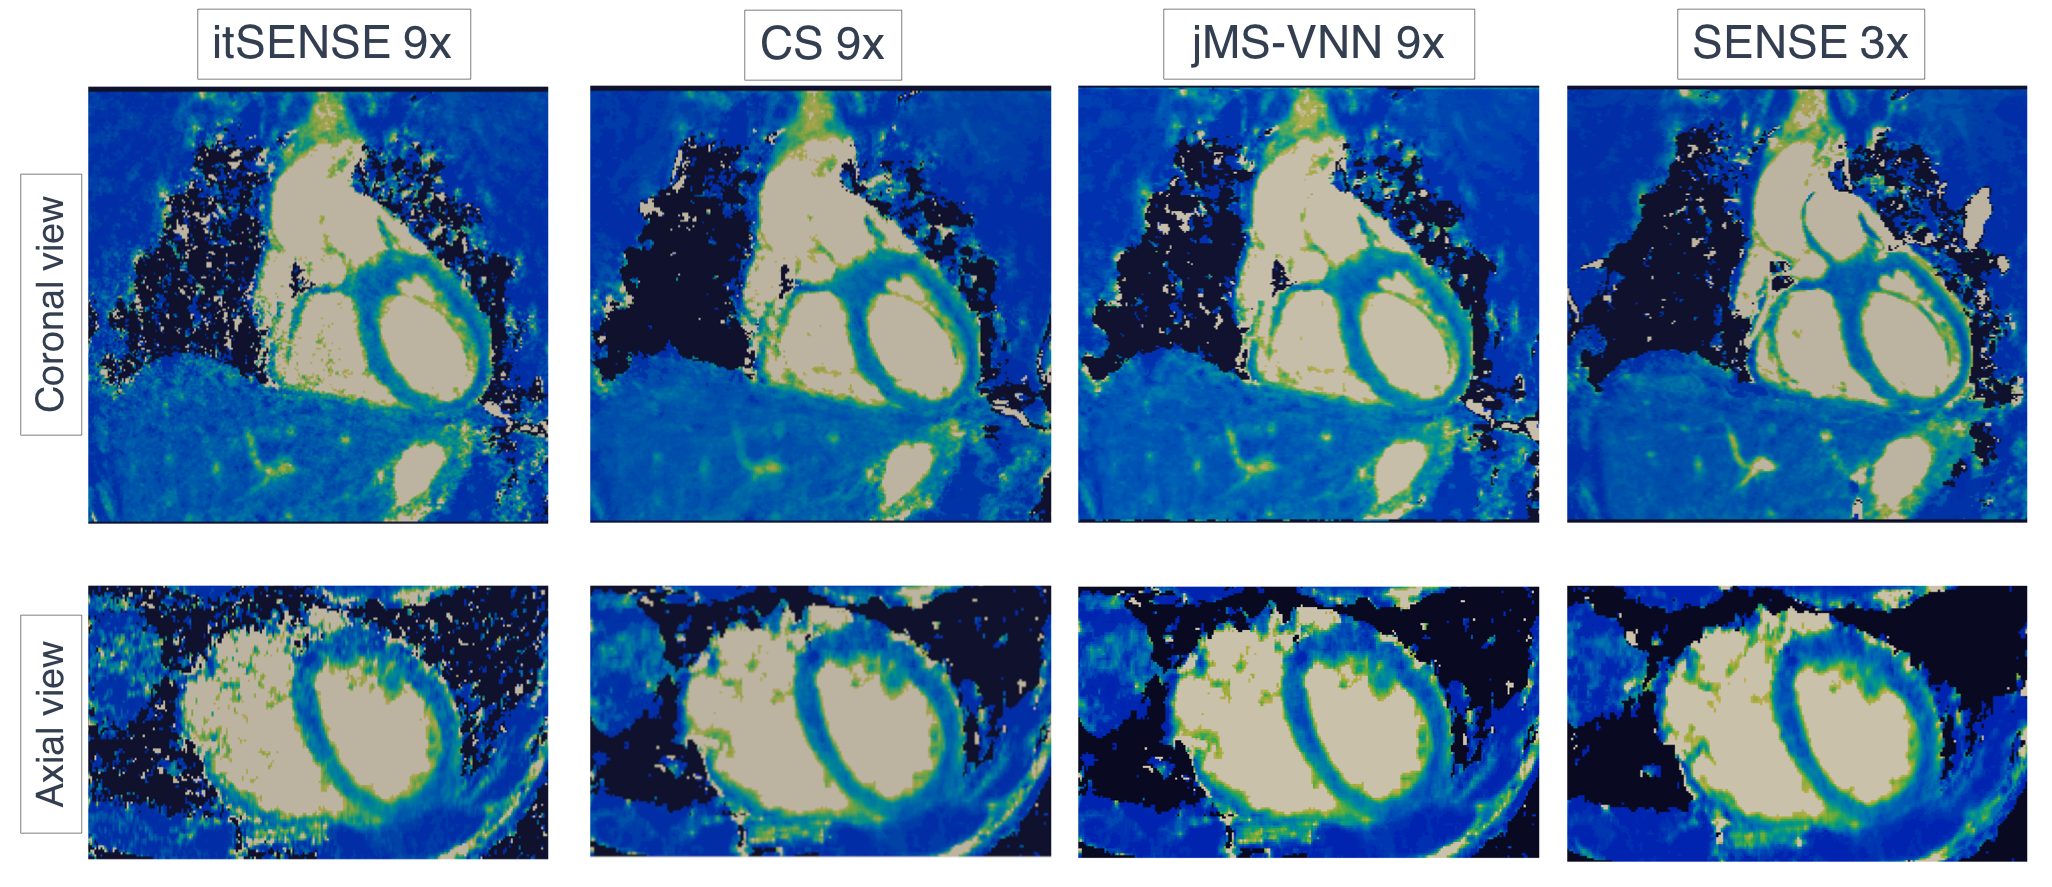
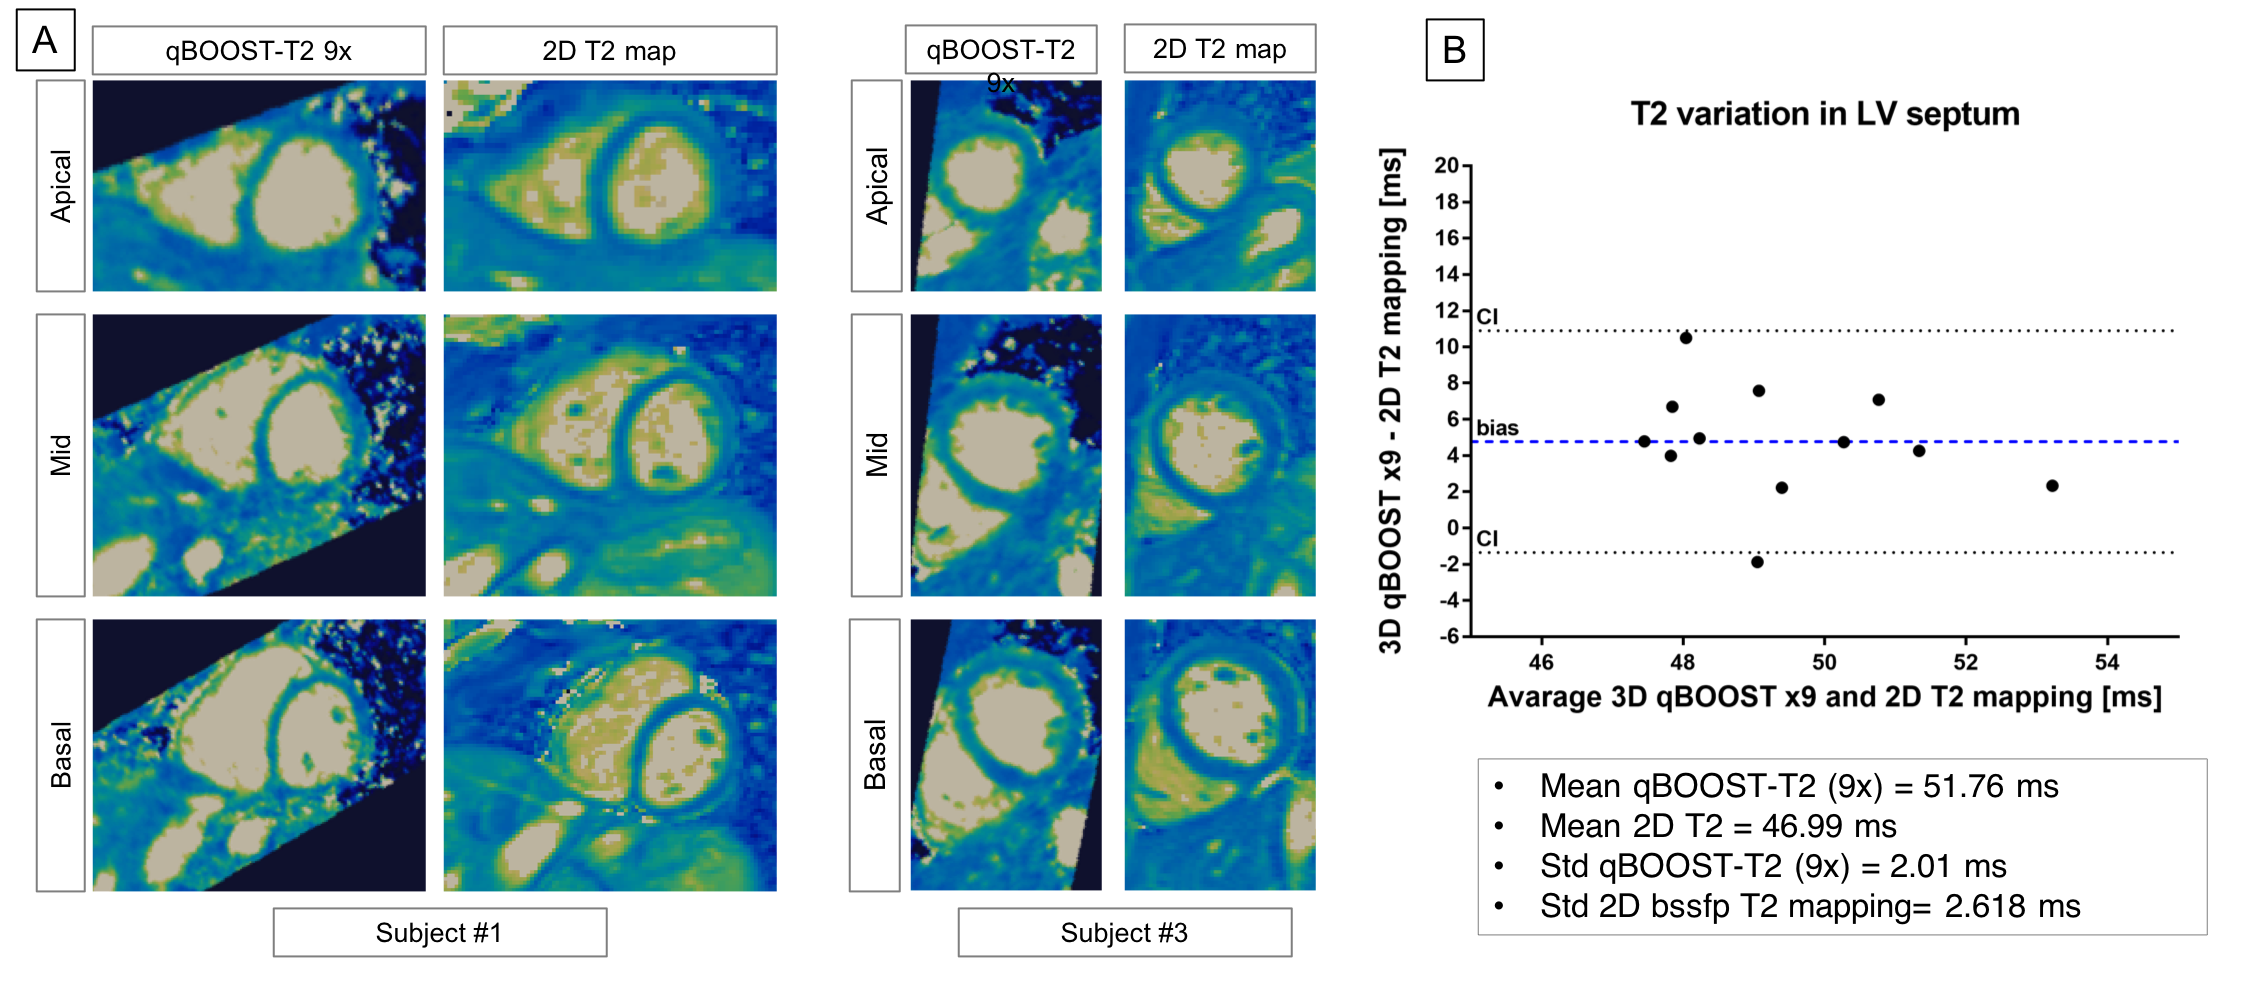
The average scan time was 3min±30sec with 100% respiratory scan efficiency. The average time for image reconstruction and T2 map generation was ~16 mins for CS and ~30s for jMS-VNN reconstructions. 3D co-registered T2prep-IR, T2prep and no preparation volumes for one representative healthy subject are presented in Fig. 2. Corresponding 3D T2 maps obtained with it-SENSE, CS and jMS-VNN are presented in Fig. 3. The proposed jMS-VNN framework presents higher image quality than it-SENSE7, and CS8 for both bright- and T2 map images. Reformatted short-axis T2 maps obtained with the proposed approach and reference standard 2D T2 maps are shown in Fig. 4A and quantitatively compared in Fig. 4B . A representative T2 map volume obtained with the proposed approach is shown in Fig. 5.DISCUSSION
The combination of a highly accelerated qBOOST-T2 with a novel jMS-VNN reconstruction framework allows the acquisition of 3D co-registered high-resolution bright-blood volumes and T2 maps for comprehensive assessment of cardiovascular disease in a clinically feasible scan time of ~3min and their reconstruction in ~30s. Preliminary results showed good agreement in T2 quantification between the proposed approach and reference standard 2D T2 mapping.Acknowledgements
This work was supported by EPSRC (EP/P001009, EP/P007619, EP/P032311/1) and Wellcome EPSRC Centre for Medical Engineering (NS/A000049/1).References
1. Montant P, et al. MR imaging assessment of myocardial edema with T2 mapping. Diagn Interv Imag. 2015;96:885–890.
2. Milotta G, et al. 3D Whole-heart free-breathing qBOOST-T2 mapping. Magn Reson Med. 2019, Oct 21. doi:10.1002/mrm.28039.
3. Henningsson M, et al. Whole-heart coronary MR angiography with 2D self-navigated image reconstruction. Magn Reson Med. 2012;67:437–445.
4. Hammernik K, et al. Learning a variational network for reconstruction of accelerated MRI data. Magn Reson Med. 2018;79:3055–3071.
5. Fuin N, et al. A Variational Neural Network for Accelerating Free-breathing Whole-Heart Coronary MR Angiography. ISMRM 2019, p 0478, Montreal, Canada.
6. Weigel M, Extended phase graphs: Dephasing, RF pulses, and echoes - pure and simple. J Magn Reson Imag. 2015;41:266–295.
7. Pruessmann KP, et al. Advances in sensitivity encoding with arbitrary k-space trajectories. Magn Reson Med. 2001;46:638 – 651.
8. Lustig M, et al. Sparse MRI: The application of compressed sensing for rapid MR imaging. Magn Reson Med. 2007;58(6):1182–1195.
9. Prieto C, et al. Highly efficient respiratory motion compensated free-breathing coronary MRA using golden-step Cartesian acquisition. J Magn Res Imag. 2015;41:738–746.
Figures