0778
n-Standard deviations from remote is unreliable for scar quantification – evaluation using multicenter multivendor clinical trial data
Einar Heiberg1,2, Henrik Engblom1, Marcus Carlsson1, David Erlinge3, Dan Atar4, Anthony H Aletras1,5, and Hakan Arheden1
1Department of Clinical Sciences Lund, Clinical Physiology, Skåne University Hospital, Lund University, Lund, Sweden, 2Lund University, Wallenberg Center for Molecular Medicine, Lund, Sweden, 3Lund University, Department of Clinical Sciences Lund, Cardiology, Skåne University Hospital, Lund, Sweden, Lund, Sweden, 4Department of Cardiology, Oslo University Hospital Ullevål, and Instititute of Clinical Sciences, University of Oslo, Oslo, Norway, 5School of Medicine, Aristotele University of Thessaloniki, Laboratory of Computing, Medical Informatics and Biomedical – Imaging Technologies, Thessaloniki, Greece
1Department of Clinical Sciences Lund, Clinical Physiology, Skåne University Hospital, Lund University, Lund, Sweden, 2Lund University, Wallenberg Center for Molecular Medicine, Lund, Sweden, 3Lund University, Department of Clinical Sciences Lund, Cardiology, Skåne University Hospital, Lund, Sweden, Lund, Sweden, 4Department of Cardiology, Oslo University Hospital Ullevål, and Instititute of Clinical Sciences, University of Oslo, Oslo, Norway, 5School of Medicine, Aristotele University of Thessaloniki, Laboratory of Computing, Medical Informatics and Biomedical – Imaging Technologies, Thessaloniki, Greece
Synopsis
The purpose of this study is to systematically evaluate sources to variability in the n-SD from remote method for infarct quantification. Remote ROI position, size, and number of standard deviations all to a large extent affected infarct size. The main driver of infarct variability in the n-SD method are the differences in myocardial SD level, that varies between subjects, site and vendors. Based on the source of variability in infarct size we conclude the n-SD method lack accuracy for infarct quantification, especially in multi-center, multi-vendor setting.
INTRODUCTION
Cardiac MR late gadolinium enhancement (LGE) is considered the gold standard for in vivo myocardial infarct quantification. There are a multitude of methods for infarct quantification such as manual planimetry, standard deviations from remote (n-SD)1-3, Full Width Half Maximum (FWHM)4,5 Otsu6, expectation maximization (EWA)7, level set methods6, Gaussian mixture model classification8. The latest consensus document from the Society of Cardiovascular Magnetic Resonance (2013) refrains from making a statement regarding the optimal method for infarct quantification as evidence is still being accumulated9. Thus, the purpose of this study was to build on the existing research body of infarct quantification by a systematic evaluation of the sources to variability in n-SD method.METHODS
Subjects from two multi-center, multi-vendor, prospective, cardioprotective trials; CHILL-MI10, MITOCARE11 were included with a total of 214 subjects from 17 sites and 6 countries. Scanners from three different vendors were used for data acquisition (47 % Siemens, 37 % Philips, and 16 % GE). Infarct quantification was performed by a corelab (Imacor AB, Lund, Sweden). Delineations were used to defined eligible remote myocardium. Four sets of experiments were performed, all designed to only evaluate variability as no gold standard infarct size is available in patients.- Impact
on placement of remote ROI
A fixed size ROI consisting of 45 degrees of the circumference was placed in the remote myocardium. The position was shifted in steps of at least 10 degrees so that, if possible, 7 ROI’s could be placed per slice.
- Impact
of size of remote ROI
A set of 7 different sized ROIs were placed in the remote myocardium. - Impact
of number of SD from remote
A fixed size ROI consisting of 45 degrees of the circumference was placed centrally in the remote myocardium. n-SD from remote was varied from 2 to 5 in steps of 0.5 (i.e. total 7 steps). - Comparison
of remote myocardial SD between subjects, slices and vendors
Relative myocardial SD was computed as the median of the SD over different ROI positions in each slice divided by the median signal intensity. Thus, each slice generated up to 7 measurements of infarct size and from this relative infarct size, variability was computed by subtracting the median infarct size for the slice and dividing it with the median infarct size. All slices that contained ≥10% and had at least a 50% circumference that contained no infarct were included. The ROIs excluded the most endocardial and epicardial pixels (Figure 1).
RESULTS
In total, 1268 slices were included. The variability due to positioning, size, and standard deviations is shown in Figure 2, and impact on infarct size variability is shown in Table 1. The correlation between myocardial SD and infarct size variability was r2=0.59, i.e 59% of the infarct variation was explained by different levels of SD in the myocardium. The relative myocardial SD was 25%±8%, 41%±29%, and 39%±19% for GE, Philips, and Siemens scanners, respectively. The differences between GE and the two other vendors were statistically significant (p<0.01).DISCUSSION
The results show that the ROI position, size, and number of standard deviations all to a large extent affect infarct size. The main driver of the resulting variability in infarct size from using n-SD method is the differences in noise level. Therefore, it can be concluded that the n-SD method will inevitably have large variability. The magnitude in variability of infarct size caused by different positions of remote ROI is similar to the variability of the n of standard deviations used (2-5). Whereas this has been extensively studied, little is discussed how to place the remote ROI. Previously, different SD from remote have been proposed ranging from 2-5 without consensus. This may be explained by the finding that the myocardial SD levels were statistically different between vendors. These differences should likely not be attributed to hardware differences, but rather different noise removal algorithms. Theoretically, the size of remote ROI and the number of standard deviations could be standardized, but that would not solve shortcomings in dependency of SD in myocardium as it varies between subjects, sites and vendors. The relative myocardial SD varied with 276% between the lower and the upper quartile, which corresponds to a change from 2 to 5.5 SD from remote. In trained hands the n-SD method may work if great care is applied in manual placement of ROI’s. However, such careful application will closely correspond to manual delineations. There is no validation of n-SD in a multi-center, multi-vendor setting. Contrary, it has been shown that n-SD methods perform worse than non-SD methods7. Thus, previous multicenter studies using n-SD should be interpreted with caution. This study investigates infarct quantification, however, the same arguments apply to other usages of standard deviations from remote such as quantification of Myocardium at Risk (MaR), or border zone.CONCLUSIONS
Based on the source of variability in infarct size and the variability in myocardial SD levels we conclude the n-SD method lack accuracy for infarct quantification, especially in multi-center, multi-vendor setting.Acknowledgements
Einar Heiberg would like to acknowledge fruitful discussions with Jane Tufvesson on issues with n-SD method over the years.References
- Kim, R.J., et al., Relationship of MRI delayed contrast enhancement to irreversible injury, infarct age, and contractile function. Circulation, 1999. 100(19): p. 1992-2002.
- Fieno, D.S., et al., Contrast-enhanced magnetic resonance imaging of myocardium at risk: distinction between reversible and irreversible injury throughout infarct healing. J Am Coll Cardiol, 2000. 36(6): p. 1985-91.
- Bondarenko, O., et al., Standardizing the definition of hyperenhancement in the quantitative assessment of infarct size and myocardial viability using delayed contrast-enhanced CMR. J Cardiovasc Magn Reson, 2005. 7(2): p. 481-5.
- Hsu, L.Y., et al., Quantitative myocardial infarction on delayed enhancement MRI. Part I: Animal validation of an automated feature analysis and combined thresholding infarct sizing algorithm. J Magn Reson Imaging, 2006. 23(3): p. 298-308.
- Amado, L.C., et al., Accurate and objective infarct sizing by contrast-enhanced magnetic resonance imaging in a canine myocardial infarction model. J Am Coll Cardiol, 2004. 44(12): p. 2383-9.
- Zenger, B., et al., A Practical Algorithm for Improving Localization and Quantification of Left Ventricular Scar. Comput Cardiol (2010), 2014. 2014: p. 105-108.
- Engblom, H., et al., A new automatic algorithm for quantification of myocardial infarction imaged by late gadolinium enhancement cardiovascular magnetic resonance: experimental validation and comparison to expert delineations in multi-center, multi-vendor patient data. J Cardiovasc Magn Reson, 2016. 18(1): p. 27.
- Carminati, M.C., et al., Comparison of Image Processing Techniques for Nonviable Tissue Quantification in Late Gadolinium Enhancement Cardiac Magnetic Resonance Images. J Thorac Imaging, 2016. 31(3): p. 168-76.
- Schulz-Menger, J., et al., Standardized image interpretation and post processing in cardiovascular magnetic resonance: Society for Cardiovascular Magnetic Resonance (SCMR) board of trustees task force on standardized post processing. J Cardiovasc Magn Reson, 2013. 15: p. 35.
- Erlinge, D., et al., Rapid Endovascular Catheter Core Cooling Combined With Cold Saline as an Adjunct to Percutaneous Coronary Intervention for the Treatment of Acute Myocardial Infarction: The CHILL-MI Trial: A Randomized Controlled Study of the Use of Central Venous Catheter Core Cooling Combined With Cold Saline as an Adjunct to Percutaneous Coronary Intervention for the Treatment of Acute Myocardial Infarction. J Am Coll Cardiol, 2014. 63(18): p. 1857-65.
- Atar, D., et al., Effect of intravenous TRO40303 as an adjunct to primary percutaneous coronary intervention for acute ST-elevation myocardial infarction: MITOCARE study results. Eur Heart J, 2015. 36(2): p. 112-9.
- Heiberg, E., et al., Automated quantification of myocardial infarction from MR images by accounting for partial volume effects: animal, phantom, and human study. Radiology, 2008. 246(2): p. 581-8.
- Klem, I., et al., Sources of variability in quantification of cardiovascular magnetic resonance infarct size - reproducibility among three core laboratories. J Cardiovasc Magn Reson, 2017. 19(1): p. 62.
Figures
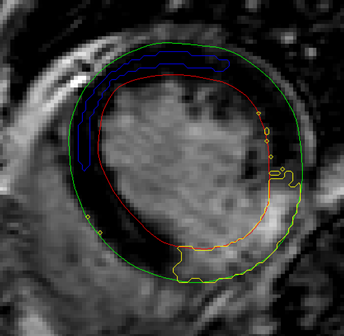
Figure
1.
Example of automatic placement of ROI (blue) in remote region. Yellow indicates
delineated scar region using SD from remote method. Note that no additional
algorithm to remove small spurious single pixels is included.
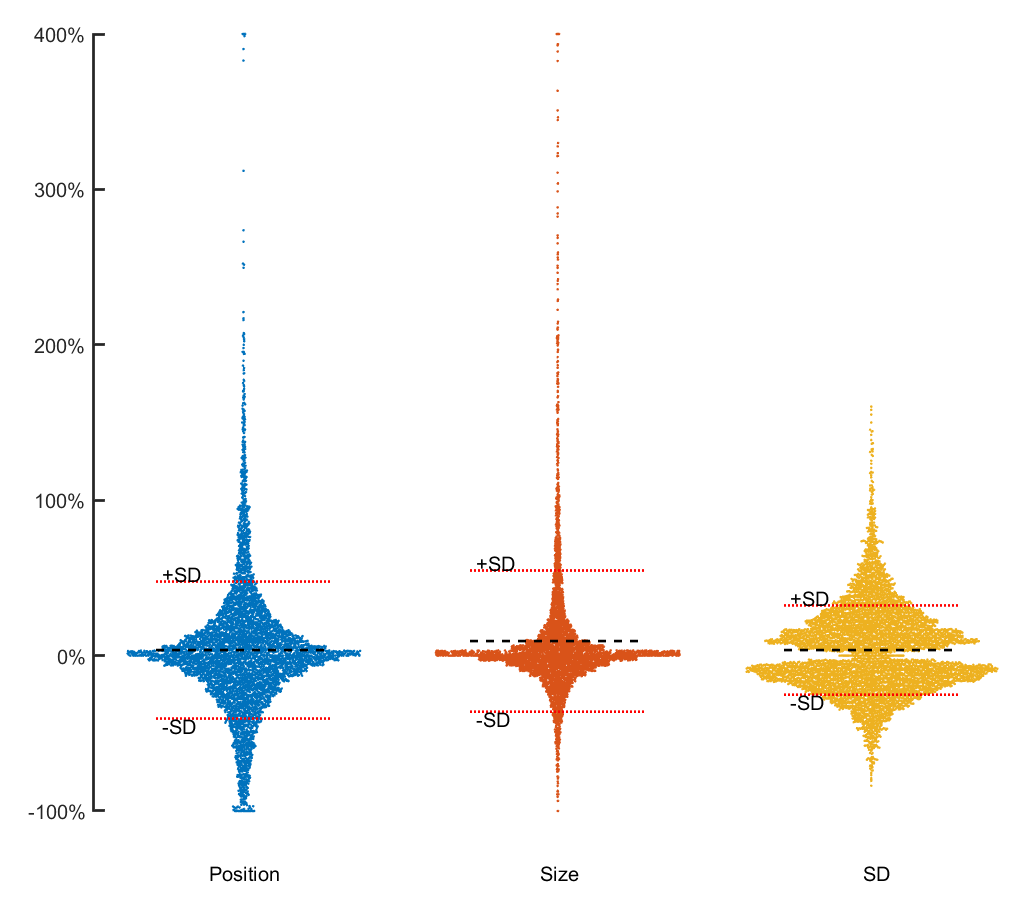
Figure 2. Effect of varying ROI placement, ROI size and SD from remote on scar
size. Each dot represents one slice. Y-axis shows the variability relative to the
median scar size for that slice. Width of X-axis corresponds to the frequency
for each outcome. For visibility, the Y-axis has been cropped at 400%. Left:
Variation in scar size by variation of ROI position. Middle: Variation in scar
by ROI size. Right: Variation in scar size depending on SD from remote.
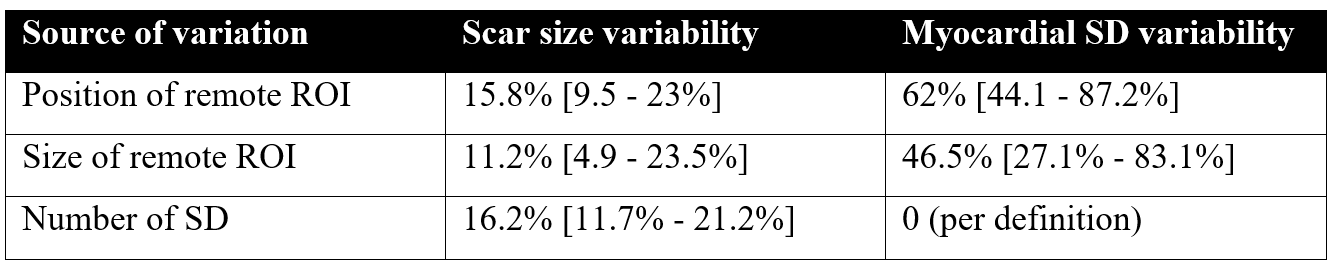
Table 1. Source
of variability by varying position and size of remote ROI and number of
standard deviations from remote used. Numbers indicate median and inter
quartile range in brackets.