0777
Automatic quantification of ultra-high resolution quantitative first-pass perfusion imaging using deep-learning based segmentation and MOCO1Department of Biomedical Engineering, University of Virginia, Charlottesville, VA, United States, 2Biomedical Engineering and Imaging Institute and Department of Radiology, Icahn School of Medicine at Mount Sinai, New York, NY, United States, 3Department of Medicine, University of Virginia, Charlottesville, VA, United States
Synopsis
While quantitative first-pass quantitative perfusion imaging is an excellent non-invasive tool for the evaluation of coronary artery disease, current processing shortcomings have kept it from widespread clinical use. In this study, we developed a pipeline which robustly and automatically segments, registers, and quantifies flow with our ultra-high resolution quantitative perfusion sequence.
Introduction
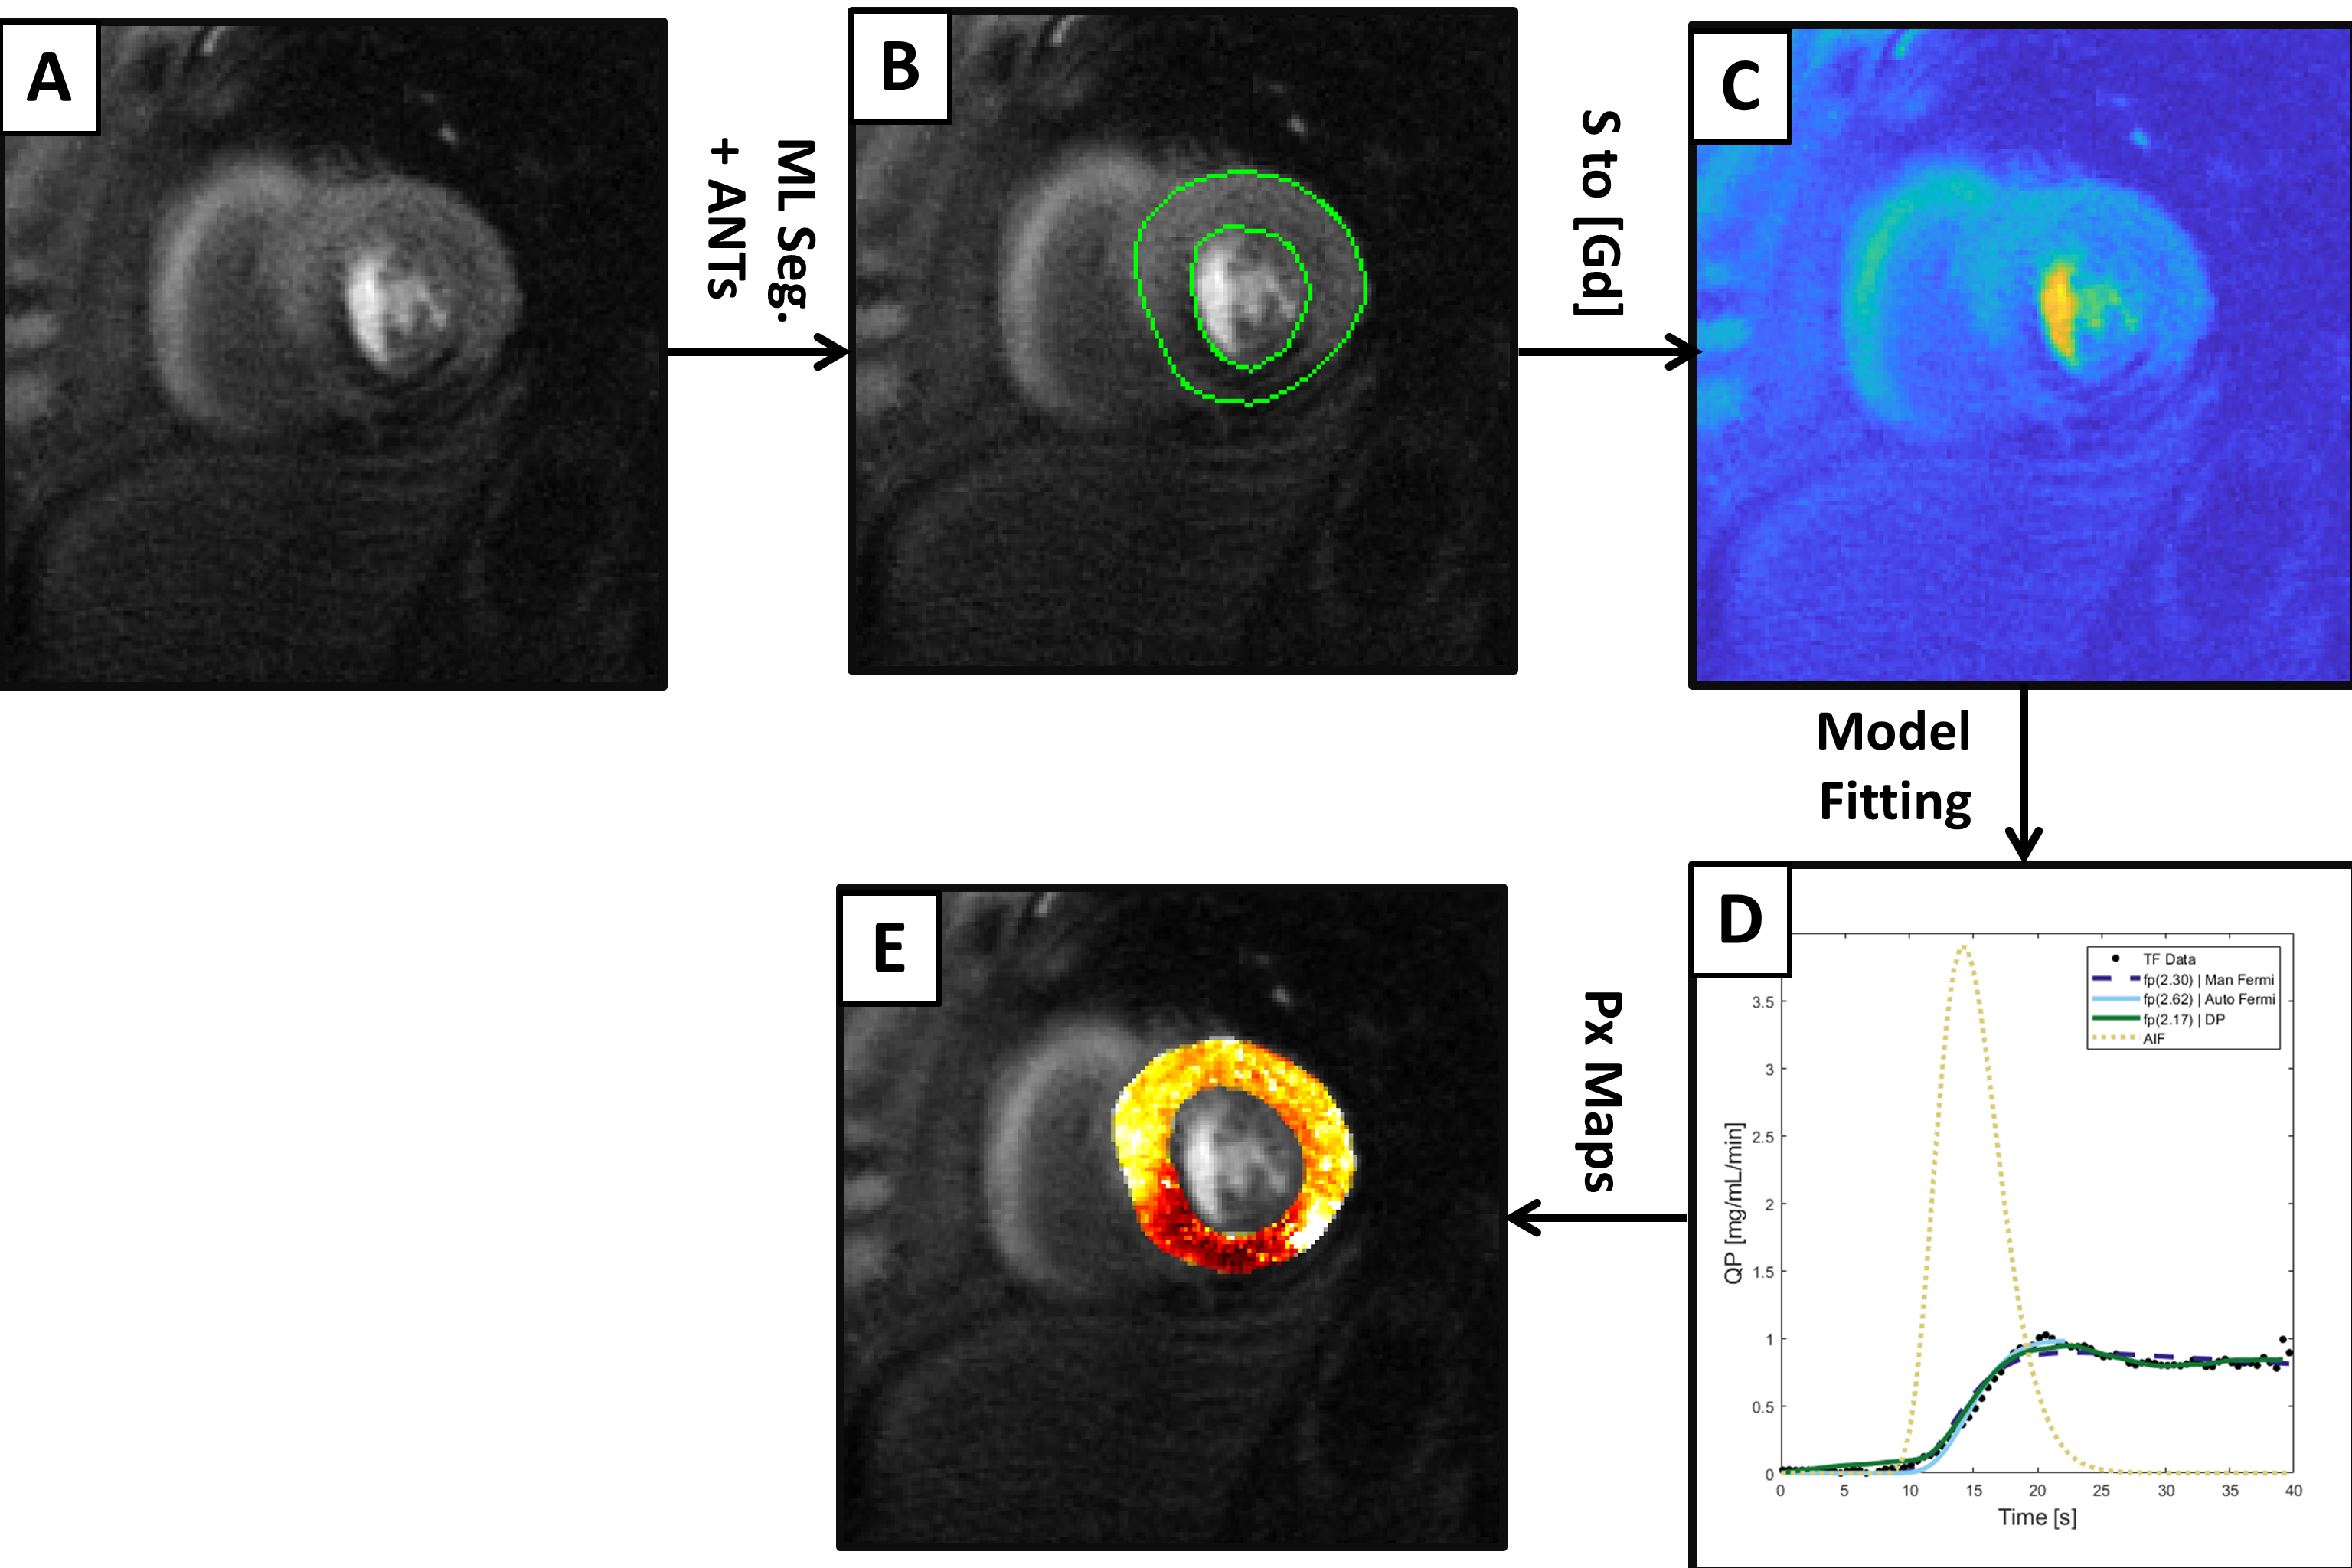
Quantitative first-pass myocardial perfusion imaging has demonstrated great diagnostic and prognostic utility1,2. However, shortcomings of the current techniques include incomplete ventricular coverage, limited spatial-temporal resolution, unsatisfactory motion correction, and unreliable segmentation of the myocardium for pixel-wise quantitative perfusion calculations. We previously developed a spiral first-pass quantitative sequence with whole heart coverage to address the acquisition limitations. To address the processing hurdles, we developed an automatic pipeline that (1) segments the myocardium with a neural network, (2) robustly registers the segmented contours, and (3) generates quantitative perfusion maps.Methods
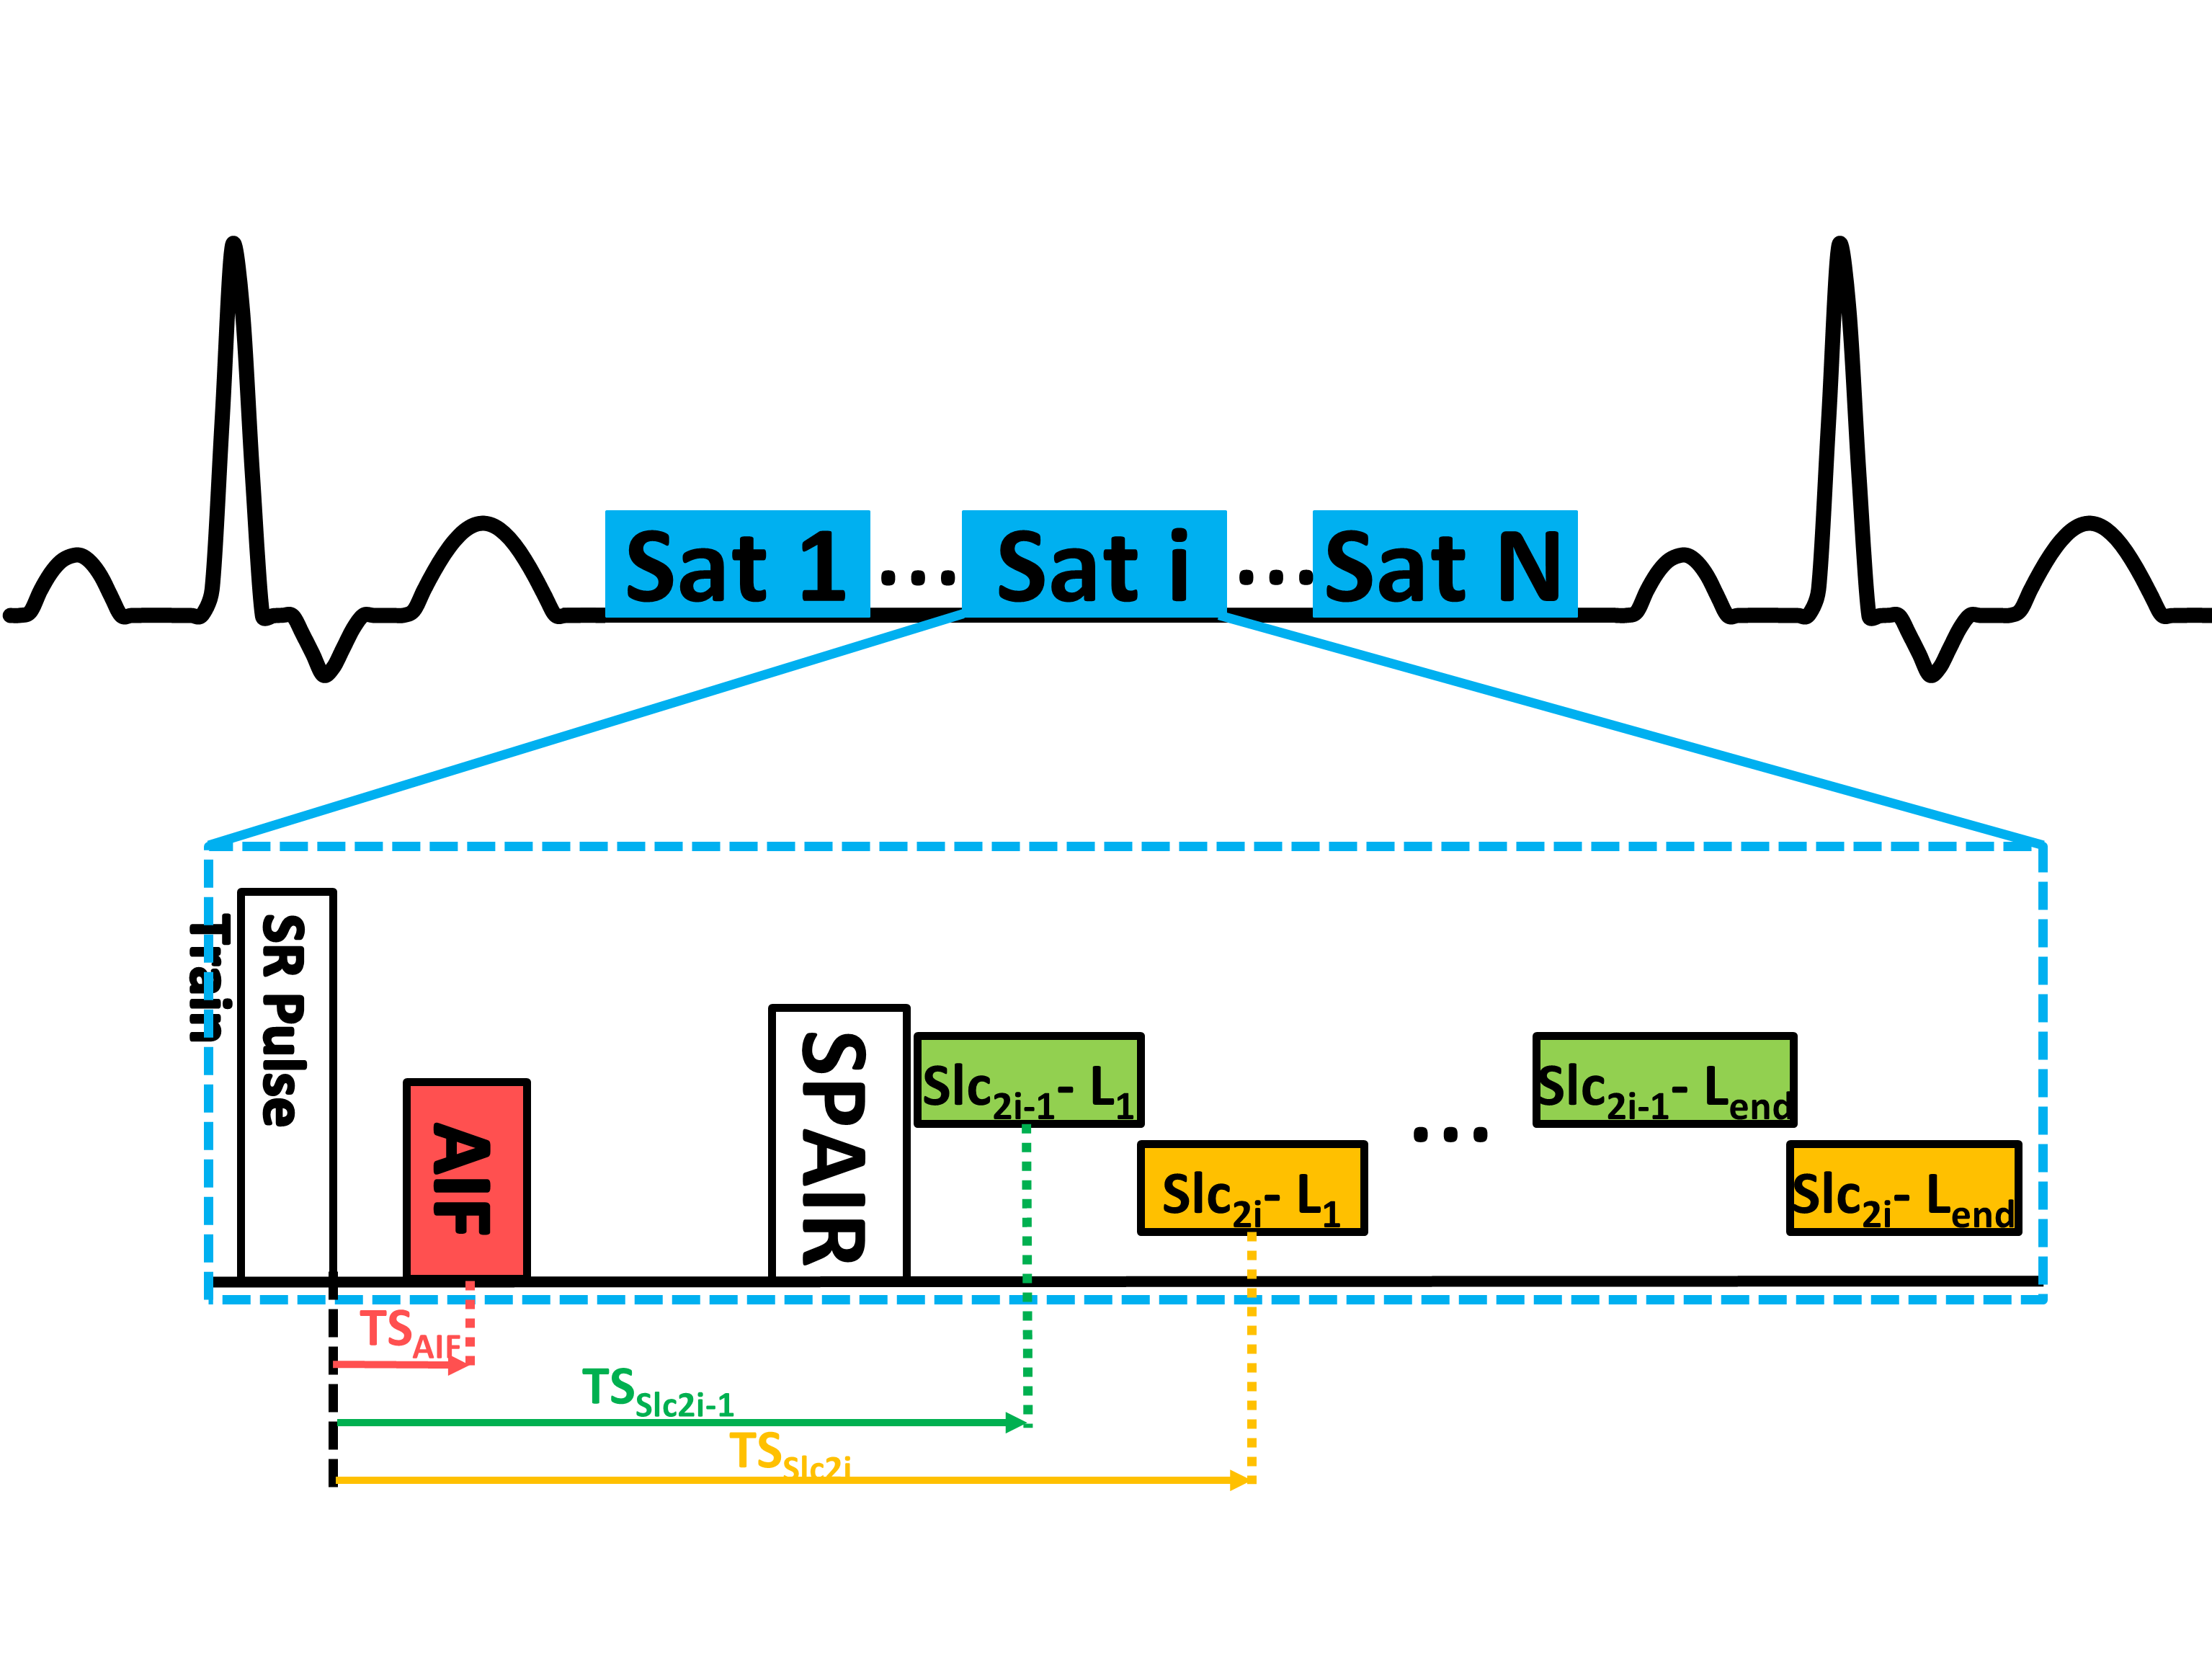
Adenosine stress CMR exams were performed on 12 patients for the evaluation of CAD on a 3T scanner with a Dotarem bolus (0.075 mmol/kg) after a three minute adenosine infusion (140μg/kg/min). We used our interleaved spiral, dual contrast, ultra-high resolution quantitative perfusion sequence as described previously (Figure 1)3. The imaging parameters were: FOV 340mm, TE/TR 1.0/7.0 ms, and saturation recovery time (SRT) 90 ms, with 6 slices (thickness=10mm) for whole-heart coverage. We acquired four PD images without a saturation preparation pulse (FA=5°) before collecting the remaining images (FA=15°). The AIF images use FA=15° and FA=45° for the PD and remaining images, respectively. Additionally, the AIF images were 2x accelerated single-shot spiral trajectories, with 6.95 mm2 in-plane resolution and with an SRT of 10 ms.We reconstructed the images using L1-SPIRiT4 by defining the sparsity transform as the finite temporal difference (Figure 2). Manual contours were drawn for all frames for both the training set and validation to train a 2D U-Net5 for myocardial segmentation6. The output contours were then used as a direct input for deformable ANTs7 registration of the image set. Signal intensity was converted to gadolinium concentration8, where the PD images were denoised by a Poisson NL means filter9.
Quantitative perfusion values were then calculated on a pixel-by-pixel basis using three different approaches: (1) manually fitting the Fermi function on each segment before using those parameters as the initial point for pixel fits, (2) automatically fitting the Fermi function10 to each pixel with a coarse grid search as the initial guess, and (3) automatically fitting the distributed parameter11 (DP) model. A Fermi function was fit to the concentration-time data through a deconvolution of the AIF and the tissue function, while the DP model was fit in the Laplace domain to estimate flow. The AIF time-concentration curve was fit to the gamma-variate function. In the manual Fermi fit, the end of first-pass was chosen by the user. For the automatic Fermi fit, the end of first pass was defined as the first time point in the gamma-variate that was less than 5% of the maximum AIF value. The automatic Fermi’s coarse grid was defined as t0 = [0:0.25:5] s, A = [0:0.01:0.5] 1/s, k = [0:0.02:0.5] 1/s, and tau = [0:0.5:10] s, where t0 is the contrast arrival time, A is the amplitude scale factor, and k and tau are Fermi shape parameters. Flow was determined from the Fermi function amplitude at t=0. The automatic DP’s coarse grid was defined as Fp = [0:0.1:8] mg/min/mL, Tc = [0:0.25:4] min, Te = [0:0.5:10] min, and T= [0:0.5:5] min, where Fp is the plasma flow, Tc is the mean capillary time, Te is the mean interstitial transit time, and T is the mean transit time.
Results
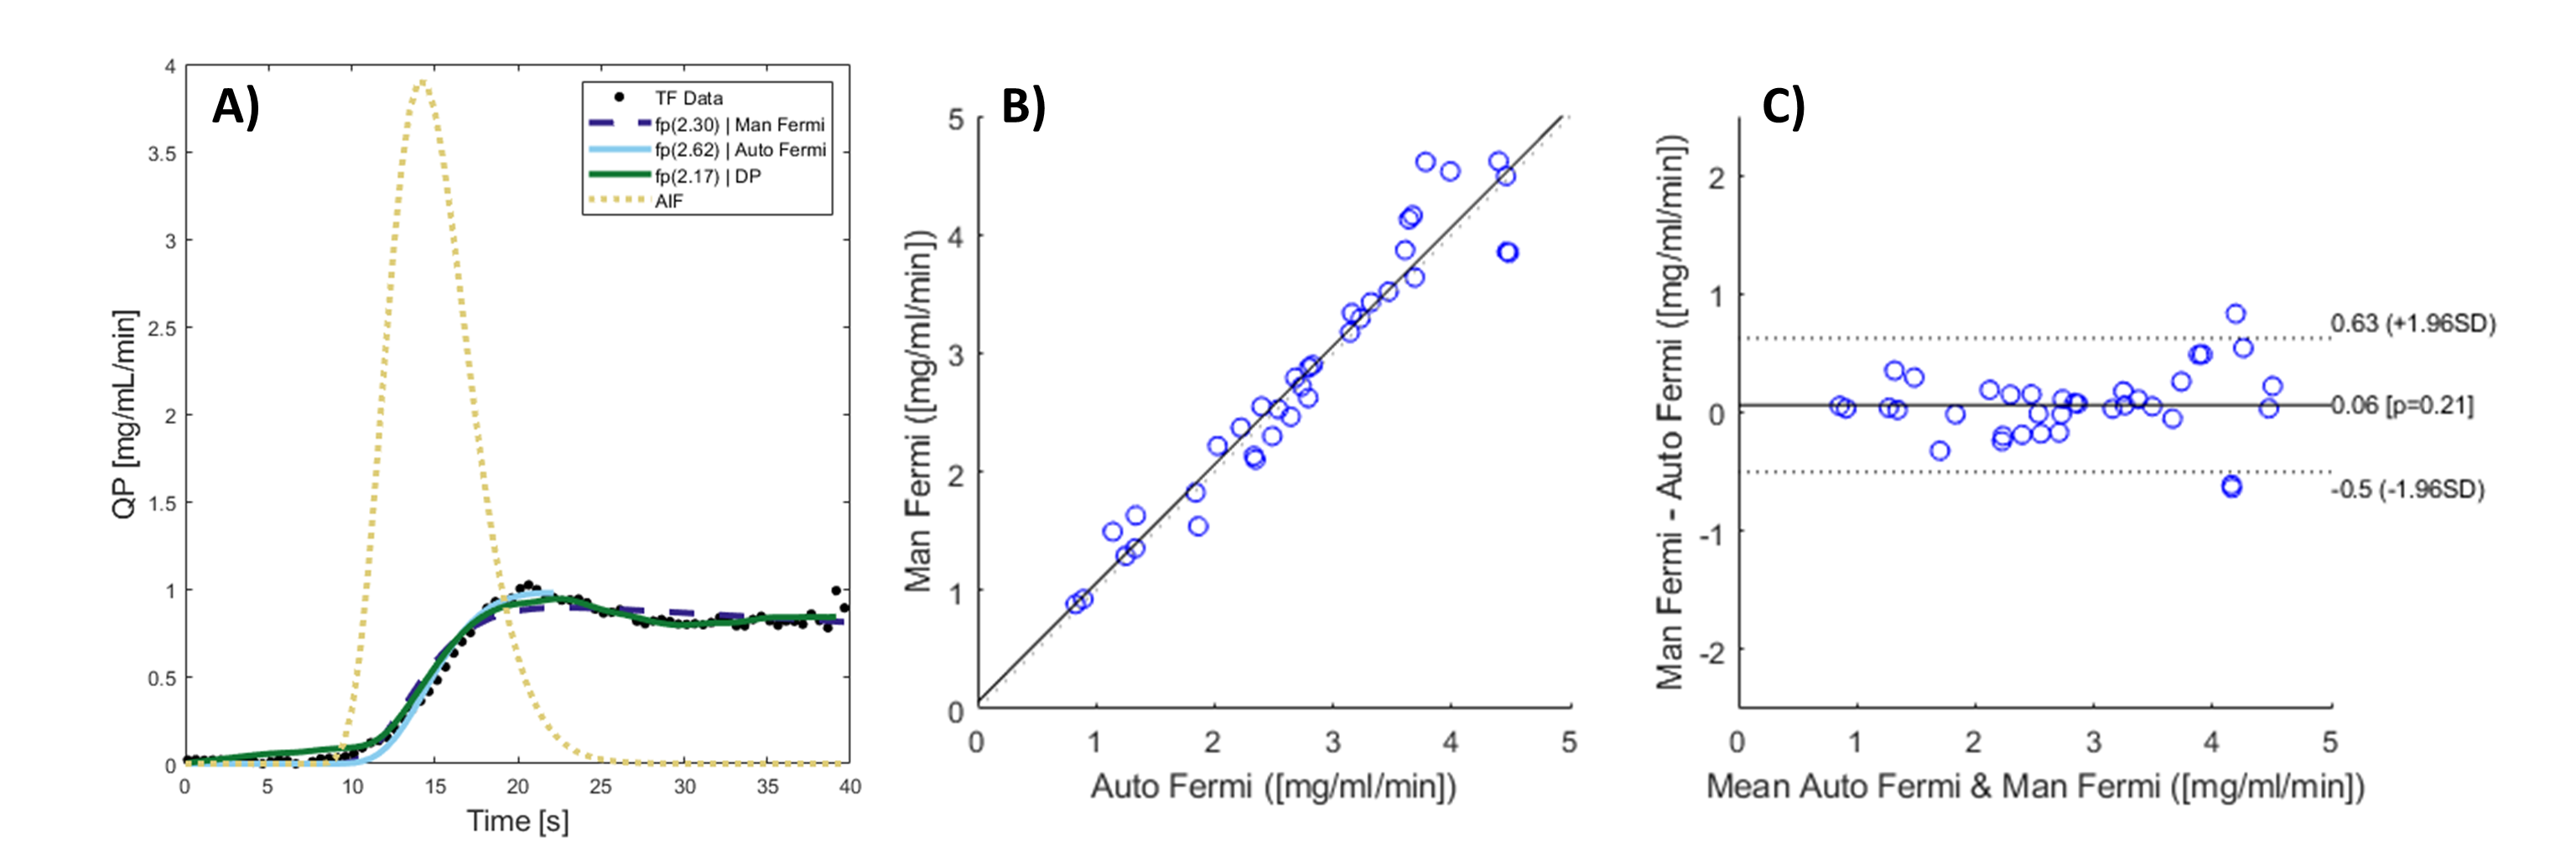
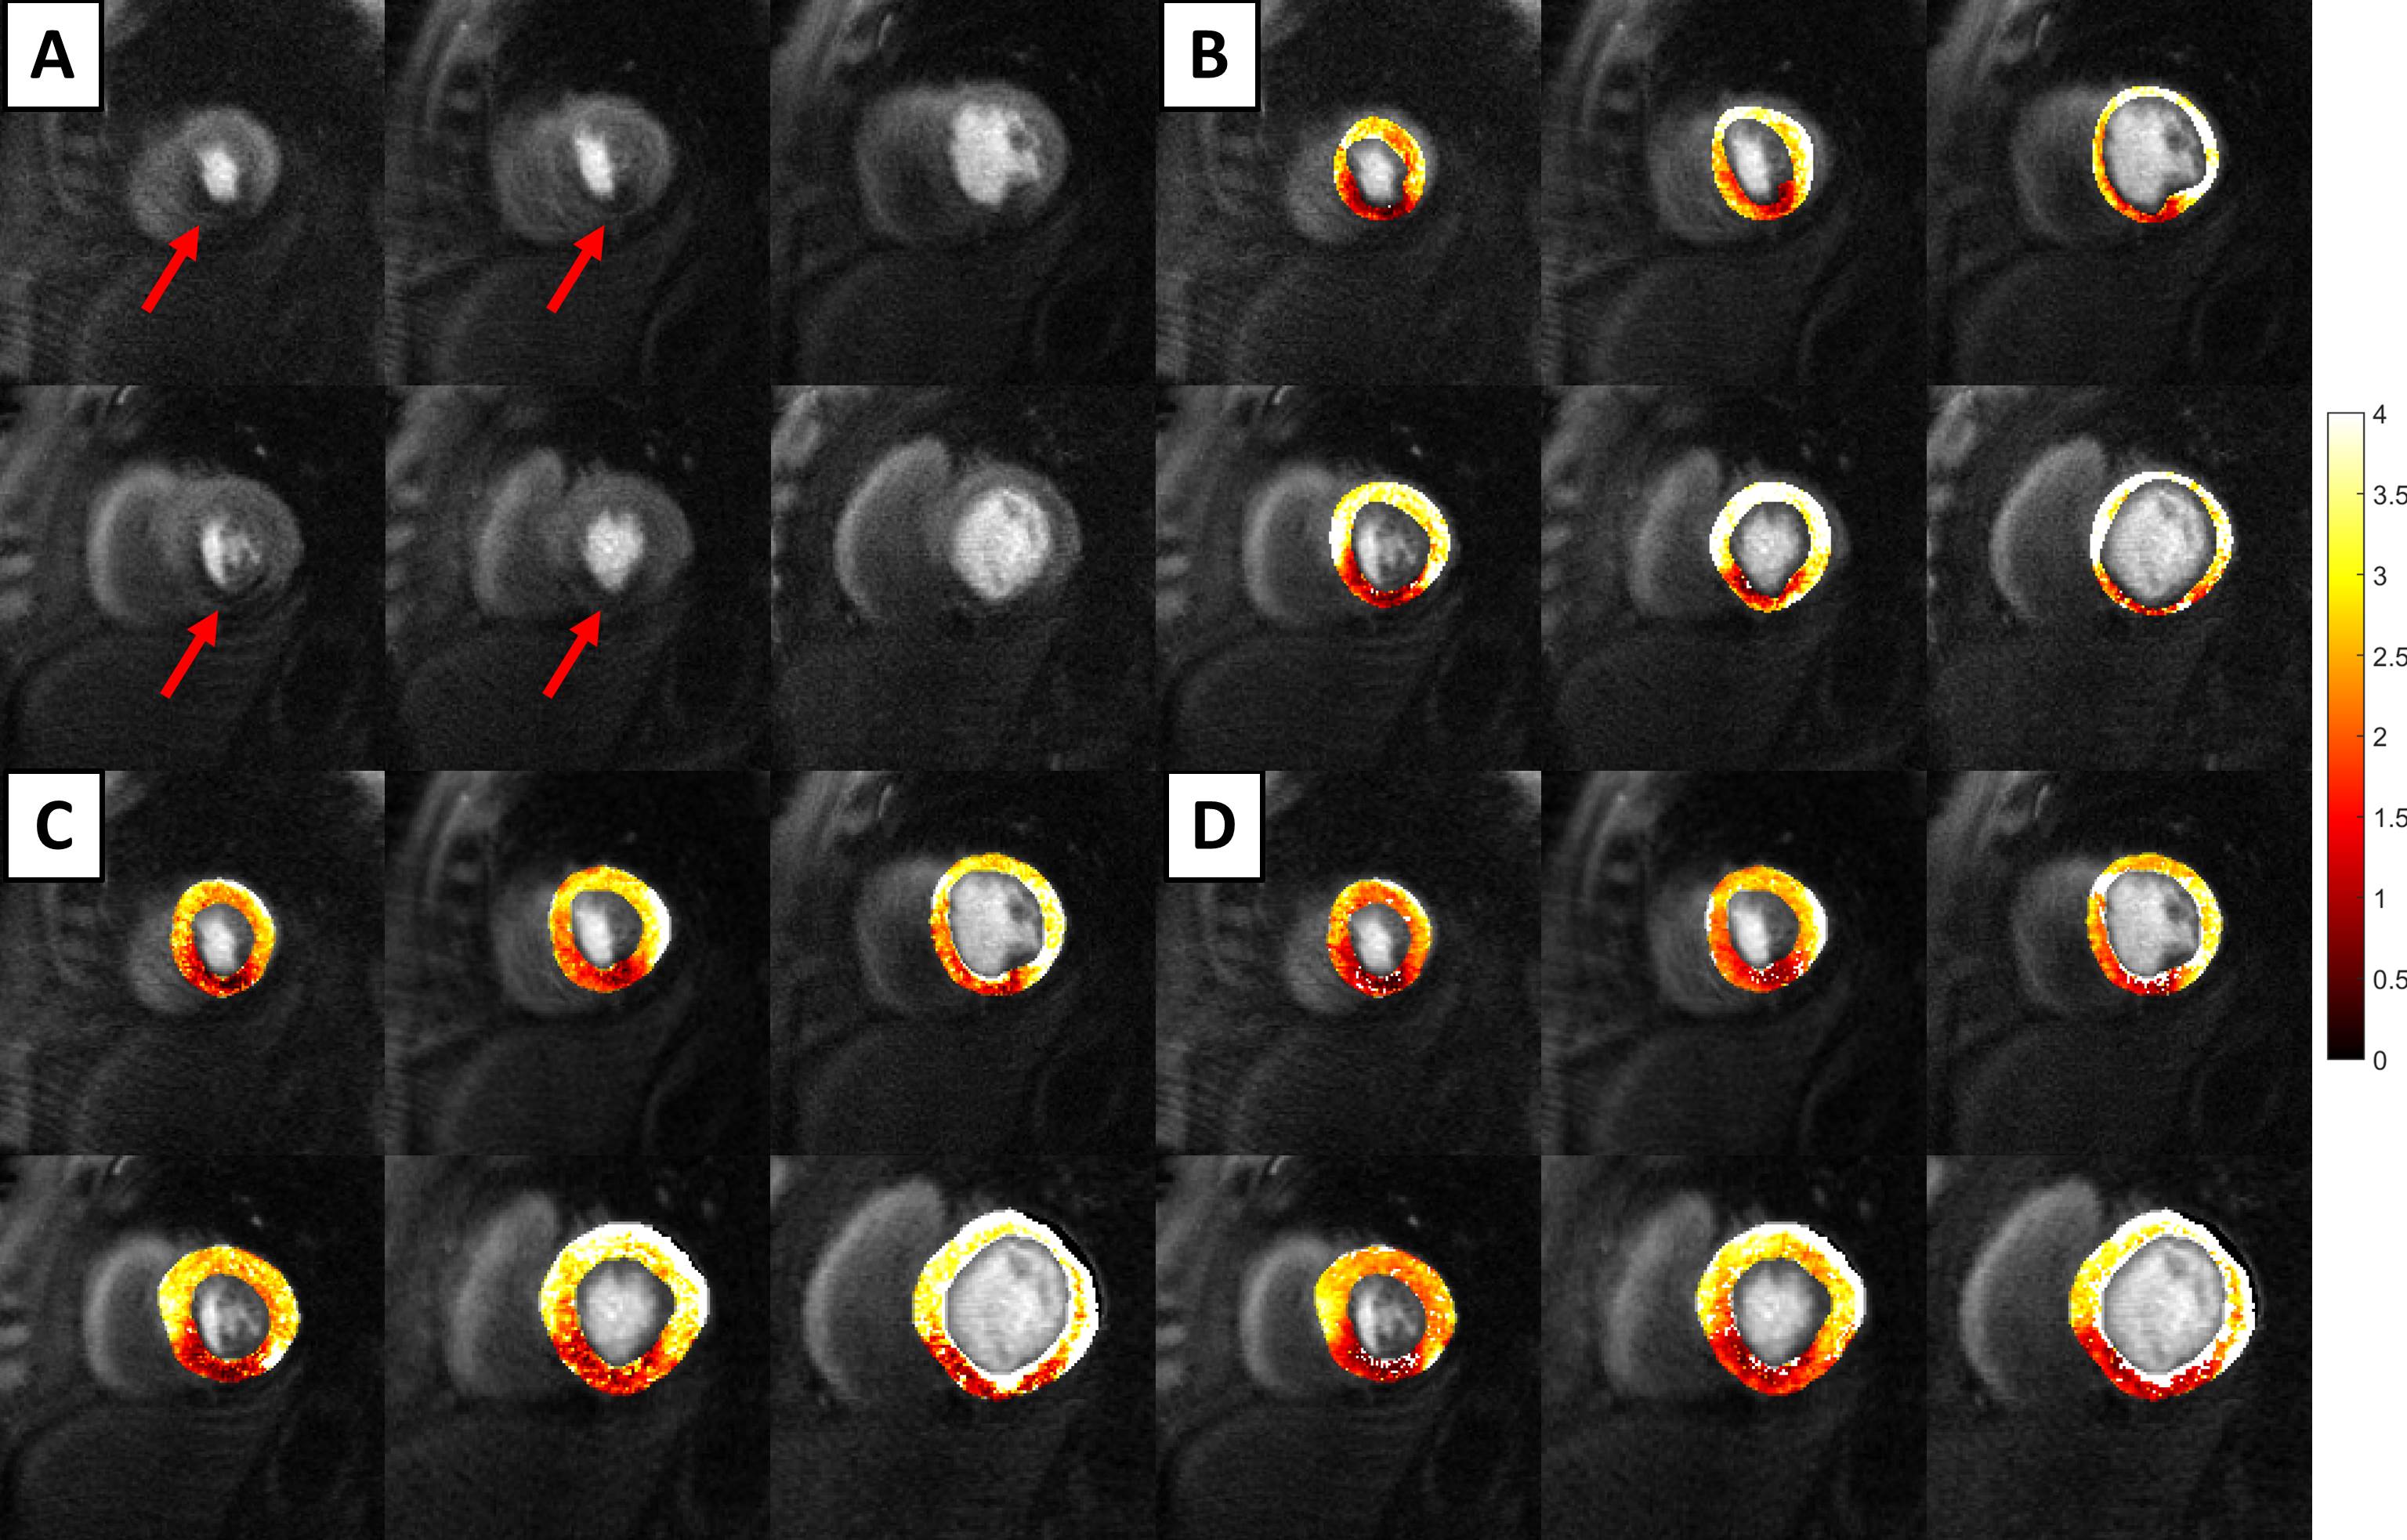
Figure 3 shows an example quantitative perfusion fit (Figure 3A), along with a segmental Bland-Altman comparison of the automatic Fermi fit (Figures 3B-C) in comparison to the manual Fermi fit. Over the 36 segments, the mean adjusted-R2 values were 0.87±0.12, 0.94±0.11, and 0.96±0.04 for the manual Fermi, auto Fermi, and DP model fitting routines, respectively.Figure 4 is an example output from the automatic processing pipeline. The subject had a large ischemic region in the inferoseptal and inferior segments of their heart (Figure 4A). The flow is reduced in the ischemic region, which is shown in the three compared methods (Figures 4B-D). Figure 4B shows our prior pipeline, where the ROIs were drawn by hand and the Fermi fits were segmentally tweaked by hand to produce the maps. Figures 4C and 4D show quantitative perfusion maps from our proposed pipeline, where the U-Net ROIs were used to register the images before fitting the models. Figure 4C shows the automatic Fermi function maps, while Figure 4D shows the DP maps.
Discussion
The automatic Fermi and automatic DP fitting methods both produced high quality flow maps. The automatic DP method had higher adjusted-R2 values in comparison to automatic Fermi. DP may be more advantageous since it uses all of the time points, as opposed to Fermi, which requires a defined cut-off timepoint for the end of first pass perfusion. Both methods performed better than the manual Fermi fitting routine. While the DP model slightly underestimated stress flow values in comparison with the manual Fermi function, it is in agreement with prior art11.Conclusion
We developed an automatic pipeline for ultra-high resolution first-pass myocardial perfusion, which robustly fits the automatic Fermi and DP models to pixelwise concentration-time curves with superior R2 values to the manual fitting algorithm. The pipeline employs DCNN-based automatic LV segmentation for ANTs registration, which improves the accuracy of the fits.Acknowledgements
This work was supported by NIH R01 HL131919 and T32 EB003841.References
1. Salerno, M. et al. Adenosine Stress Cardiovascular Magnetic Resonance With Variable Density Spiral Pulse Sequences Accurately Detects Coronary Artery Disease: Initial Clinical Evaluation. Circ. Cardiovasc. Imaging 7, 639–646 (2014).
2. Nandalur, K. R., Dwamena, B. A., Choudhri, A. F., Nandalur, M. R. & Carlos, R. C. Diagnostic performance of stress cardiac magnetic resonance imaging in the detection of coronary artery disease: a meta-analysis. J. Am. Coll. Cardiol. 50, 1343–1353 (2007).
3. Yang Yang, Robinson, Austin, Mathew, Roshin, Kramer, Christopher & Salerno, Michael. Initial Clinical Evaluation of Quantitative Ultra-high Resolution First-pass Spiral Perfusion Imaging with Whole Heart Coverage in Patients with Ischemic Heart Disease at 3T. (2019).
4. Yang, Y., Kramer, C. M., Shaw, P. W., Meyer, C. H. & Salerno, M. First-pass myocardial perfusion imaging with whole-heart coverage using L1-SPIRiT accelerated variable density spiral trajectories. Magn. Reson. Med. 76, 1375–1387 (2016).
5. Çiçek, Ö., Abdulkadir, A., Lienkamp, S. S., Brox, T. & Ronneberger, O. 3D U-Net: Learning Dense Volumetric Segmentation from Sparse Annotation. ArXiv160606650 Cs (2016).
6. Feng, X., Tustison, N., Qing, K., Kramer, C. & Meyer, C. Robust tissue tracking from cardiac cine MRI with deep-learning-based fully automatic myocardium segmentation. Abstract in the Joint Annual Meetng ISMRM-ESMRBM (2018).
7. Tustison, N. J., Yang, Y. & Salerno, M. Advanced Normalization Tools for Cardiac Motion Correction. in Statistical Atlases and Computational Models of the Heart - Imaging and Modelling Challenges 3–12 (Springer, Cham, 2014). doi:10.1007/978-3-319-14678-2_1.
8. Cernicanu, A. & Axel, L. Theory-Based Signal Calibration with Single-Point T1 Measurements for First-Pass Quantitative Perfusion MRI Studies. Acad. Radiol. 13, 686–693 (2006).
9. Deledalle, C.-A., Tupin, F. & Denis, L. Poisson NL means: Unsupervised non local means for Poisson noise. in 2010 IEEE International Conference on Image Processing 801–804 (IEEE, 2010). doi:10.1109/ICIP.2010.5653394.
10. Jerosch-Herold, M., Wilke, N., Stillman, A. E. & Wilson, R. F. Magnetic resonance quantification of the myocardial perfusion reserve with a Fermi function model for constrained deconvolution. Med. Phys. 25, 73–84 (1998).
11. Broadbent, D. A. et al. Myocardial blood flow at rest and stress measured with dynamic contrast-enhanced MRI: Comparison of a distributed parameter model with a fermi function model. Magn. Reson. Med. 70, 1591–1597 (2013).
Figures