0776
Fully Automated Multivendor and Multisite Artificial Intelligence-based 3D Segmentation of the Proximal Arteries from 4D flow MRI1Lurie Children's Hospital of Chicago, Chicago, IL, United States, 2Northwestern University, Chicago, IL, United States, 3University of Colorado, Anschutz Medical Campus, Aurora, CO, United States
Synopsis
We trained and validated a multi-label convolutional neural network for the segmentation of the aorta and pulmonary arteries from 4D flow MRI for rapid flow analysis across multiple vendors and centers. Using 67 whole-heart 4D flow MRI scans, including 29 with cardiac pathologies, across two institutions and vendors, we trained and tested our CNN using 10-fold cross validation. For flow analysis, We calculated net flow, peak velocity, and Qp-Qs. Across all flow metrics, we found that automated segmentations showed moderate to strong agreement with the manual segmentations, while taking a fraction of the time.
Introduction
4D Flow MRI provides comprehensive characterization and quantification of hemodynamics in the presence of pediatric congenital heart disease, however the analysis can be cumbersome, requiring extensive and time-consuming manual segmentation. As such, an accurate, automated segmentation algorithm could simplify hemodynamic quantification and possibly improve flow analysis interobserver variability. While previous attempts have demonstrated the ability to accurately and rapidly provide automated segmentations of the thoracic aorta from 4D flow MRI [1], we seek to build on these developments by including: 1) multi-label segmentation of the aorta and pulmonary arteries on, 2) multiple vendor datasets from, 3) multiple sites. With rapid and accurate segmentation of the aorta and pulmonary arteries, 4D flow MRI data can be analyzed quickly across multiple sites. In this study, we trained and validated a multi-label convolutional neural network (CNN) for the segmentation of the aorta and pulmonary arteries (PA) from 4D flow MRI for rapid flow analysis across multiple vendors and centers.Methods
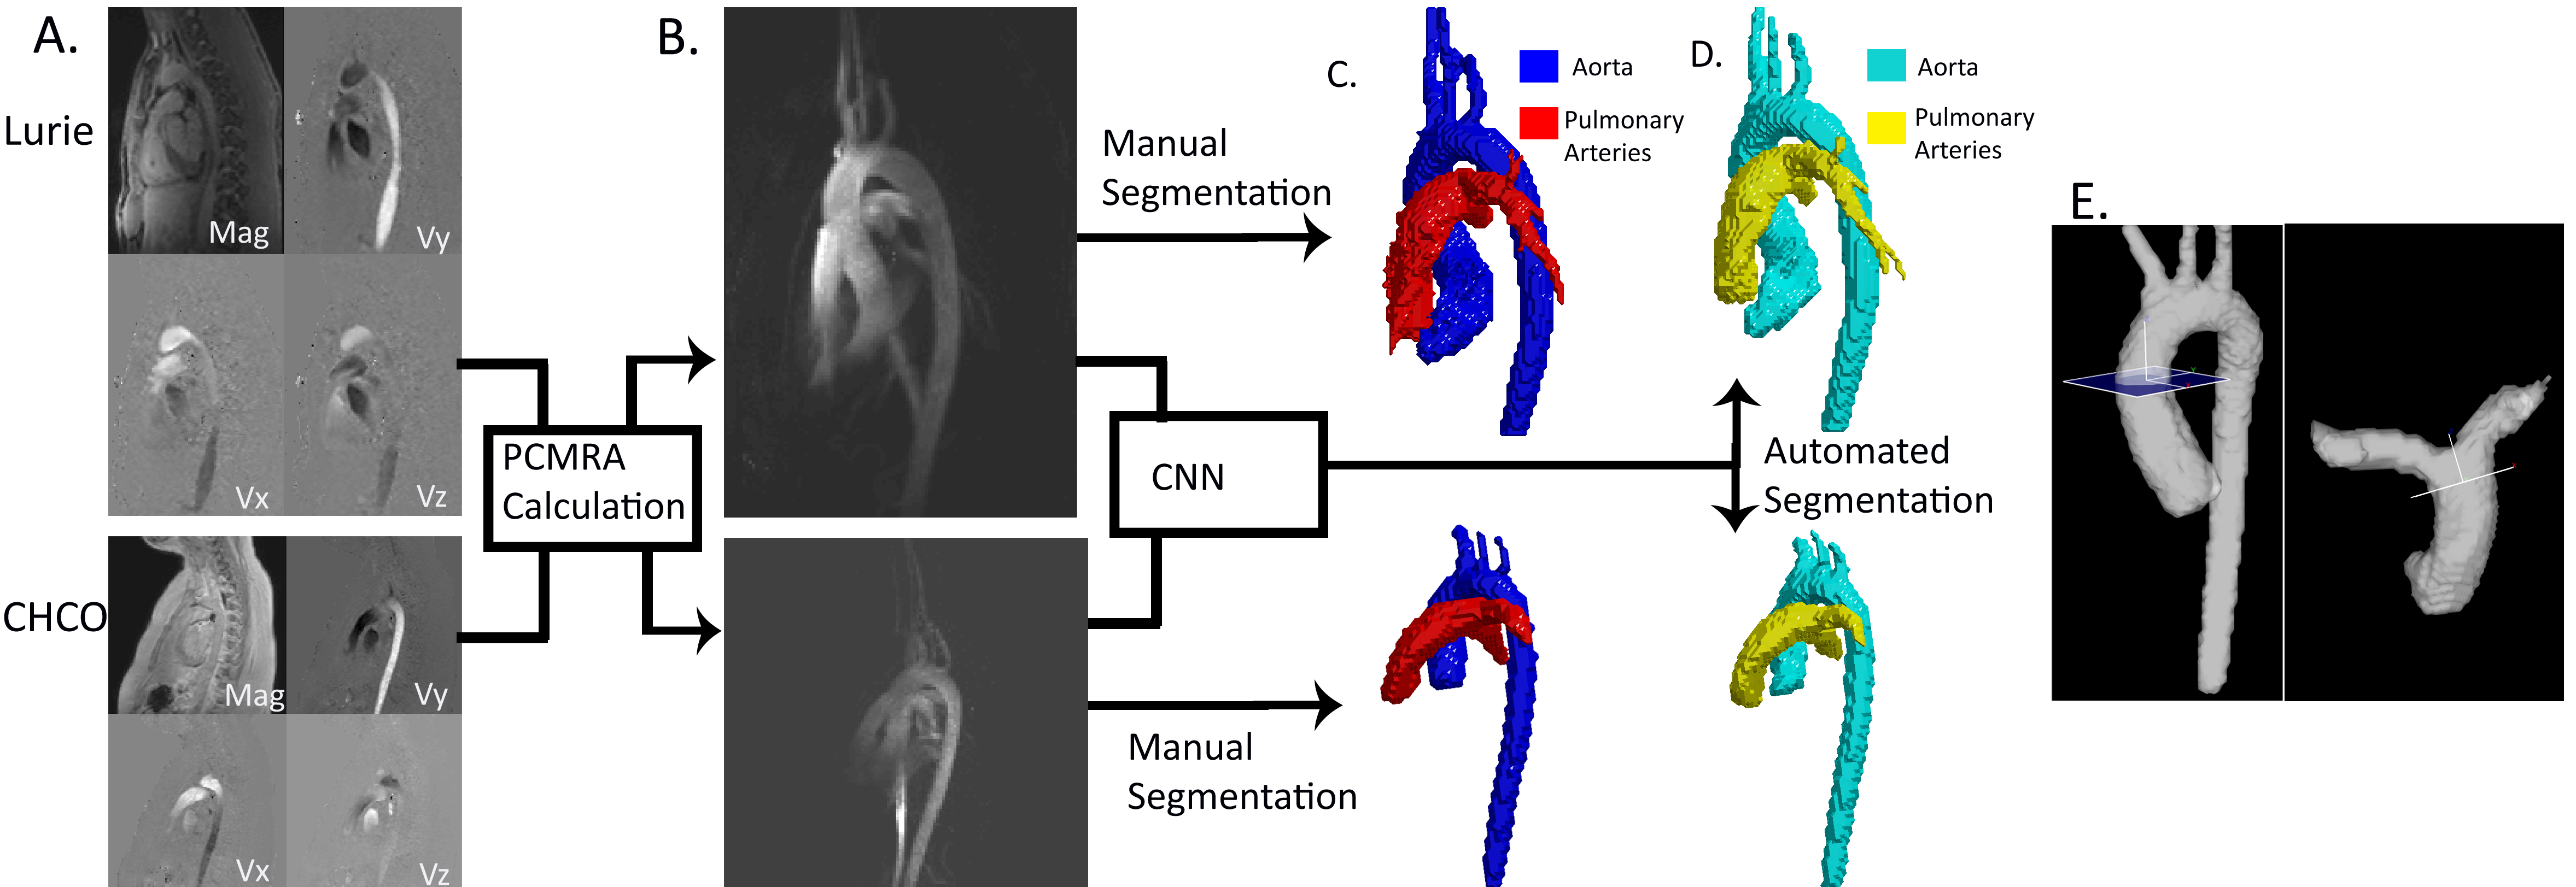
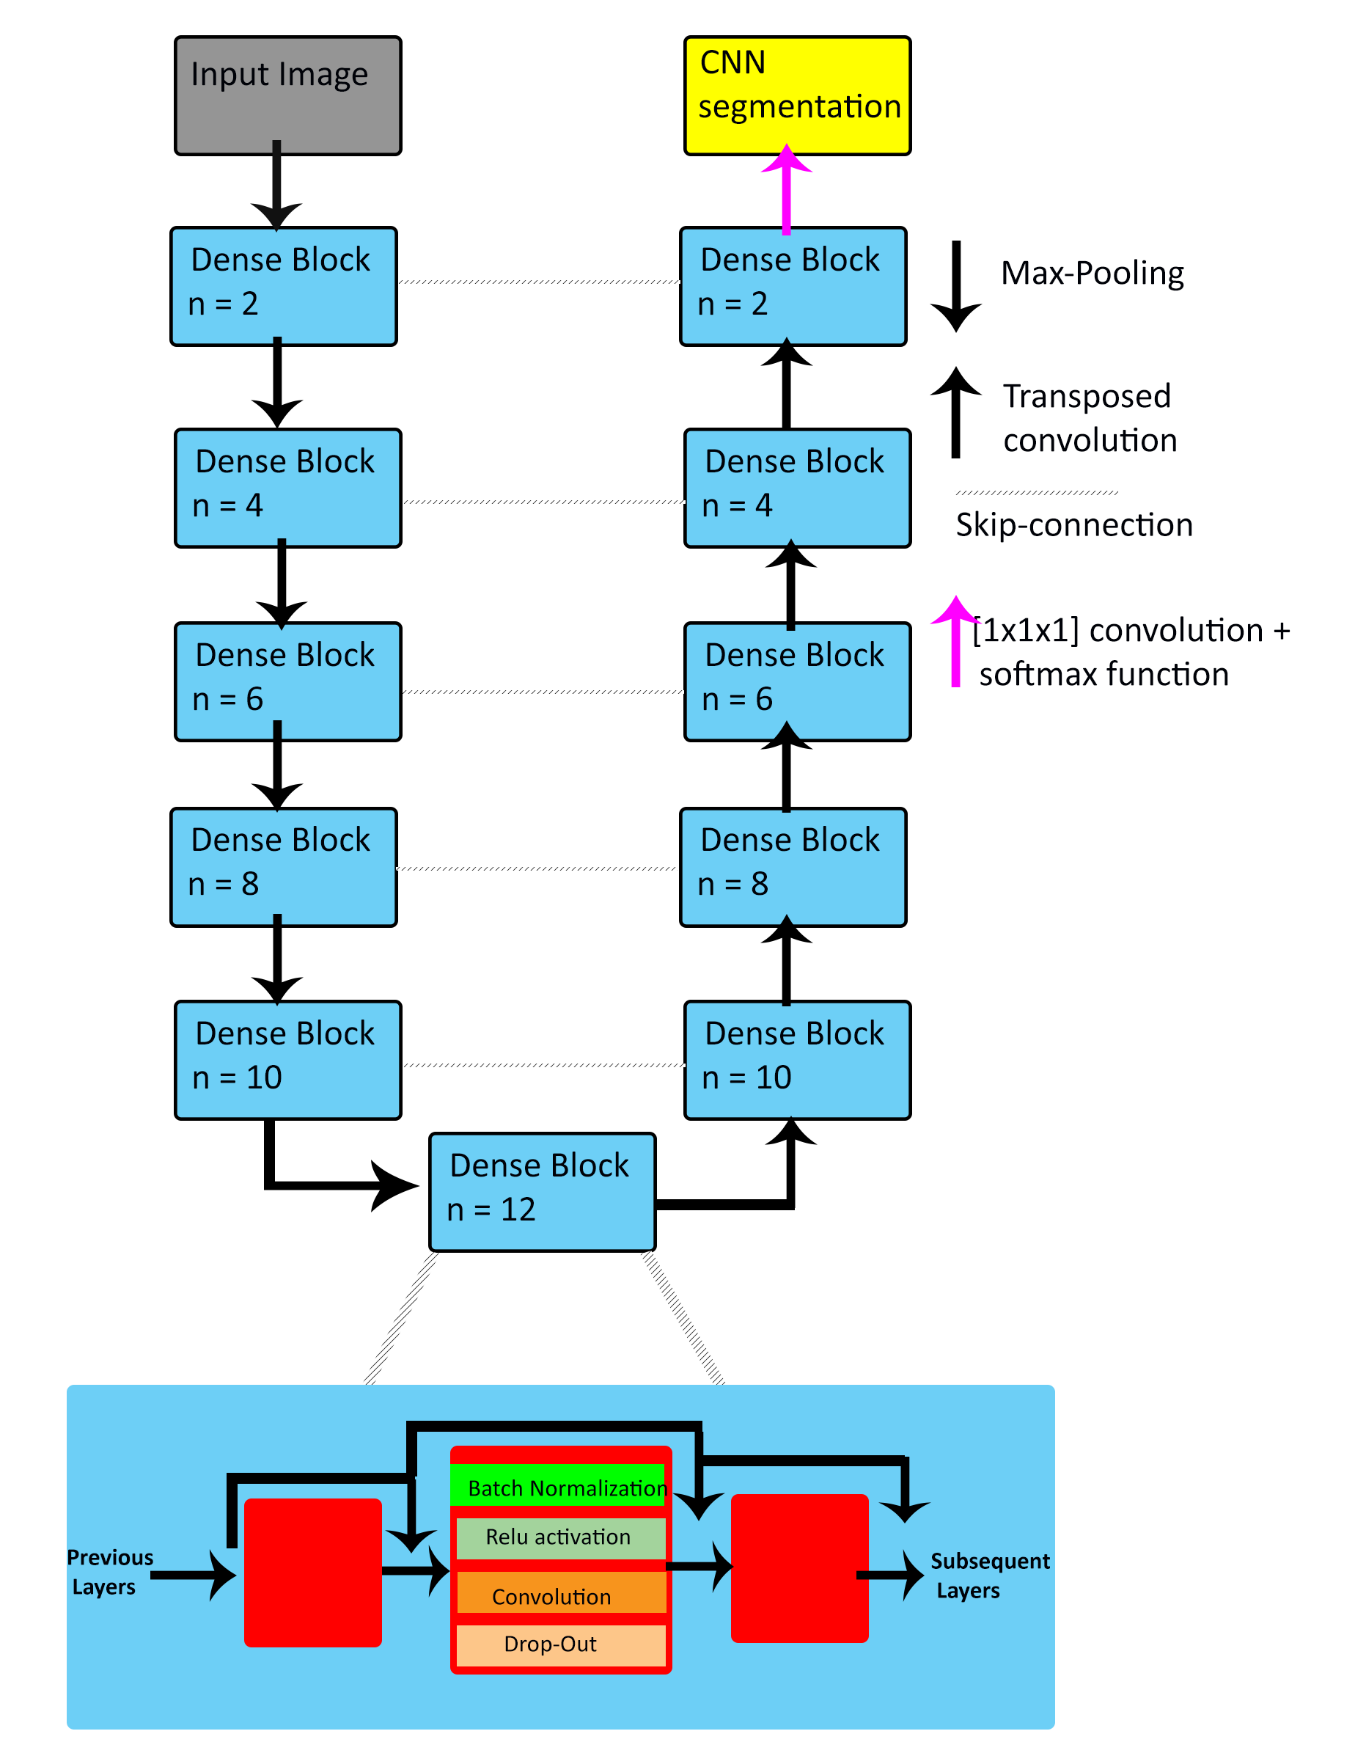
This retrospective pilot study used 67 whole-heart 4D flow datasets from Site 1: Lurie Children’s Hospital (Lurie), and Site 2: Children’s Hospital of Colorado (CHCO), with patients ranging from infants to young adults (Lurie: N=42, age=15 [2-25] years, TR=40.8-42.8 ms, venc=80-220 cm/s, spatial resolution=1.89-2.38x1.8-2.38x1.9-2.8 mm3, Siemens; CHCO: N=25, age= 14 [3-28] years, TR=37-75 ms, venc=150 cm/s, spatial resolution=1.25-2.34x1.25-2.34x1.56-2.5 mm3, Philips). Overall, the cohort included 37 controls and 29 patients with cardiac pathologies (including 15 tetralogy of Fallot [TOF]). The workflow is described in Figure 1. Each 4D flow dataset underwent standard 4D flow pre-processing. 4D flow-derived 3D phase contrast MR angiograms (PCMRA, Figure 1B) were used to perform manual 3D segmentations of the aorta and the PA (Mimics, Materialise; 3D Slicer). The manually-generated 3D segmentations served as a ground-truth for training and testing while the PCMRAs were inputs to the CNN (Figure 1C). A 10-fold cross validation was used, allowing every dataset to be used for testing (Figure 1D).The CNN used was a 3D UNet with DenseNet blocks replacing the traditional convolution layers (Figure 2) [2, 3]. Each DenseNet block consisted of a series of 3D convolutions, batch normalization, and a linear rectified unit, applied n number of times, with increasing frequency at deeper sections of the CNN. After every convolution layer, the feature maps were concatenated together and served as inputs for subsequent layers, in order to efficiently reuse feature maps throughout the CNN. Max-pooling was applied to down-sample the feature maps to obtain more generic features, while transposed-convolution was used for up-sampling. After the final convolution layer, a softmax function was used to generate a probability map across all voxels. A multi-labeled dice loss and softmax cross entropy were used as a composite loss function throughout training. A dropout rate of 0.1 was applied after every convolution layer in order to prevent overfitting. An Adam optimizer was used, and the learning rate was kept constant at 0.0001.
Quantitative flow analysis and Qp-Qs calculations were performed by manually placing a plane at the ascending aorta and at the main PA (Ensight, Ansys; Figure 1E). Dice scores were calculated between the ground-truth to the automated CNN output. All values are reported as the mean±strandard deviation for normally distributed data or the median [interquartile range] otherwise. For all flow metrics, Bland-Altman and intraclass correlations (ICC) were performed between the manual and automated segmentations to assess the performance of the CNN.
Results
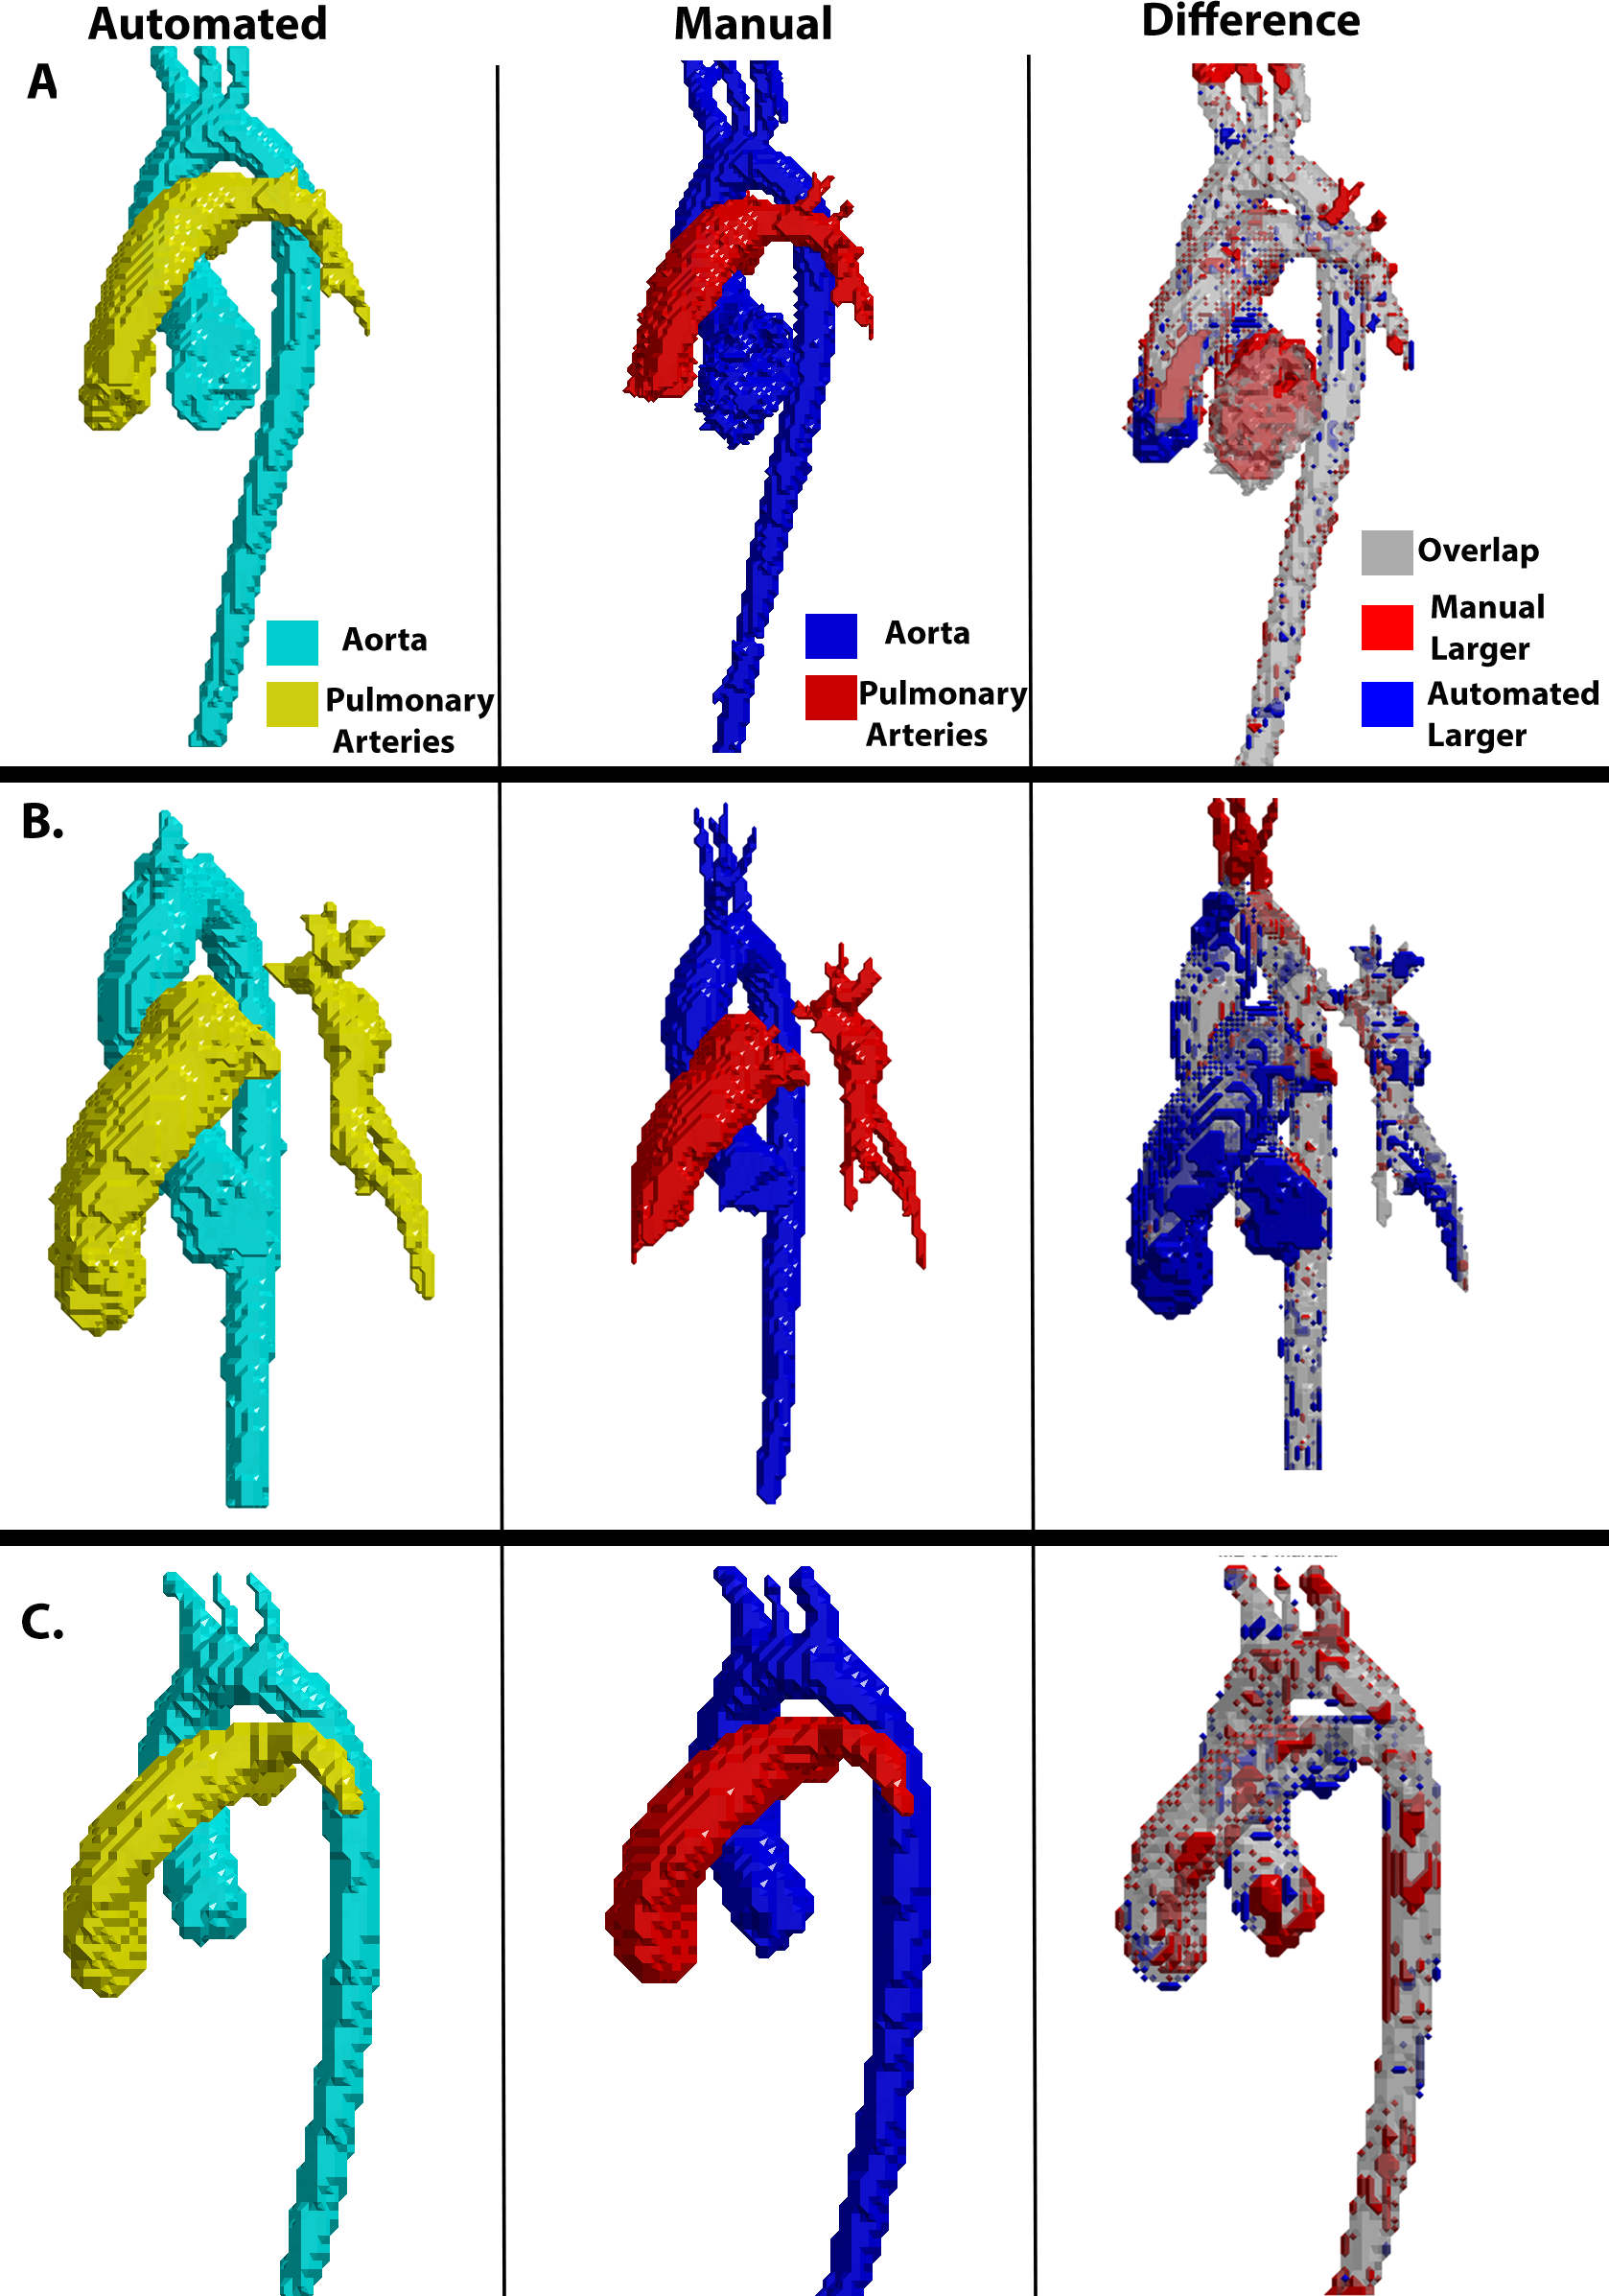
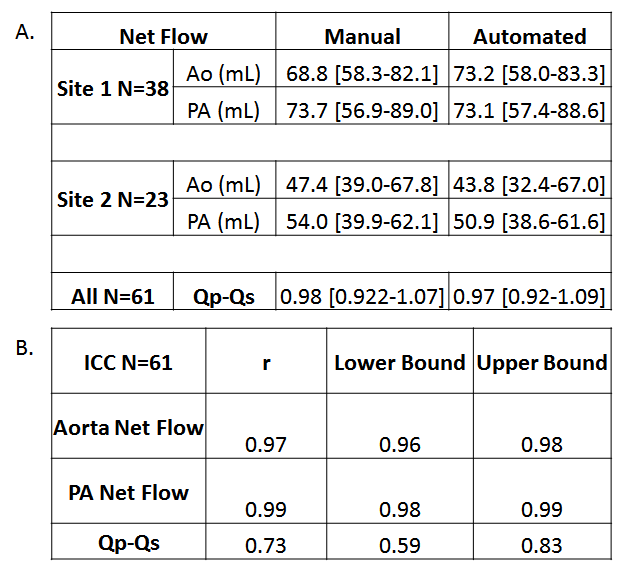
The CNN took on average 0.34±0.12 seconds to segment the aorta and PA compared to 15 minutes manually. The median Dice score of the entire cohort was 0.89 [0.86-0.93] for the aorta and 0.88 [0.83-0.91] for the PA. Three examples of the manual (red) and automated (blue) segmentation as well as a difference map are provided in Figure 3. Figure 3A shows an example of a Site 1 control which had Dice scores of Ao: 0.91, PA: 0.92. Figure 3B shows the results for a Site 1 TOF patient, obtaining Dice scores of Ao: 0.89, PA: 0.88, and Figure 3C showed a Site 2 patient with Dice scores of Ao: 0.91, PA: 0.93. For flow comparisons, the Bland Altman, the flow metrics, and ICC comparisons are provided in Figure 4 and Table 1, respectively. Four Site 1 and two Site 2 datasets were excluded from the flow analysis due to severe aliasing in the aorta or PA. Table 1A summarizes the flow metrics in the aorta and PA across the entire cohort. Bland-Altman plots showed moderate to good agreement across all comparisons between 10%-24% difference from the mean manually generated reference values (Figure 4), and ICC comparisons (Table 1B) similarly showed between moderate to excellent agreement, between 0.74-0.99 ICC coefficients.Discussion
In this study, we present initial CNN results showing an automated multi-label segmentation of the aorta and PA from 4D flow MRI in patients with multiple pathologies, from two centers with different vendors. The results indicate a slight performance bias for Site 1, likely due to the data imbalance of roughly 2:1 between Site 1 and 2. Future work will incorporate more datasets and build a more balanced cohort across additional centers and vendors to improve the model.Acknowledgements
R01HL115828
R01HL133504
F30HL145995
References
1. Berhane, H., et al., Artificial intelligence-based fully automated 3D segmentation of the aorta from 4D flow MRI. SMRA2019, 2019.
2. Çiçek, Ö., et al. 3D U-Net: Learning Dense Volumetric Segmentation from Sparse Annotation. 2016. Cham: Springer International Publishing.
3. Huang, G., et al., Densely Connected Convolutional Networks. 2017 IEEE Conference on Computer Vision and Pattern Recognition (CVPR), 2017. DOI: 10.1109/cvpr.2017.243.
Figures