0744
Impeded diffusion fraction model for multi-exponential DWI: demonstration in kurtosis phantom and prostate cancer1University of Michigan, Ann Arbor, MI, United States
Synopsis
Majority of current clinical MRI protocols continue to use DWI qualitatively, as an indicator of impeded diffusion evident from sustained signal at high b-values. Quantitative microenvironment description relying on multi-exponential diffusion models is precluded by required prolonged multi-b acquisition and high resolution/SNR not routinely achievable in clinical setting. This study presents a model based on multi-compartment formalism to quantify impeded diffusion fraction (IDF, of water coordinated by macromolecules) from conventional clinical DWI acquisition. The physical origin for IDF is verified using two-compartment diffusion kurtosis phantom, and application example is demonstrated for prostate cancer.
INTRODUCTION
Multi-exponential diffusion observed for complex tumor microenvironment is typically modelled by non-Gaussian DWI signal decay1,2 and/or multiple diffusion compartments2,3. Wide clinical adoption of quantitative diffusion metrics derived from these advanced diffusion models is hindered by necessity of prolonged multi-b acquisitions, as well as, intrinsic dependence of derived parameters on acquired b-range2,4 and corresponding model constraints1-4. Here we present multi-compartment diffusion formalism applicable to conventional clinical DWI acquisition to quantify impeded diffusion fraction (IDF, for water coordinated around macromolecules) of potential interest for wide range of clinical cancer imaging applications2,5,6.METHODS
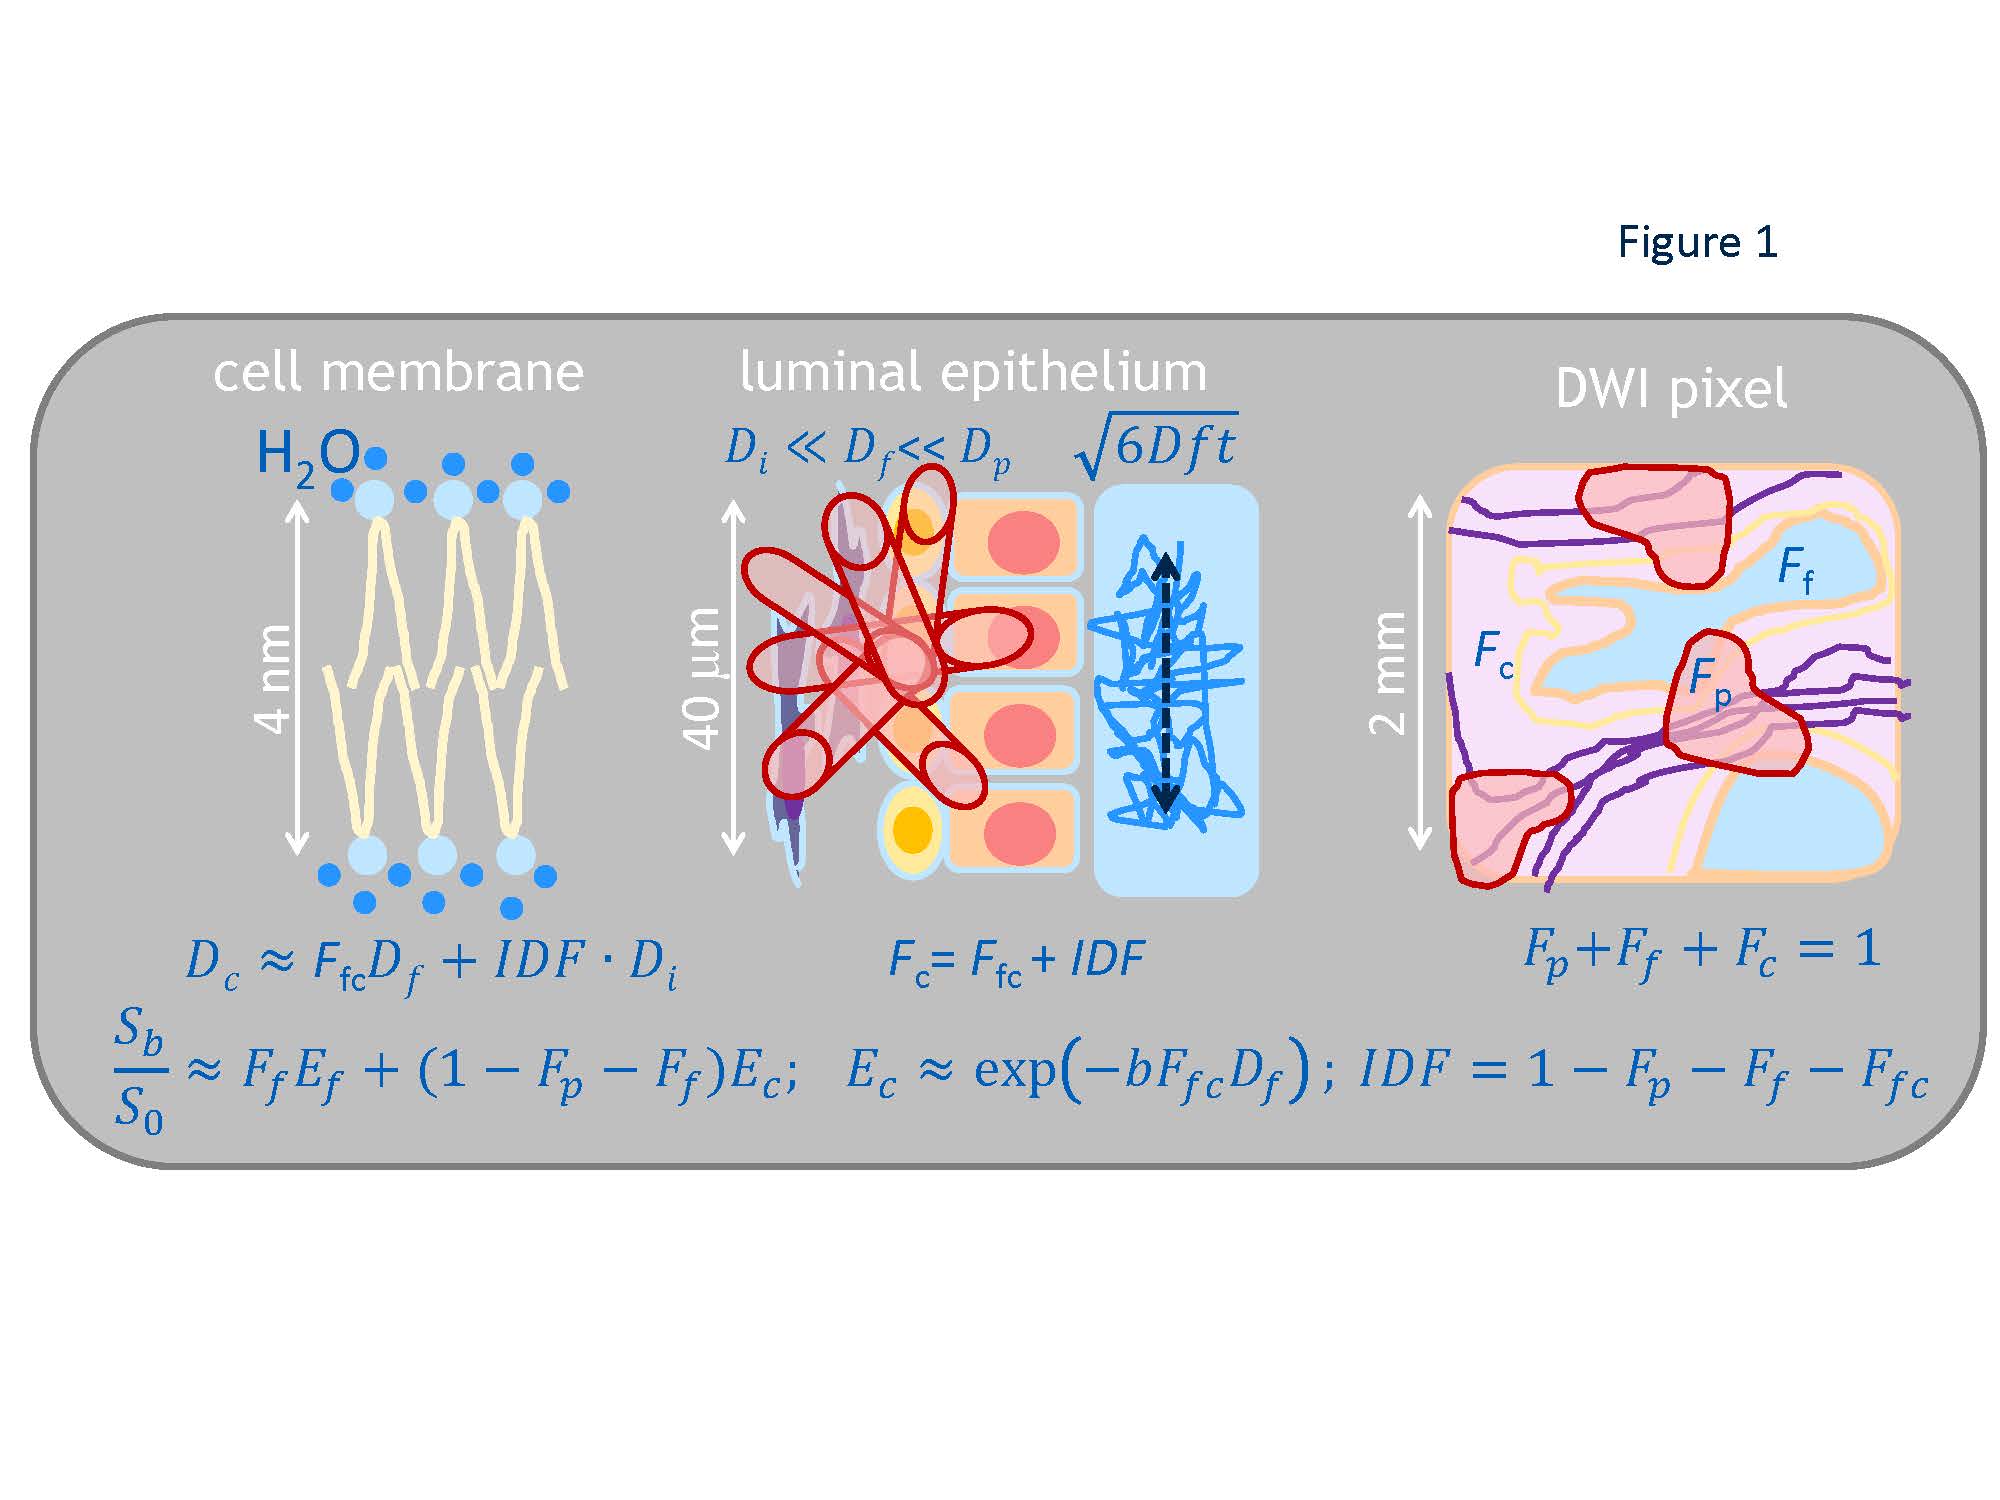
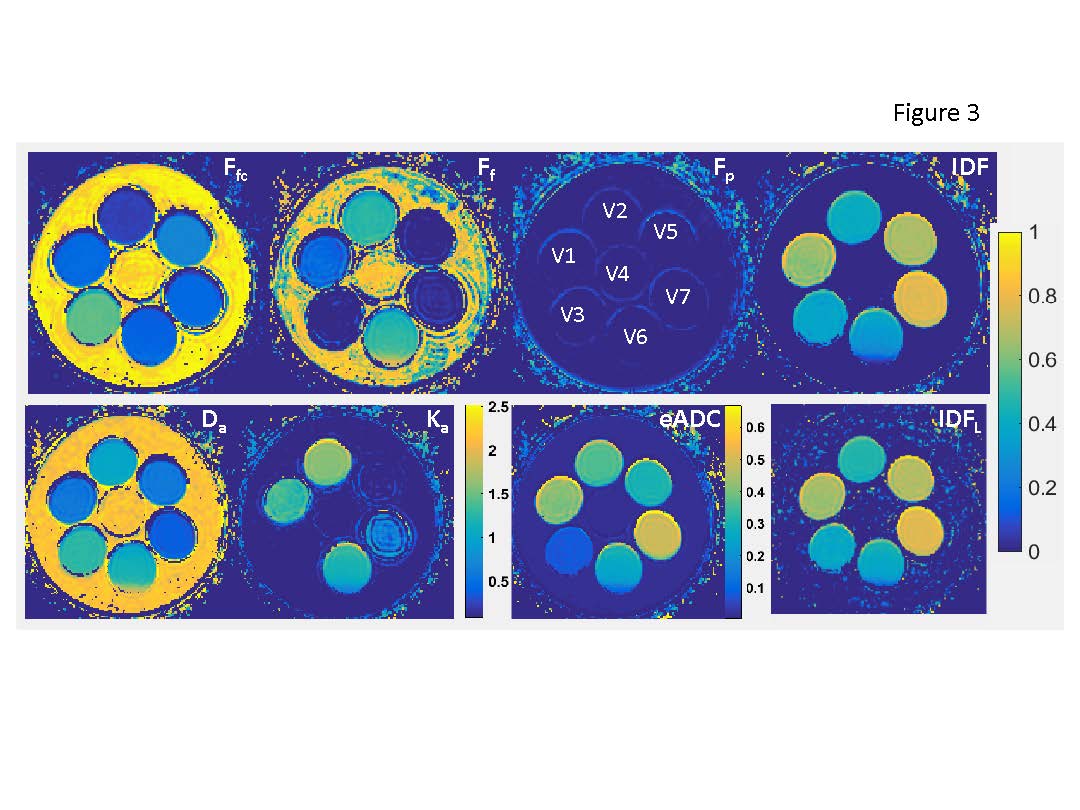
IDF model: The IDF formalism (Figure 1) assumes sub-mm partial-volume contributions to signal intensity, Sb, in a typical clinical DWI voxel (~10mm3) from free water, Ff, capillary pseudo-diffusion, Fp, and extra/intra-cellular water, Fc. Fixed diffusion rates in free and perfused sub-volumes are determined, respectively, by water temperature (Df = 3μm2/ms @37˚C)7 and ~5μm-capillary pressure gradient (Dp>30μm2/ms>>Df ).4 Sub-cellular Dc is approximated by a population average of water self-diffusion (Dcf=FfcDf) and collective-diffusion impeded/coordinated by macromolecules (Dci=IDF·Di, Di<.03μm2/ms<<Df)8. When Ef-->0 (b>1.5ms/μm2, Ffc<0.5), Fig.1 DWI model can be “linearized” to derive IDFL as (Eq.[1]): log(Sb/S0)=C1+C2·b; Ffc=-C2/Df; Fc=exp(C1); IDFL=exp(C1)+C2/Df .Phantom and in vivo DWI: The previously described kurtosis phantom9, included materials (Figure 3)with restricted diffusion in micro-vesicles (V1:2.8μm, V2:1.6μm), as well as, mono-exponential (ME) diffusion polyvinylpirrolidone (PVP) media (V3:20%PVP, V5:40%PVP).10 V1 and V2 provided model system with bulk, Ff, and vesicular, Ffc, from nanoscale lamella water compartments proportional to vesicle sizes V1:V2~1.8. V3 and V5 provided single nanoscale hydration-coordination compartment (<10nm, Ff=0)11, ME diffusion-rate scaling with solute concentration (Dc(V3):Dc(V5)=1.3:0.6~2).
The phantom DWI were acquired using b=0,.05,.1,.2,.5,.8,1,1.5,2,2.5,3ms/μm2, echo-time (TE) = 105ms, repetition-time (TR)=10s, voxel-size (VS)=1.7x1.7x5mm3. Phantom Df=2.15μm2/s was measured at room temperature for V4 (0%PVP) with bmax=1.5ms/μm2. The example in vivo multi-b DWI data set for prostate cancer (PCa)12 was shared through The Cancer Imaging Archive (TCIA) for as de-identified DICOM. The PCa DWI were acquired12 using 15 b-values (b = 0,.05,.1,.2,.5,.8,1,1.5,2,2.5,3ms/mm2) with TE=68ms; TR=4s; VS=1.5x1.5x4mm3. The PCa tumor lesion labels were assigned from histopathology.12
Data analysis: The IDF performance was compared to conventional apparent diffusion coefficient (ADC) and isotropic kurtosis model parameters: apparent diffusion, Da, and kurtosis, Ka. The nonlinear IDF fit (Fig.1) was performed for b≥.1μs/mm2 of kurtosis phantom and PCa. All fit fractions were constrained between 0 and 1 (0 & .9 in vivo ). Unconstrained linear fits were performed for log(Sb/S0)of ME: log(FADC)-ADC·b; kurtosis: -Dab+Ka(Dab)2/6), and IDFL (Eq.[1].) Linear IDFL fit utilized subset of b-values typical of clinical DWI protocols2,5,6 (ms/μm2): 1 and 2 (PCa) and 1,1.5, and 2 (phantom). Conventional ME ADC fit used all .1<b<2ms/μm2 with subsequent generation of eADC=exp(-bmaxADC)map. Data analysis utilized MATLAB R2015b curve-fitting toolboxes (Mathworks, Natick MA).
RESULTS AND DISCUSSION
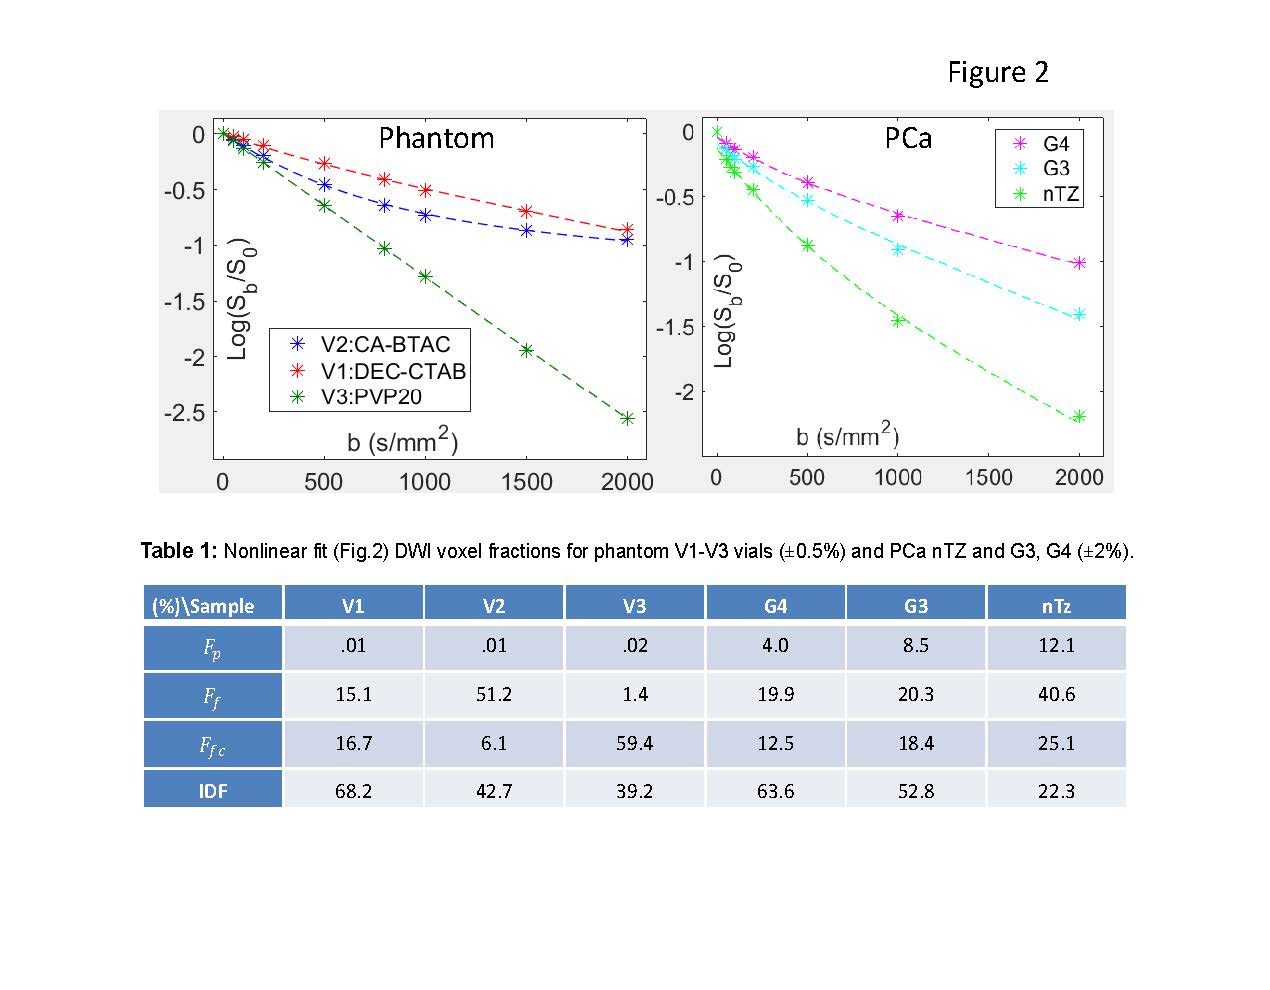
Figure 2 illustrates good fidelity of voxel-based IDF DWI model fit both for single (V3) and multi-compartment (V1,V2) phantom (Fig.2a) and wide-range of PCa histology (Fig.2b). The relative fit fractions (Fig.2, Table 1) reflect physical phantom properties. Total fit free water Ff+Ffc ratios (V2:V1~1.8; V3:V5~2) and IDF ratios (V1:V2~1.6; V5:V3~1.8) scale with vesicle size (volume/surface) and PVP concentration reflecting coordinated water fraction. PCa fit fractions (Fig.2, Table 1) are decreasing with increasing malignancy, consistent with increasing tissue density and macromolecule crowding. Among fit-fractions, IDF provides highest contrast between G3 and G4 cancers (11%), as well as, cancer versus normal (40%).Figure 3 IDF map effectively eliminates free water (Ff+Ffc~1) and linear IDFL≈IDF, with finite positive bias for Ff+Ffc>.5 (e.g., V2). Da of ME diffusion materials (V3,V5) scales with Ffc (inverse PVP concentration), while multi-exponential (V1,V2) show relative Da and Ka values scaling with Ff and inverse Ffc (and IDF). Relative Da contrast (V2:V1~1.7) is closer reflection of physical characteristics for phantom compartments (V1:V2 size) than Ka (V2:V1~1.2). IDF contrast is qualitatively similar to eADC, but b-independent and on linear-scale (Fig.3, color-bars).
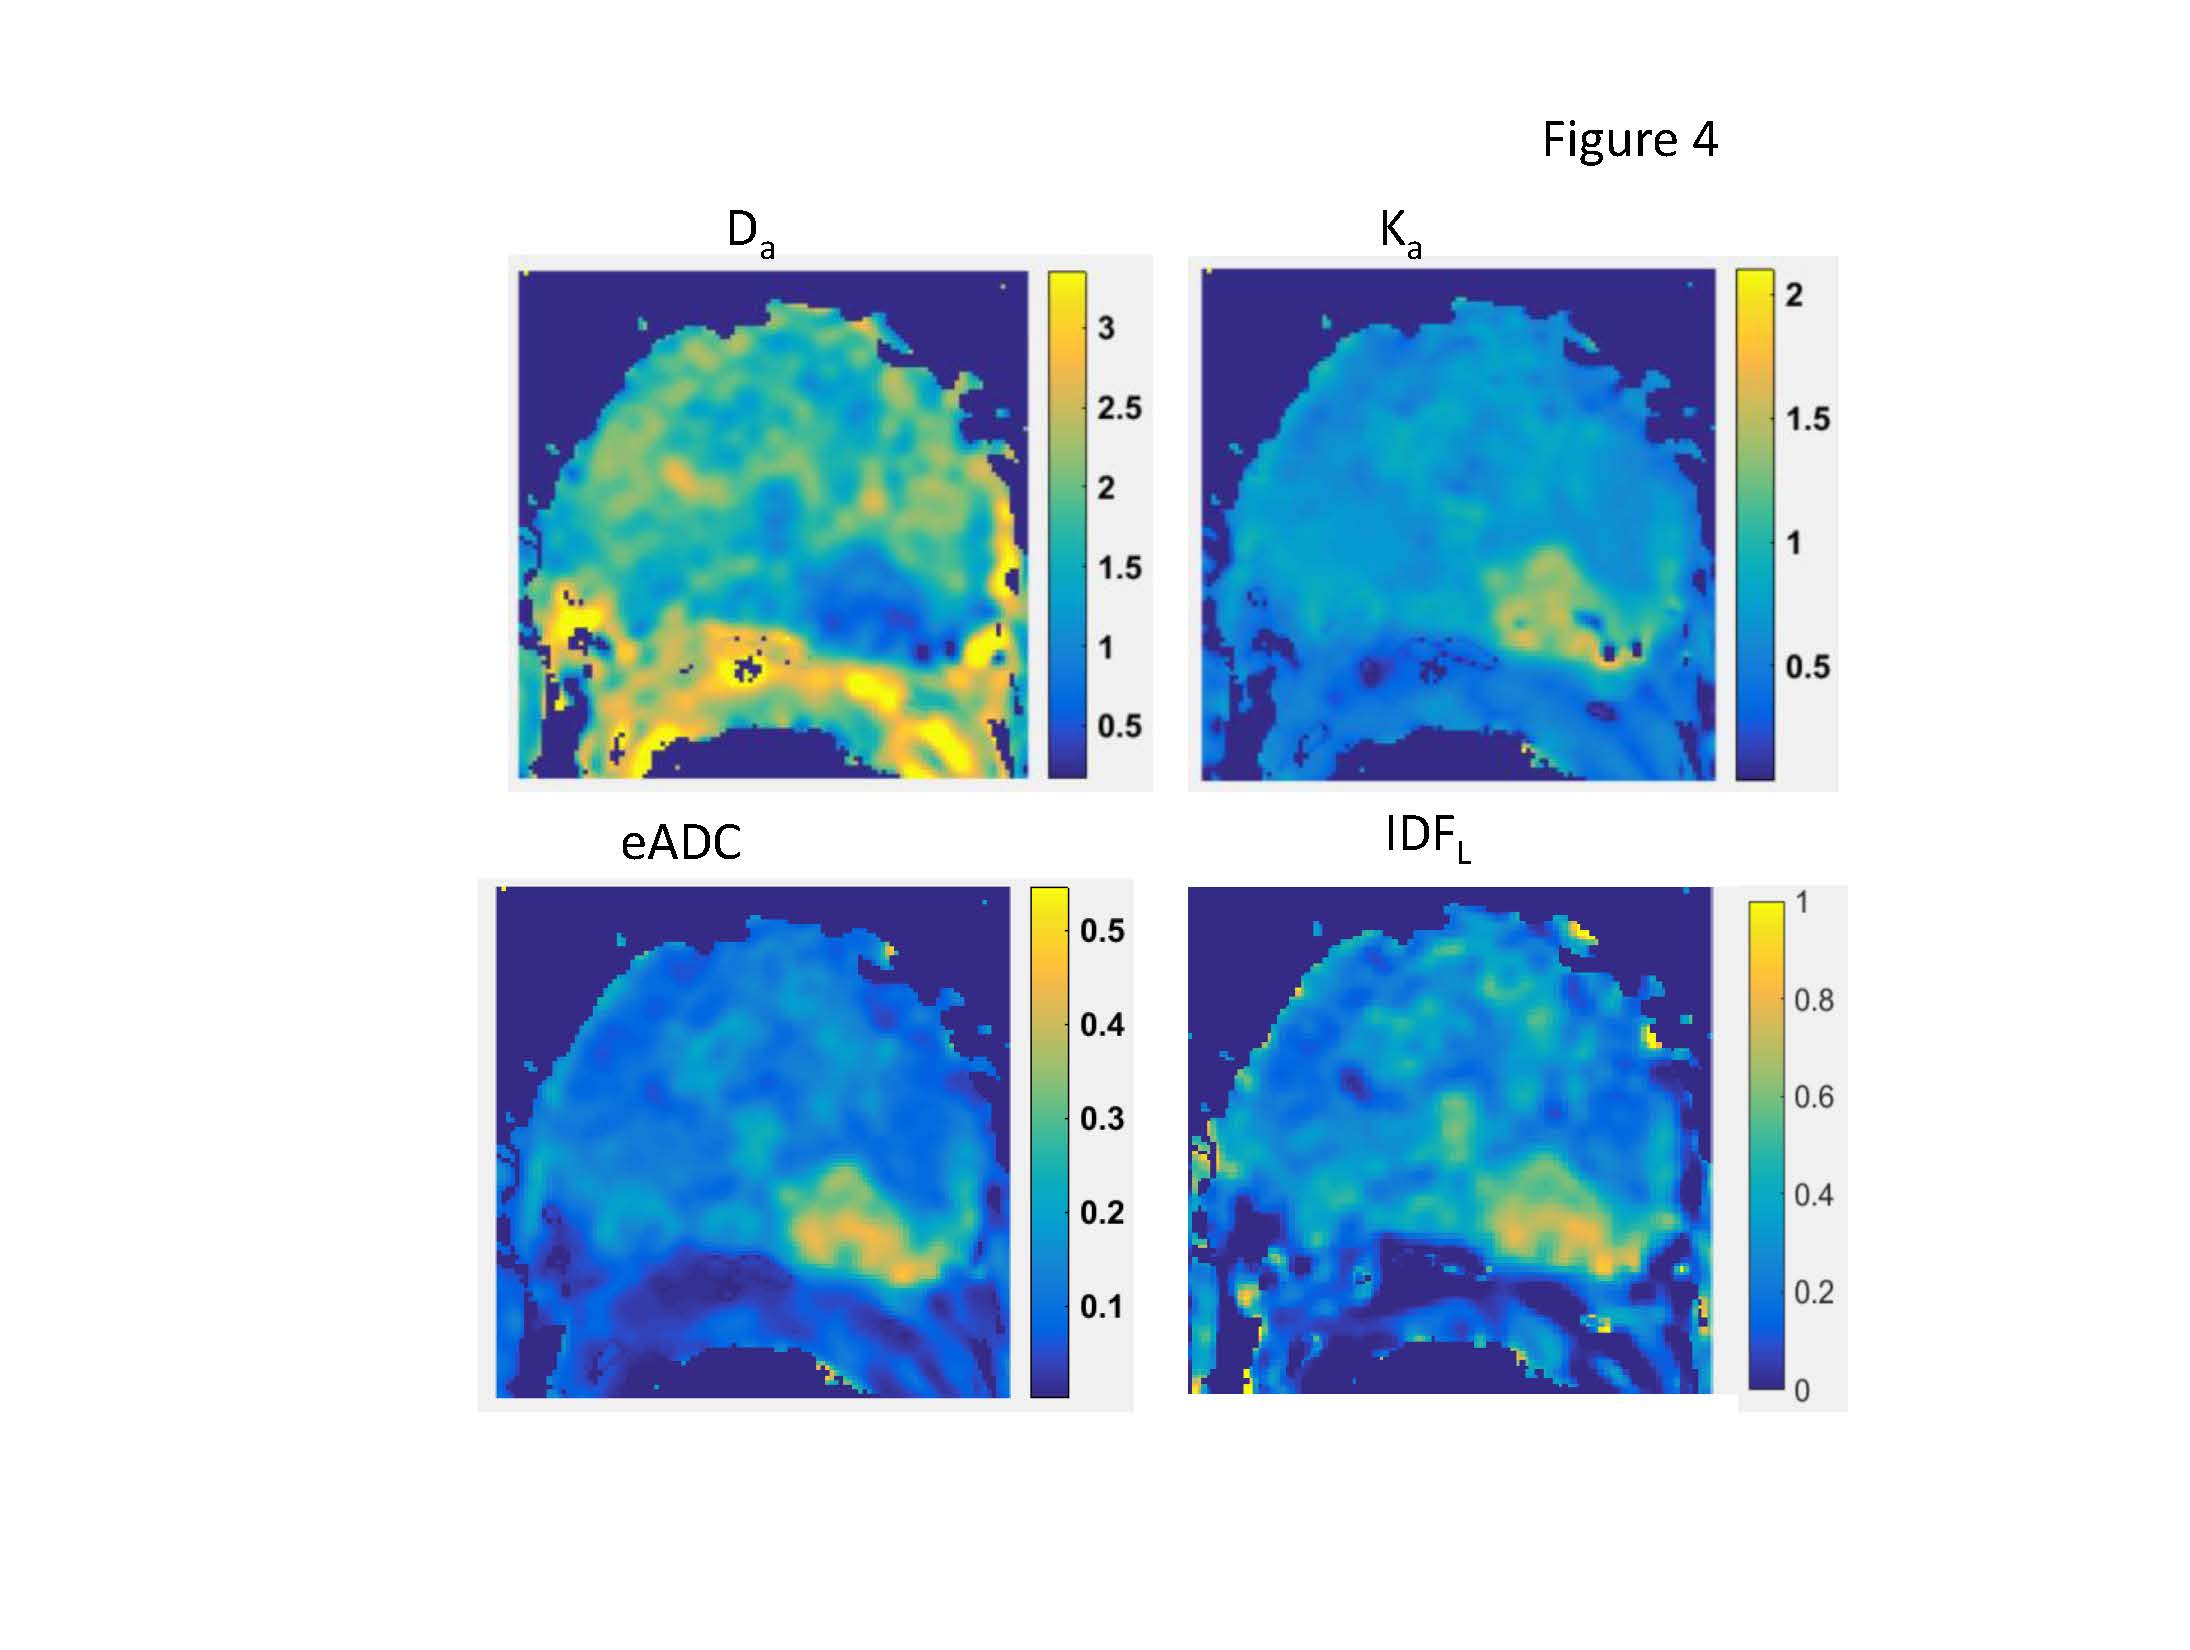
Similar to phantom results, prostate IDFL(Figure 4) effectively filters-off free (luminal) water contribution from large (sub-mm) secretory ducts and blood vessels confounding Da map in transition zone (TZ) and prostate base. It also shows better contrast between peripheral zone (PZ) atrophy (low IDF) and nTZ tissue compared to Da, Ka, or eADC. For the G3/G4 lesion (bright on eADC), IDFL evidently captures complementary5,13 Ka~1/Da contrast information, visually most similar to eADC, but on a linear scale.
In practice, the two b-values between 1<b<2 ms/μm2 would be optimal for IDFL evaluation in tissue with Ffc<.5 (Dc<1.5μm2/ms, typical of dense tumor6,12). In this range, conventional ME model ADC~DC=Ffc·Df, is consistent with reported ADC correlation to histopathology fractions3,12,13. IDF contrast could be particularly useful for characterization of glandular malignancies (e.g., prostate, breast, pancreas) obstructing secretory duct lumen (reducing Ff)3,14 and increasing macromolecular crowding (reducing Ffc)6,12. The linearized IDF solution is directly applicable for current clinical oncology DWI protocols, allowing for retrospective evaluation of previously acquired multi-b DWI data.
CONCLUSION
Phantom IDF scales linearly with increasing size of restricted microscale compartment and concentration of nanoscale macromolecular aggregates. Prostate IDF contrast eliminates capillary and luminal water background and scales with tissue density. Measured as counterpart of free water diffusion, IDF allows organ-independent b-range optimization for cancer DWI.Acknowledgements
Funding support from National Institutes of Health Grants: U01CA166104, U24CA237683, P01CA085878 and P30 CA008748. We thank our Quantitative Imaging Network (QIN) collaborator, Dr. Peter LaViolette (Medical College of Wisconsin) for providing access to multi-b DWI DICOM for histology-confirmed prostate cancer through The Cancer Imaging Archive (TCIA).References
1.Jensen JH, Helpern JA. MRI quantification of non-Gaussian water diffusion by kurtosis analysis. NMR Biomed. 2010; 23: 698–710.
2. Iima M, Le Bihan D. Clinical Intravoxel Incoherent Motion and Diffusion MR Imaging: Past, Present, and Future. Radiology. 2016; 278(1):13-32
3. Panagiotaki E, Chan RW, Nikolaos Dikaios N, et al. Microstructural Characterization of Normal and Malignant Human Prostate Tissue With Vascular, Extracellular, and Restricted Diffusion for Cytometry in Tumors Magnetic Resonance Imaging. Inv. Rad. 2015;50: 218–227.
4. Dyvorne H, Jajamovich G, Kakite S, Kuehn B, and Taouli B. Intravoxel Incoherent Motion Diffusion Imaging of the Liver: Optimal b-value Subsampling and Impact on Parameter Precision and Reproducibility. Eur J Radiol. 2014; 83(12): 2109–2113.
5. Rosenkrantz AB, Padhani AR, Chenevert TL, Koh DM, De Keyzer F, Taouli B, et al. Body diffusion kurtosis imaging: Basic principles, applications, and considerations for clinical practice. Journal of magnetic resonance imaging : JMRI. 2015;42(5):1190-202
6. Barkovich EJ, Shankar PR, Westphalen AC. A Systematic Review of the Existing Prostate Imaging Reporting and Data System Version 2 (PI-RADSv2) Literature and Subset Meta-Analysis of PI-RADSv2 Categories Stratified by Gleason Scores. Am J Roentgenol. 2019;212(4):847-54.
7. Holz M, Heil SR, Sacco A. Temperature-dependent self-diffusion coefficients of water and six selected molecular liquids for calibration in accurate H-1 NMR PFG measurements. Phys Chem Chem Phys. 2000;2(20):4740-2.
8. Trovato F, Tozzini V. Diffusion within the Cytoplasm: A Mesoscale Model of Interacting Macromolecules. Biophys. J. 2014, 107(11) 2579–91
9. Swanson S, Malyarenko D, Chenevert T. Tunable diffusion kurtosis in lamellar vesicle suspensions toward development of quantitative phantom surrogate of tumor microenvironment. Proc. Intl Soc Mag Reson Med 2019, TP3632, Montreal CA.
10. Pierpaoli C, Sarlls J, Nevo U, Basser PJ, Horkay F, editors. Polyvinylpyrrolidone (PVP) water solutions as isotropic phantoms for diffusion MRI studies. Proc. Intl Soc Magn Reson Med; 2009; Honolulu HI.
11. Rashid R, Sheng Jie Lim N, Min Ling Chee S, et al. Novel Use for Polyvinylpyrrolidone as a Macromolecular Crowder for Enhanced Extracellular Matrix Deposition and Cell Proliferation. Tissue Eng. C, 2014; 20(12): 994:1002
12. Hurrel SL, McGarry SD, Amy Kaczmarowski A, Iczkowsk KA, et al. Optimized b-value selection for the discrimination of prostate cancer grades, including the cribriform pattern, using diffusion weighted imaging. J Med. Imaging 5(1), 011004
13. Hectors SJ, Semaan S, Song C, Lewis S, et al. Advanced Diffusion-weighted Imaging Modeling for Prostate Cancer Characterization: Correlation with Quantitative Histopathologic Tumor Tissue Composition-A Hypothesis-generating Study. Radiology 2018;286(3):918-28.
14. Carlin D, Orton MR, Collins D, Nandita M. deSouza NM. Probing Structure of Normal and Malignant Prostate Tissue Before and After Radiation Therapy With Luminal Water Fraction and Diffusion-Weighted MRI. J. Magn. Reson. Imaging 2019; 50:619–627
Figures