0743
Perivascular space fluid contribute to diffusion signal attenuation at low b-value, revisiting extra-cellular space diffusion
Farshid Sepehrband1
1Stevens Neuroimaging and Informatics Institute, Keck School of Medicine, USC, Los Angeles, CA, United States
1Stevens Neuroimaging and Informatics Institute, Keck School of Medicine, USC, Los Angeles, CA, United States
Synopsis
Figure 3. Top row: high resolution T2 SPACE image at 7T and manual segmentation results of PVS, highlighting the large presence of PVS across the brain. Second row: a schematic representation of a given conservatively drawn PVS is shown (high resolution images suggested that the PVS has a higher thickness compared to what is shown here). The PVS is presented aside electron microscopy images of white matter axons (as a rough reference).
Introduction
PVS accommodates glia-lymphatic molecular exchange with interstitial fluid (i.e. parenchymal fluid), hence is a pivotal component of the extra-cellular space (ECS). Unlike the highly hindered interstitial fluid of the white matter, water molecules of PVS fluid could diffuse relatively unbounded during the course of a conventional diffusion MRI. Therefore, even a small volume fractionof the PVS fluid in the imaged voxel has a large signal contribution (high signal fraction). The signal change due to PVS presence could appear similar to the perfusion-related signal change or IVIM. Therefore, to elucidate on the PVS-related signal contribution, we looked at diffusion signal change in two regions of the basal ganglia: 1) high vascular presence with low PVS; 2) high vascular presence with high PVS. We then compared them to diffusion signal change at low b-value (<1000 s/mm2).Method
Image acquisition was performed using a 7T Terra whole-body MR system [Magnetom Terra, Siemens Healthcare, Erlangen, Germany], equipped with 8-channel pTx array capability [a Medical, Inc., Wilmington, MA] to image a healthy 27-years-old male volunteer. The institutional review board of the insatiate approved the study. Informed consent was obtained from the volunteers, and the image datasets were anonymized. First-level controlled SAR mode was employed for 3D structural imaging sequences to ensure FDA guidelines (3.2W/kg on head) were met. A high resolution Sagittal T2-weighted SPACE image was acquired with 0.3 x 0.3 x 0.4 mm resolution which enabled the identification of parts of the white matter vasculatures. Following parameters were used: GRAPPA=3, TR/TE=2320/299ms, flip angle=120, 2 averages, scan time 24min. Commercially available patient-specific shimming for the parallel transit coil array was used to enhance B1+ homogeneity, which is often affected with single transit head coil at ultra-high fields. All configurations were matched to the highest SAR-limit allowed input voltage, and they had the same sequence parameters. To mitigate the accentuated CSF pulsation artifact, flow compensation was applied. Two regions of the putamen of the basal ganglia with high vascular density were manually segmented, one with low PVS presence and one with high PVS presence (Figure 1). Basal ganglia was chosen since it is one of the known regions with high vascular presence, relatively low microstructural directional dependency of diffusion signal (in comparison with white matter bundles), and presence of vessels with low PVS presence. We then acquired a multi-shell diffusion MRI. Fifty minutes of scan was conducted to acquire diffusion MRI volumes at following b-values: 0, 200, 400, 600, 800 s/mm2with fixed echo time of 65ms and TR=4400ms and isotropic resolution of 1.3 mm3. Thirty gradient-encoding directions per shell were acquired in both anterior-posterior and posterior-anterior phase encoding directions. dcm2niiwas used to convert the dicomimages to the niftifile format [3]. Diffusion MRI data was corrected for subject motion, eddy current, EPI distortion. FSL’s TOPUP was used to correct for B0-inhomogeneity distortion using two opposing phase encoded images [4]. FSL's EDDY was used to correct for current induced field inhomogeneity and subject’s head motion [5], followed by correction for the gradient nonlinearity. High resolution T2space image and drawn masks of regions of interest were overlaid on diffusion MR images and corrected for misclassified voxels due to motion or voxel size difference. We then measured average diffusion signal at these voxels across diffusion-weighted gradients and compared them across these two regions. Initially, no modeling was performed, and only the diffusion signal attenuation profile was used for comparison. Log(S) at the experiment b-values were also plotted to evaluate the degree of exponentiality across these regions. Estimates of PVS and vessel caliber from high resolution imaging were used to compare the PVS fluid contribution to that from parenchymal ECS and was schematically compared with white matter tissue.Results
Experimental data showed that PVS fluid explains fast diffusion signal decay at low b-value. The region with high PVS exhibits a faster signal decay (Figure 2). As expected, a higher proton density was also noted in the high PVS region (higher S0 signal). High resolution T2 images resolved both vessels and PVS in certain regions, which was used to present a schematic view of the PVS fluid relative to tissue microstructure (Figure 3). The schematic view was presented to highlight the large PVS signal fraction presence even with the small PVS volume fraction. A simple simulation on that basis showed that in a given white matter diffusion MRI voxel with the presence of even one meso-scale PVS-filled vessel, we could expect ~25% signal fraction from PVS fluid (and much larger contribution to ECS signal fraction at low b-value).Discussion
Results suggest that PVS fluid has significant contribution to diffusion signal change at low b-value, beyond perfusion related signal change or IVIM. PVS has a notable presence throughout the brain and given the low volume fraction of parenchymal ECS, it can have a large signal fraction. We suggest that ECS fluid is comprised of two fluid pools with district diffusion profiles: slow diffusing fluid of parenchymal ECS (e.g. fluid between unmyelinated axons), and fast diffusing fluid of PVS (fluid between vessel wall and tissue parenchyma). This demands a revisit of the ECS modeling and if ignored could bias interpretation.Acknowledgements
This work was supported by NIH grants: 2P41EB015922-21, 1P01AG052350-01 and USC ADRC 5P50AG005142 and R01NS100973. The content is solely the responsibility of the authors and does not necessarily represent the official views of the NIH.References
[1] M. Krueger and I. Bechmann, “CNS pericytes: concepts, misconceptions, and a way out,” Glia, vol. 58, no. 1, pp. 1–10, 2010.[2] E. T. Zhang, C. B. Inman, and R. O. Weller, “Interrelationships of the pia mater and the perivascular (Virchow-Robin) spaces in the human cerebrum.,” J. Anat., vol. 170, p. 111, 1990.[3] X. Li, P. S. Morgan, J. Ashburner, J. Smith, and C. Rorden, “The first step for neuroimaging data analysis: DICOM to NIfTI conversion,” J. Neurosci. Methods, vol. 264, pp. 47–56, 2016.[4] J. L. R. Andersson, S. Skare, and J. Ashburner, “How to correct susceptibility distortions in spin-echo echo-planar images: Application to diffusion tensor imaging,” Neuroimage, vol. 20, no. 2, pp. 870–888, 2003.[5] J. L. R. Andersson, J. Xu, E. Yacoub, E. Auerbach, S. Moeller, and K. Ugurbil, “A Comprehensive Gaussian Process Framework for Correcting Distortions and Movements in Diffusion Images,” in Joint Annual Meeting ISMRM-ESMRMB, 2012, vol. 20, p. 2426.Figures
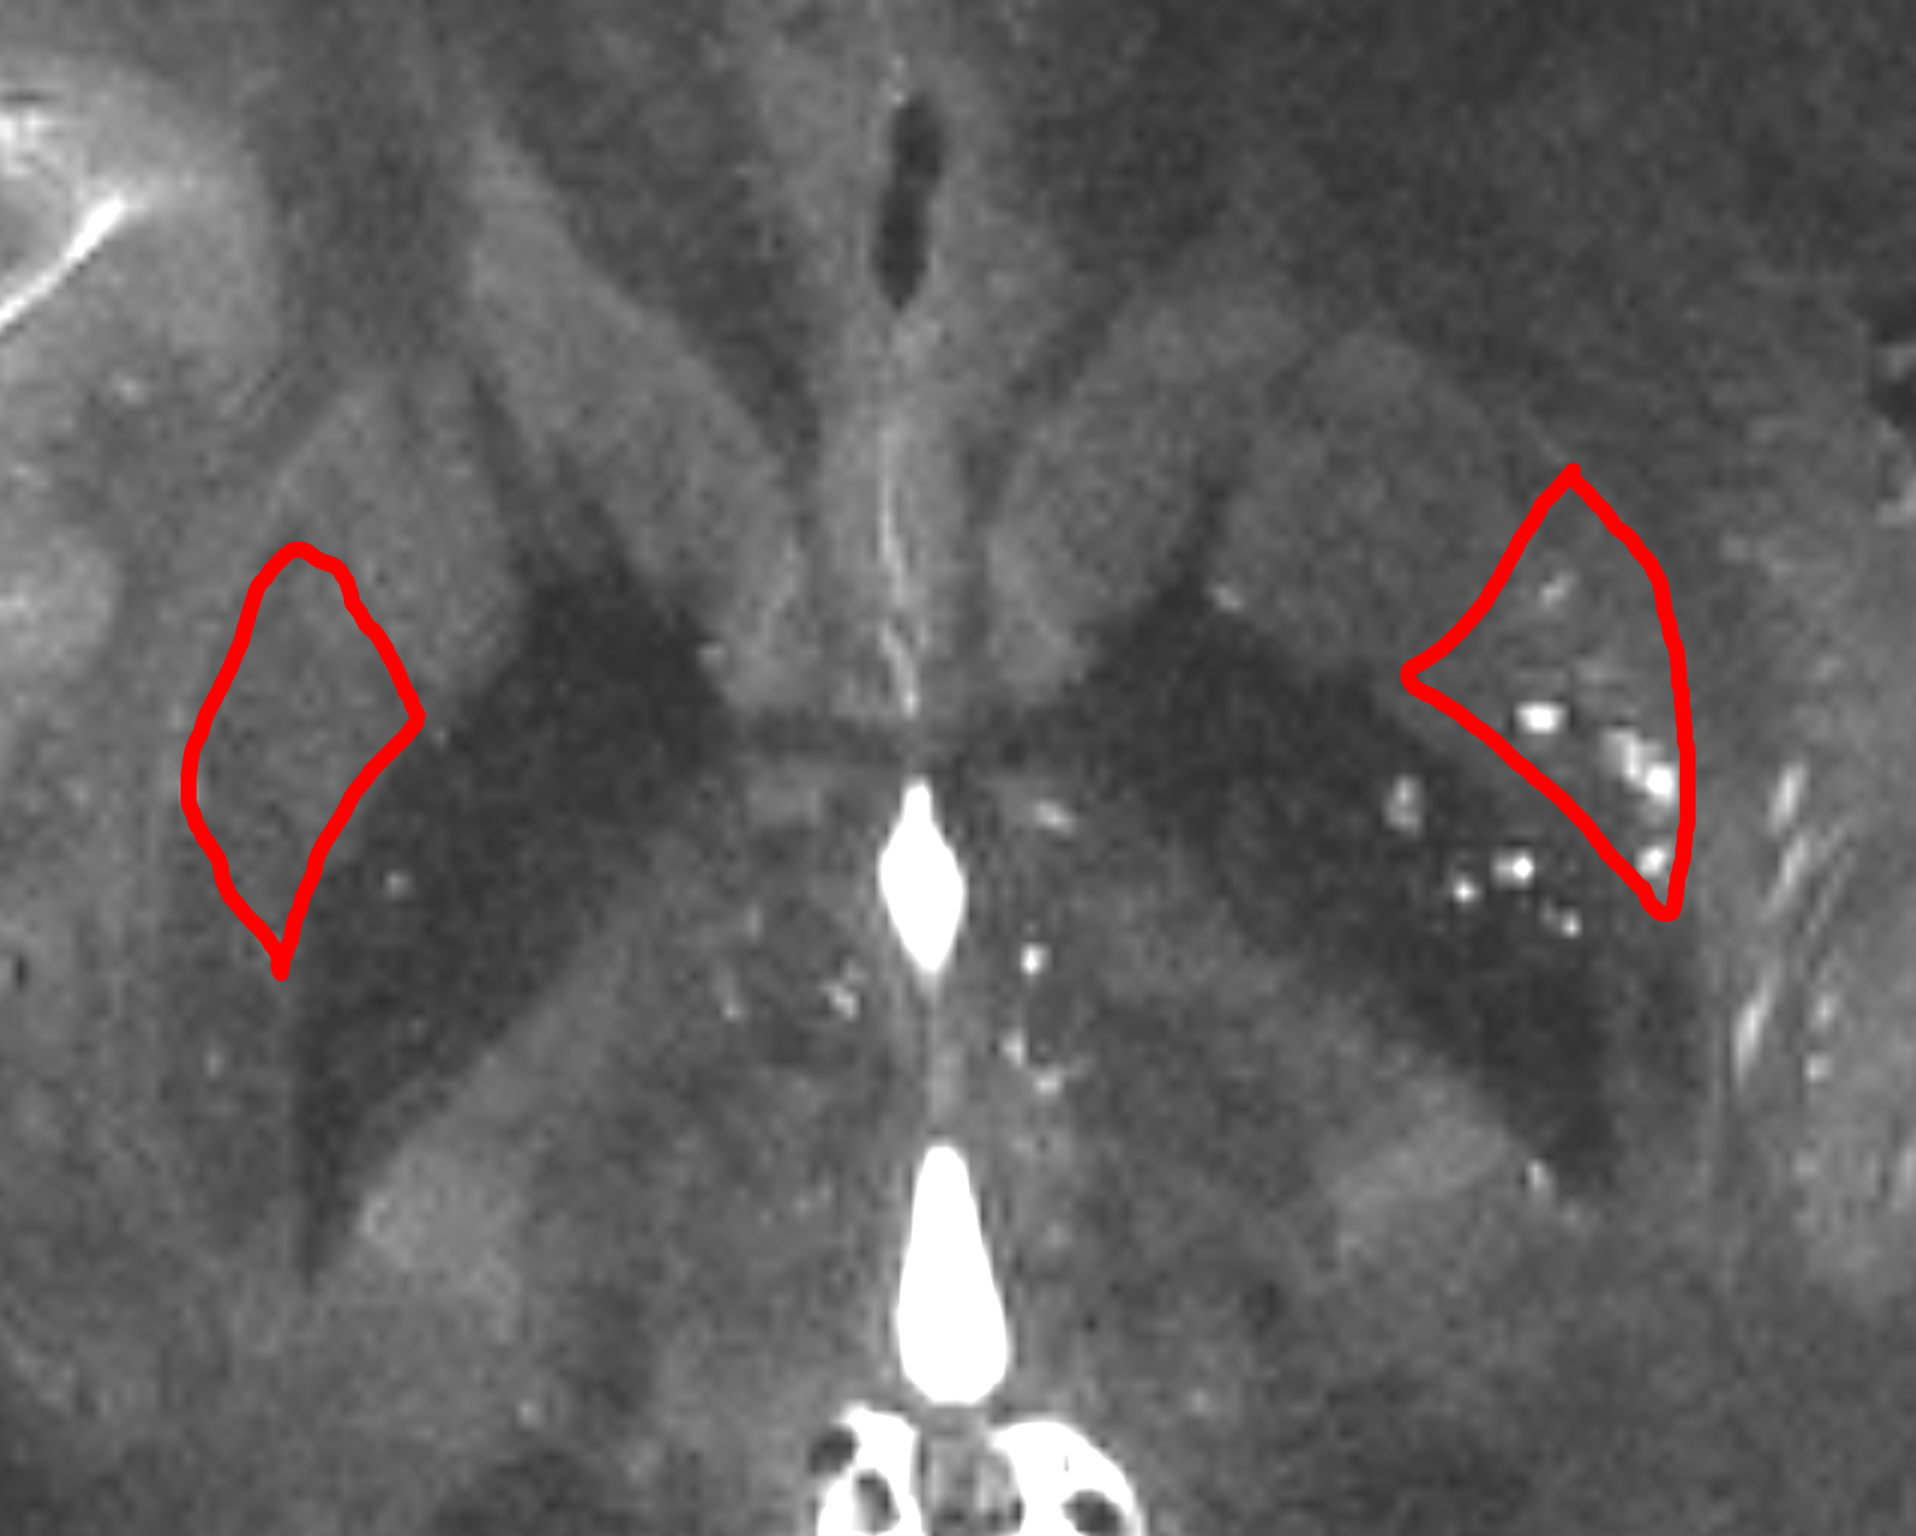
Figure 1. studied regions with high vascular presence (lenticulostriate arteries penetrate into the putamen and basal ganglia and have significant presence throughout). Two regions with low PVS (left ROI) and high PVS (right ROI) presence were selected.
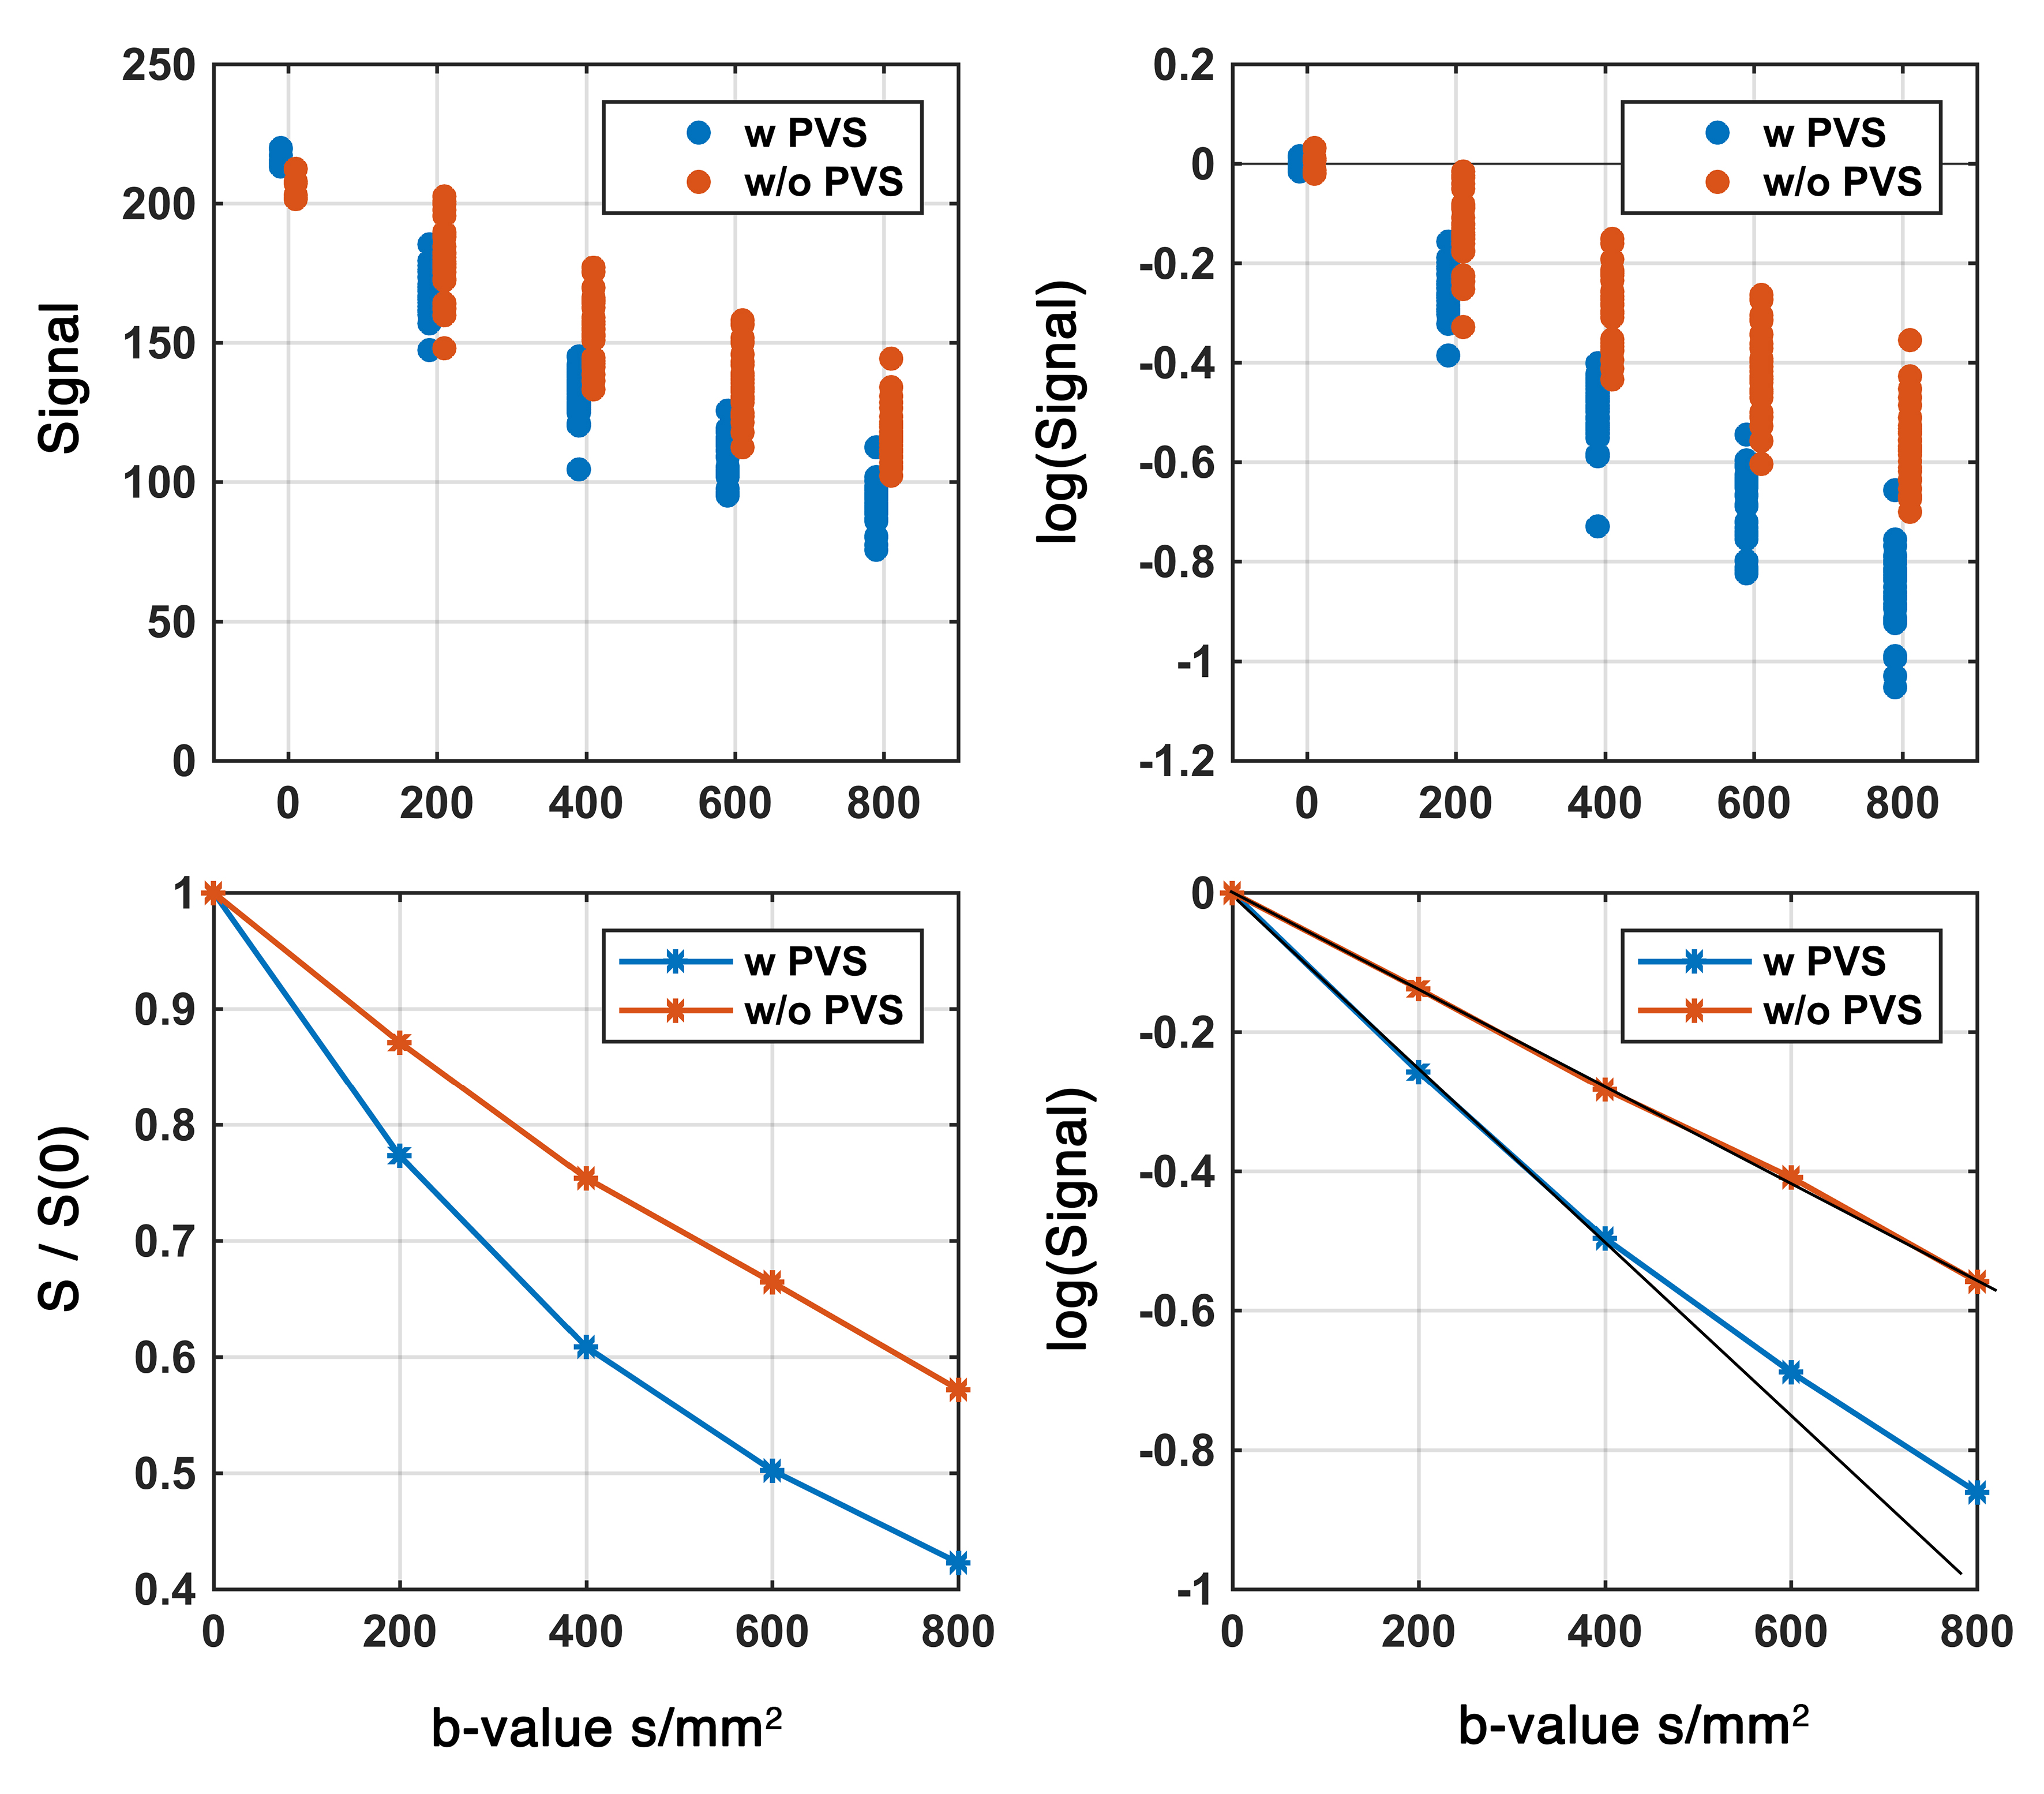
Figure 2. Diffusion signal at low b-value in two regions with and without PVS. Presence of the PVS contributed to the accelerated signal attenuation at low b-value and resulted to a bi-exponential signal profile.
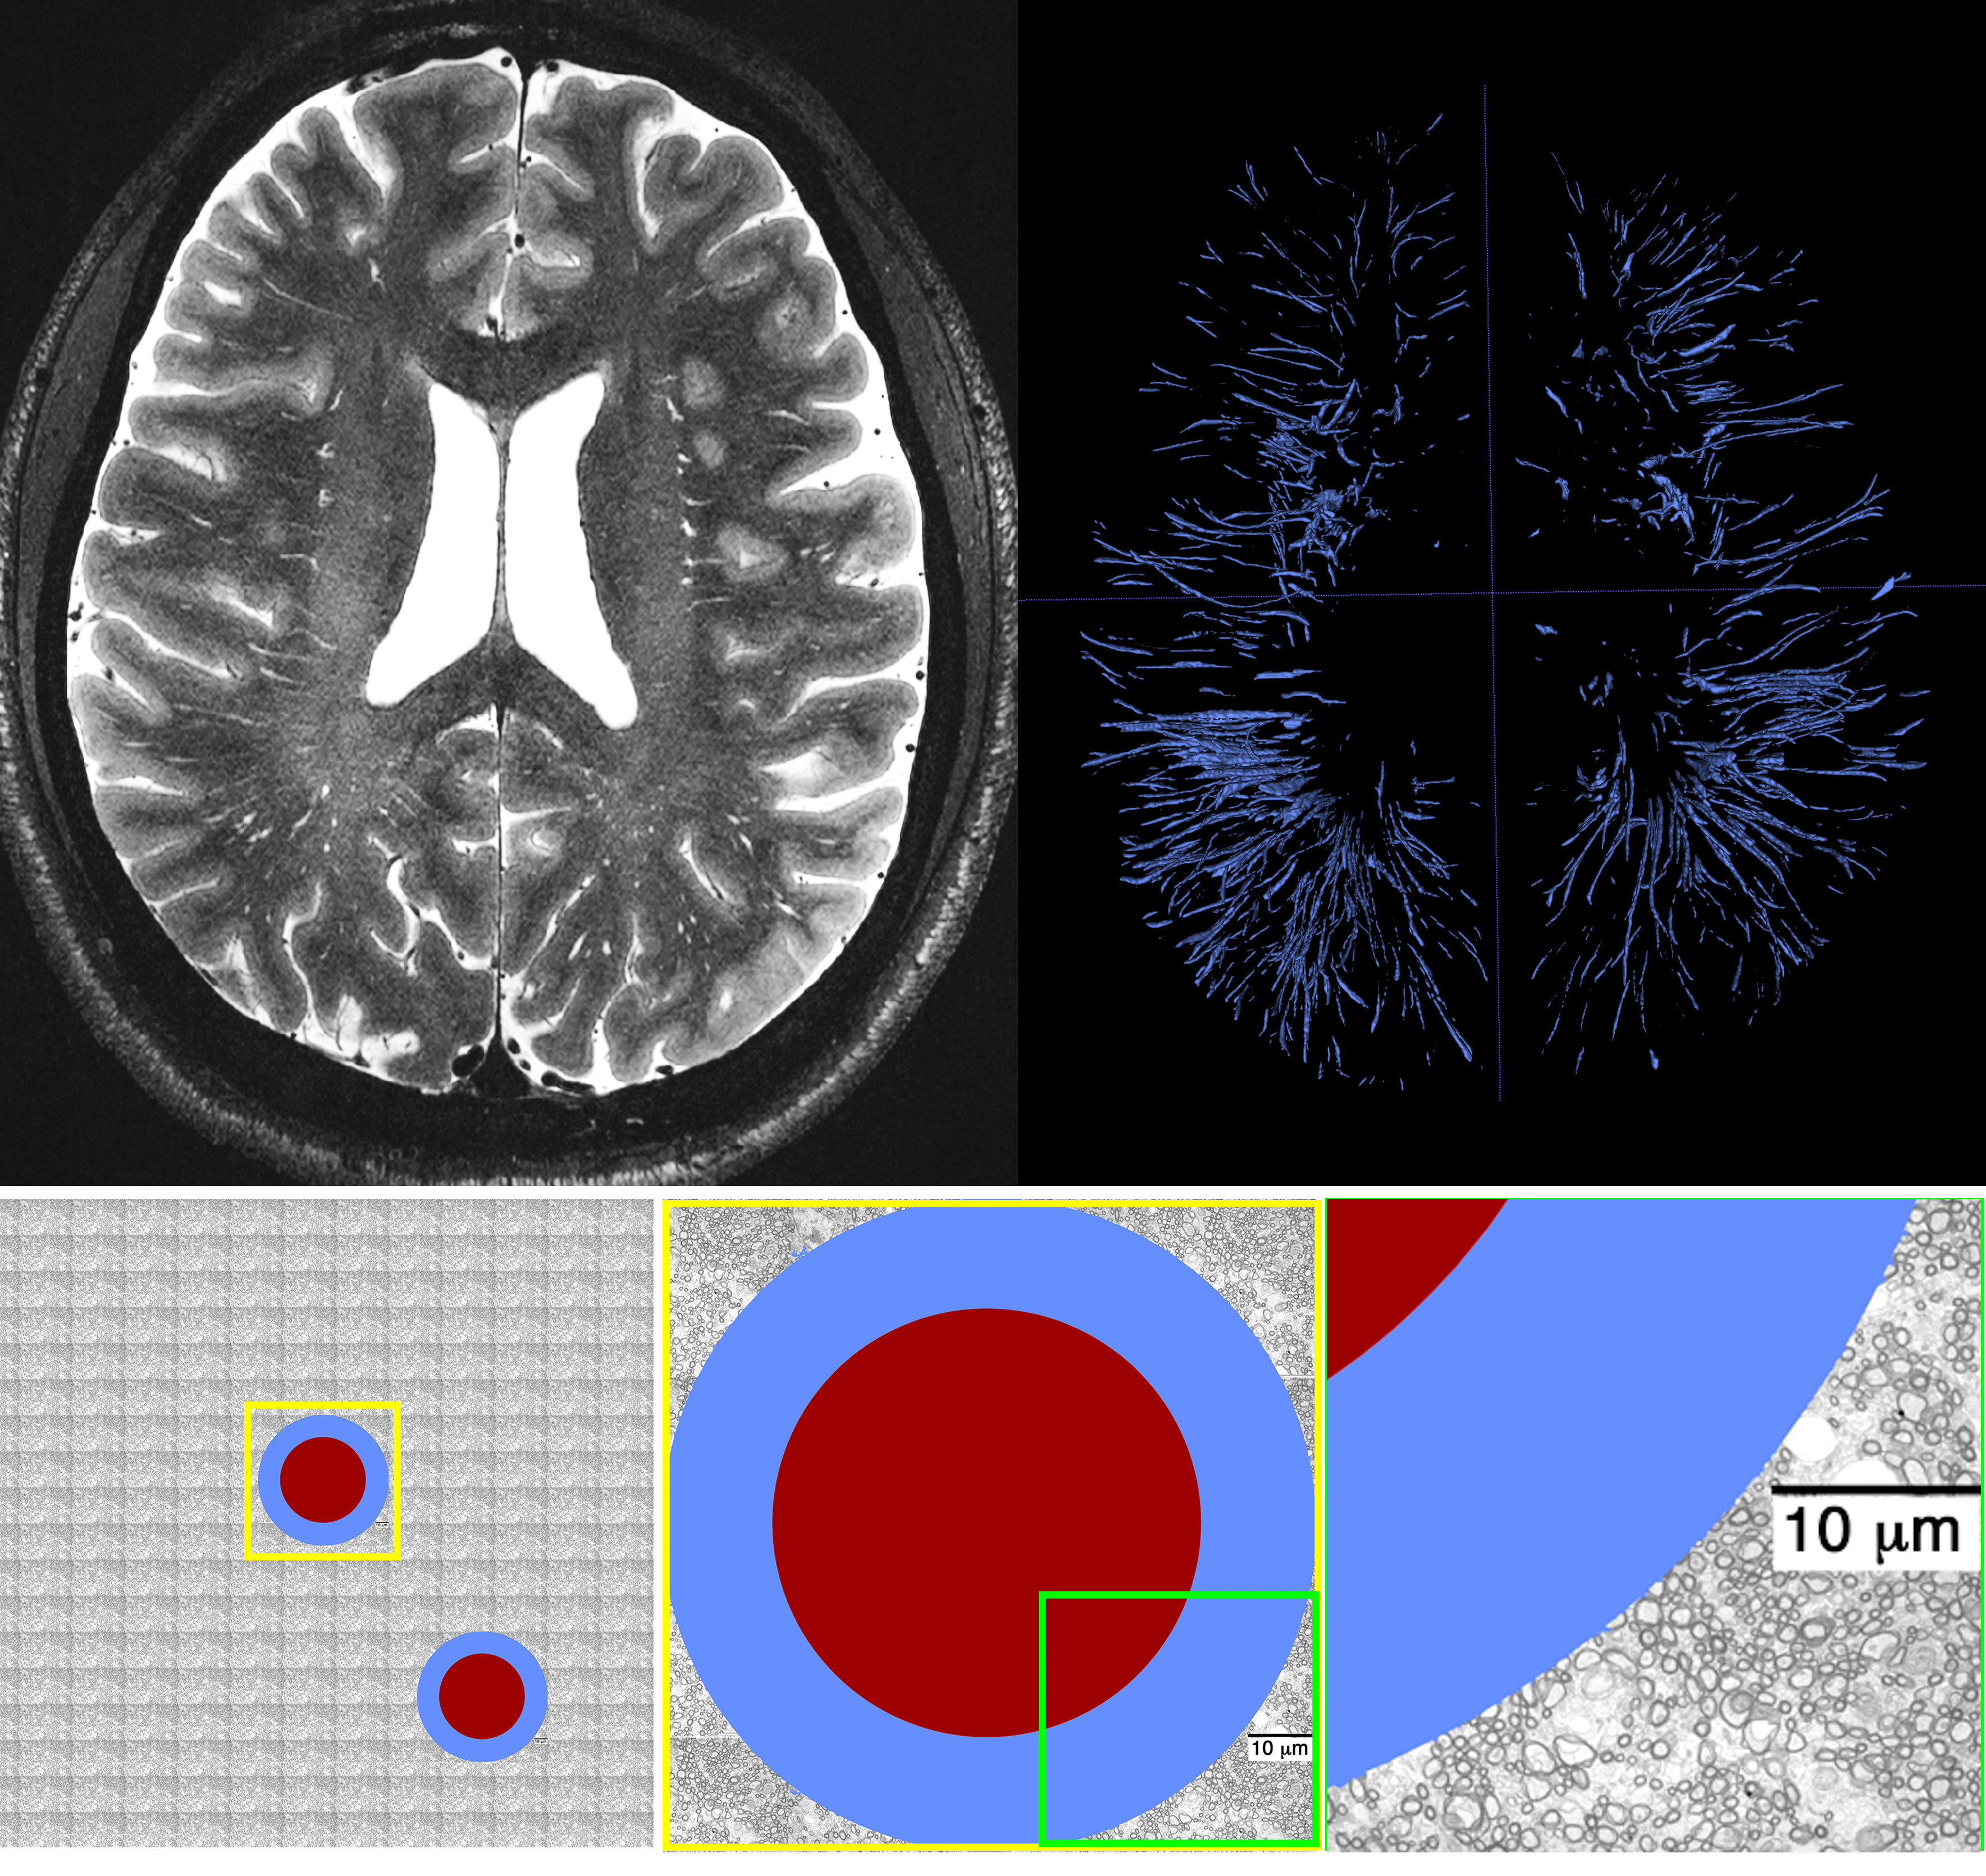
Figure 3. Top row: high resolution T2 SPACE image at 7T and manual segmentation results of PVS, highlighting the large presence of PVS across the brain. Second row: a schematic representation of a given conservatively drawn PVS is shown (high resolution images suggested that the PVS has a higher thickness compared to what is shown here). The PVS is presented aside electron microscopy images of white matter axons (as a rough reference).