0740
Whole-brain mapping of cortical architectonic features with high-resolution MAP-MRI1NICHD, National Institutes of Health, Bethesda, MD, United States, 2The Henry Jackson Foundation, Bethesda, MD, United States, 3NIMH, National Institutes of Health, Bethesda, MD, United States, 4NINDS, National Institutes of Health, Bethesda, MD, United States
Synopsis
We apply high-resolution mean apparent propagator (MAP)-MRI to quantify cortical architectonic features in a fixed rhesus macaque brain. Cortical depth profiles of MAP-derived parameters, such as the propagator anisotropy (PA), correlate well with histological stains in corresponding brain regions, and may be used to automatically detect boundaries between cortical areas with distinct cyto- and myeloarchitectonic organization. Mapping cortical architectonic features non-invasively could provide a new radiological tool for diagnosis of developmental and neurodegenerative disorders and improve our understanding of how the human brain is organized and connected.
INTRODUCTION
The laminar and columnar tissue microstructure revealed by histological analysis of the cortex1,2 forms the biological basis for defining cortical regions with different cyto- and myeloarchitecture specialized for functional processing. Given the limited number of human brain specimen and the lack of three-dimensional (3D) information in histological analysis, there is an urgent need for non-invasive alternatives that quantify microstructural features for cortical architectonic mapping.Diffusion MRI (dMRI), a non-invasive, 3D and quantitative clinical tool is uniquely sensitive to tissue microstructure. Recent studies3,4 suggest that high-resolution diffusion MRI can resolve cortical layers with different cyto- and myeloarchitecture5-7 and has the potential to automatically identify/classify areal differences8,9 throughout the cortex.
In this study, we apply high-resolution mean apparent propagator (MAP)-MRI10 to quantify features of the cyto- and myeloarchitecture throughout the entire cortex in a fixed rhesus macaque brain. We analyze areal differences between laminar profiles of MAP propagators in reference to a histologically defined brain atlas and investigate the potential of MAP-MRI for automatic cortical parcellation. The ability to map cortical architecture noninvasively could improve our understanding of the structure and function in healthy and pathological brains.
METHODS
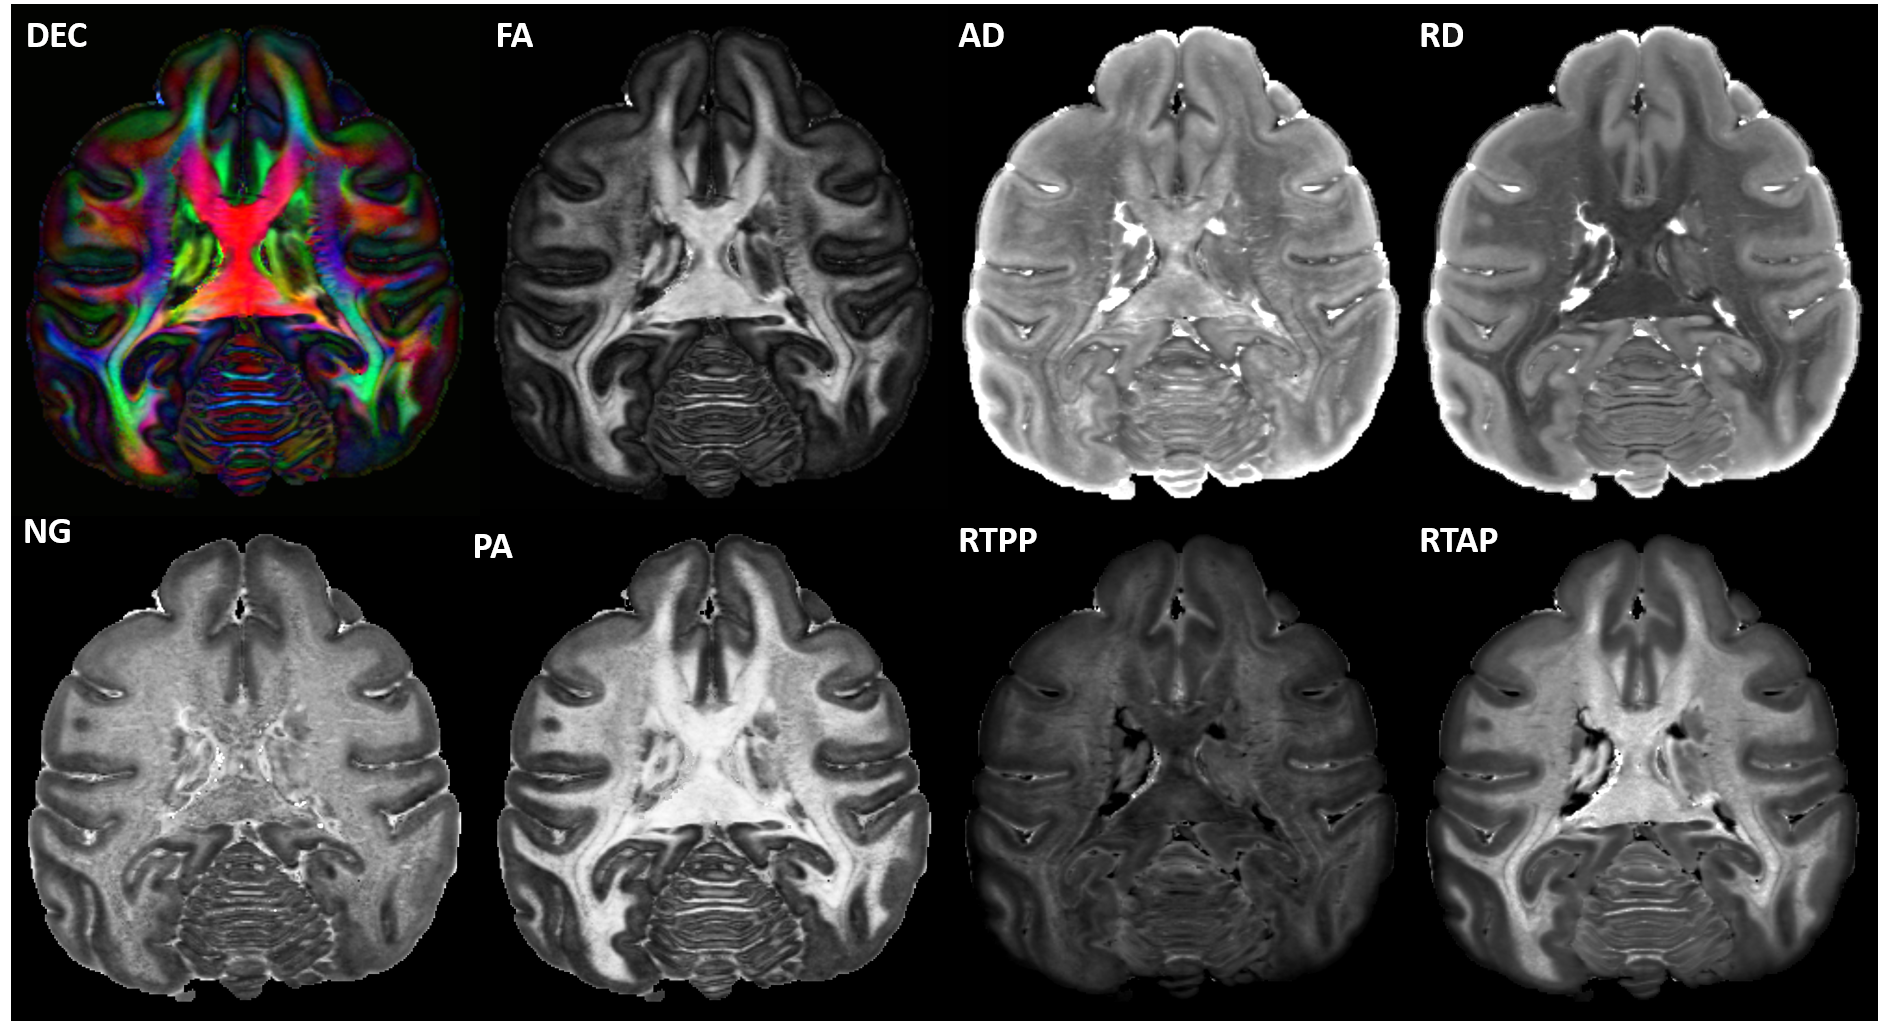
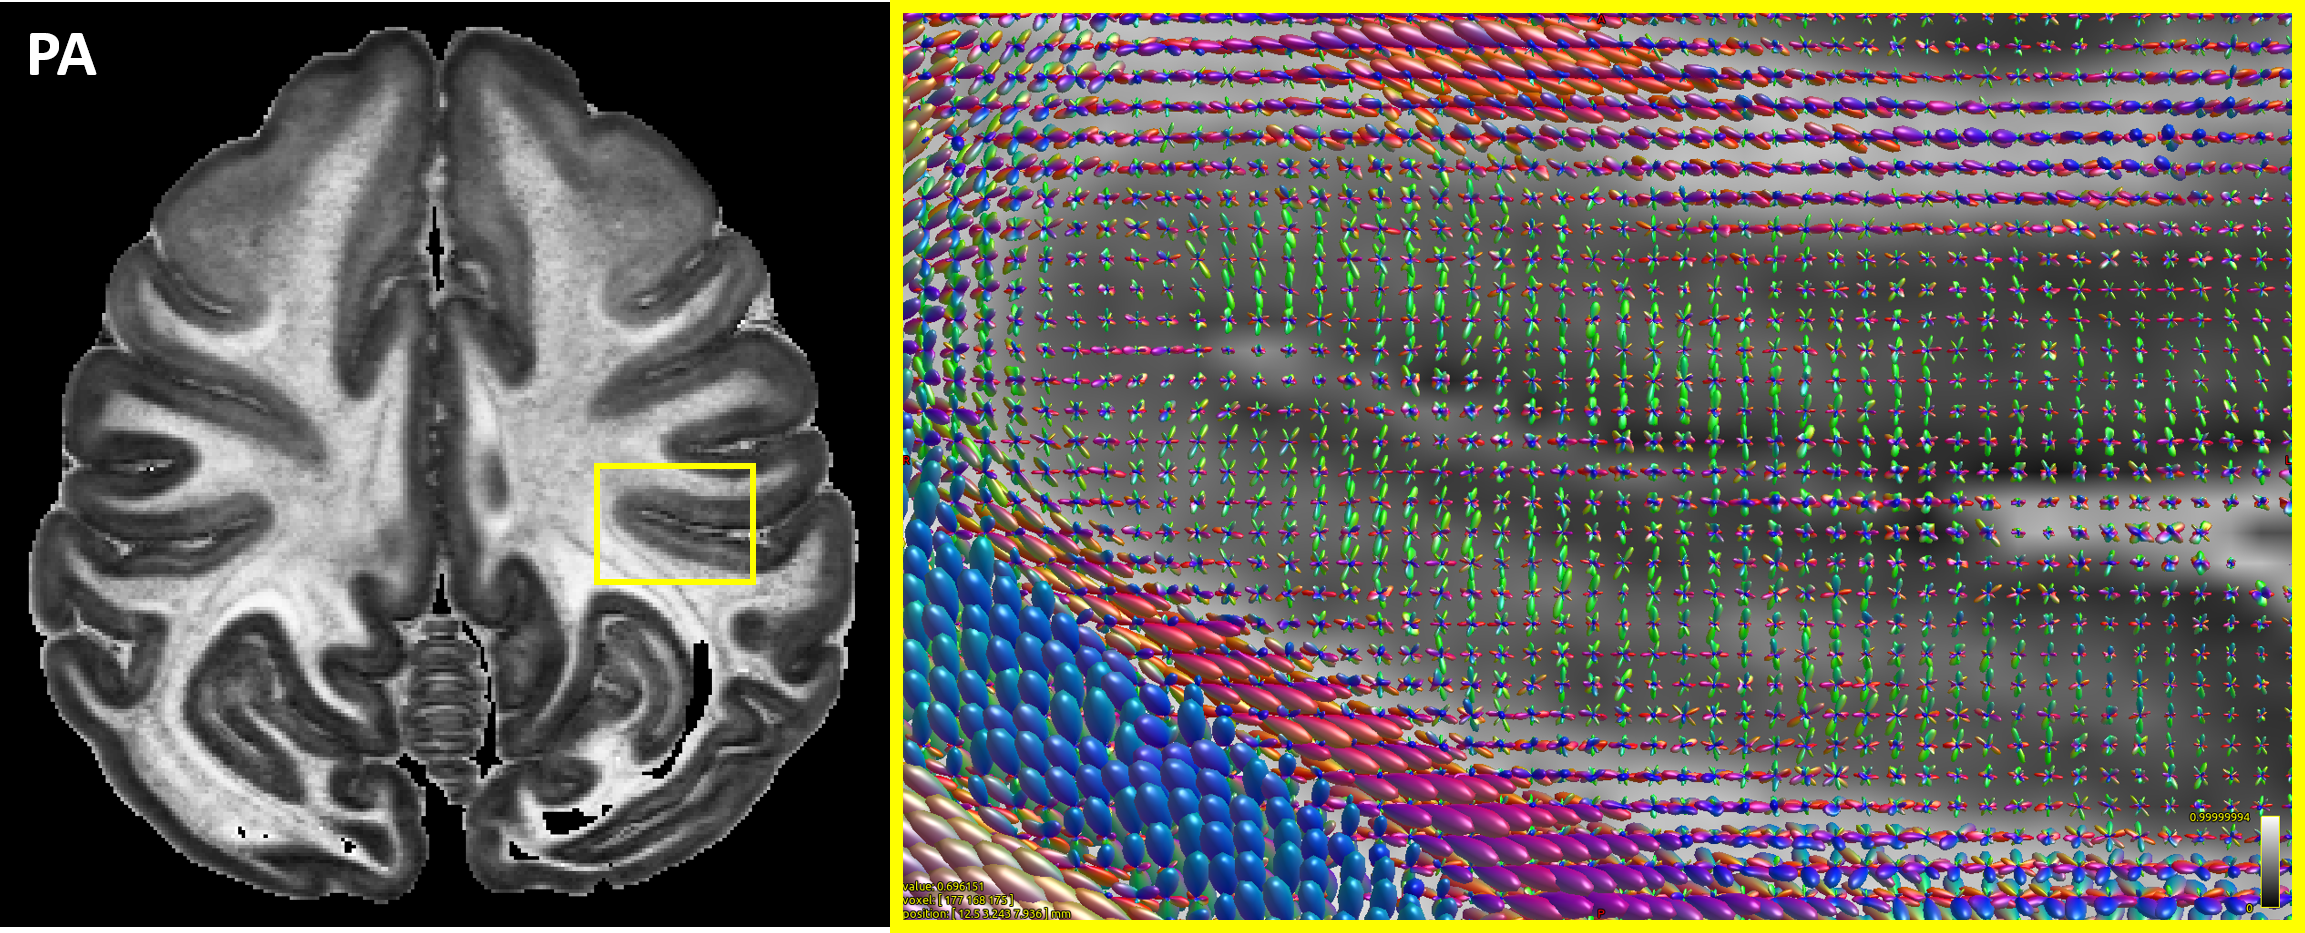
We scanned a perfusion-fixed macaque brain11 on a 7T scanner using MAP-MRI with an isotropic resolution of 250µm, FOV=78x64x72cm, TE/TR=33.3/250ms, 17 segments, 1.5 partial Fourier acceleration, and 2 averages. We acquired 101 diffusion-weighted images (DWIs) on multiple b-value shells (100,600,1500,2800,4800,7200,10000s/mm2) with multiple gradient orientations (3,4,8,12,18,24,32, respectively) uniformly sampling the unit sphere on each shell and across shells. The diffusion gradient pulse durations and separations were δ=8ms and Δ=16.1ms. We also conducted a magnetization transfer (MT) prepared gradient-echo experiment, performed gray (GM) and white matter (WM) tissue segmentation12, extracted the GM/WM and pial cortical surfaces13, and estimated intermediate surfaces corresponding to 6 cortical layers using the equivolumetric principle2,14. We registered15 the D99 digital macaque brain atlas16,17 to the eddy-current and EPI distortion corrected18 DWIs and the MT ratio (MTR) map to allow analysis in histologically-defined cortical regions.We estimated the mean diffusion propagators at each voxel using a MAP series truncation up to order 4, computed DTI parameters: fractional anisotropy (FA); mean, axial, and radial diffusivities – MD, AD, and RD, respectively; and MAP-MRI parameters, propagator anisotropy (PA), non-gaussianity (NG) return-to-origin probability (RTOP), return-to-axis probability (RTAP), and return-to-plane probability (RTPP), and derived fiber orientation distribution functions (fODFs)19. We measured cortical depth profiles by applying the same analysis to the DWIs interpolated at the vertices of all cortical surfaces. We quantified the statistics of cortical depth profiles (mean and standard deviation) across each histologically-defined region-of-interest (ROI) from the registered D99 atlas16. Finally, we applied simple k-means clustering to automatically classify the points on the cortical surface based on their laminar profiles of DTI/MAP parameters.
RESULTS
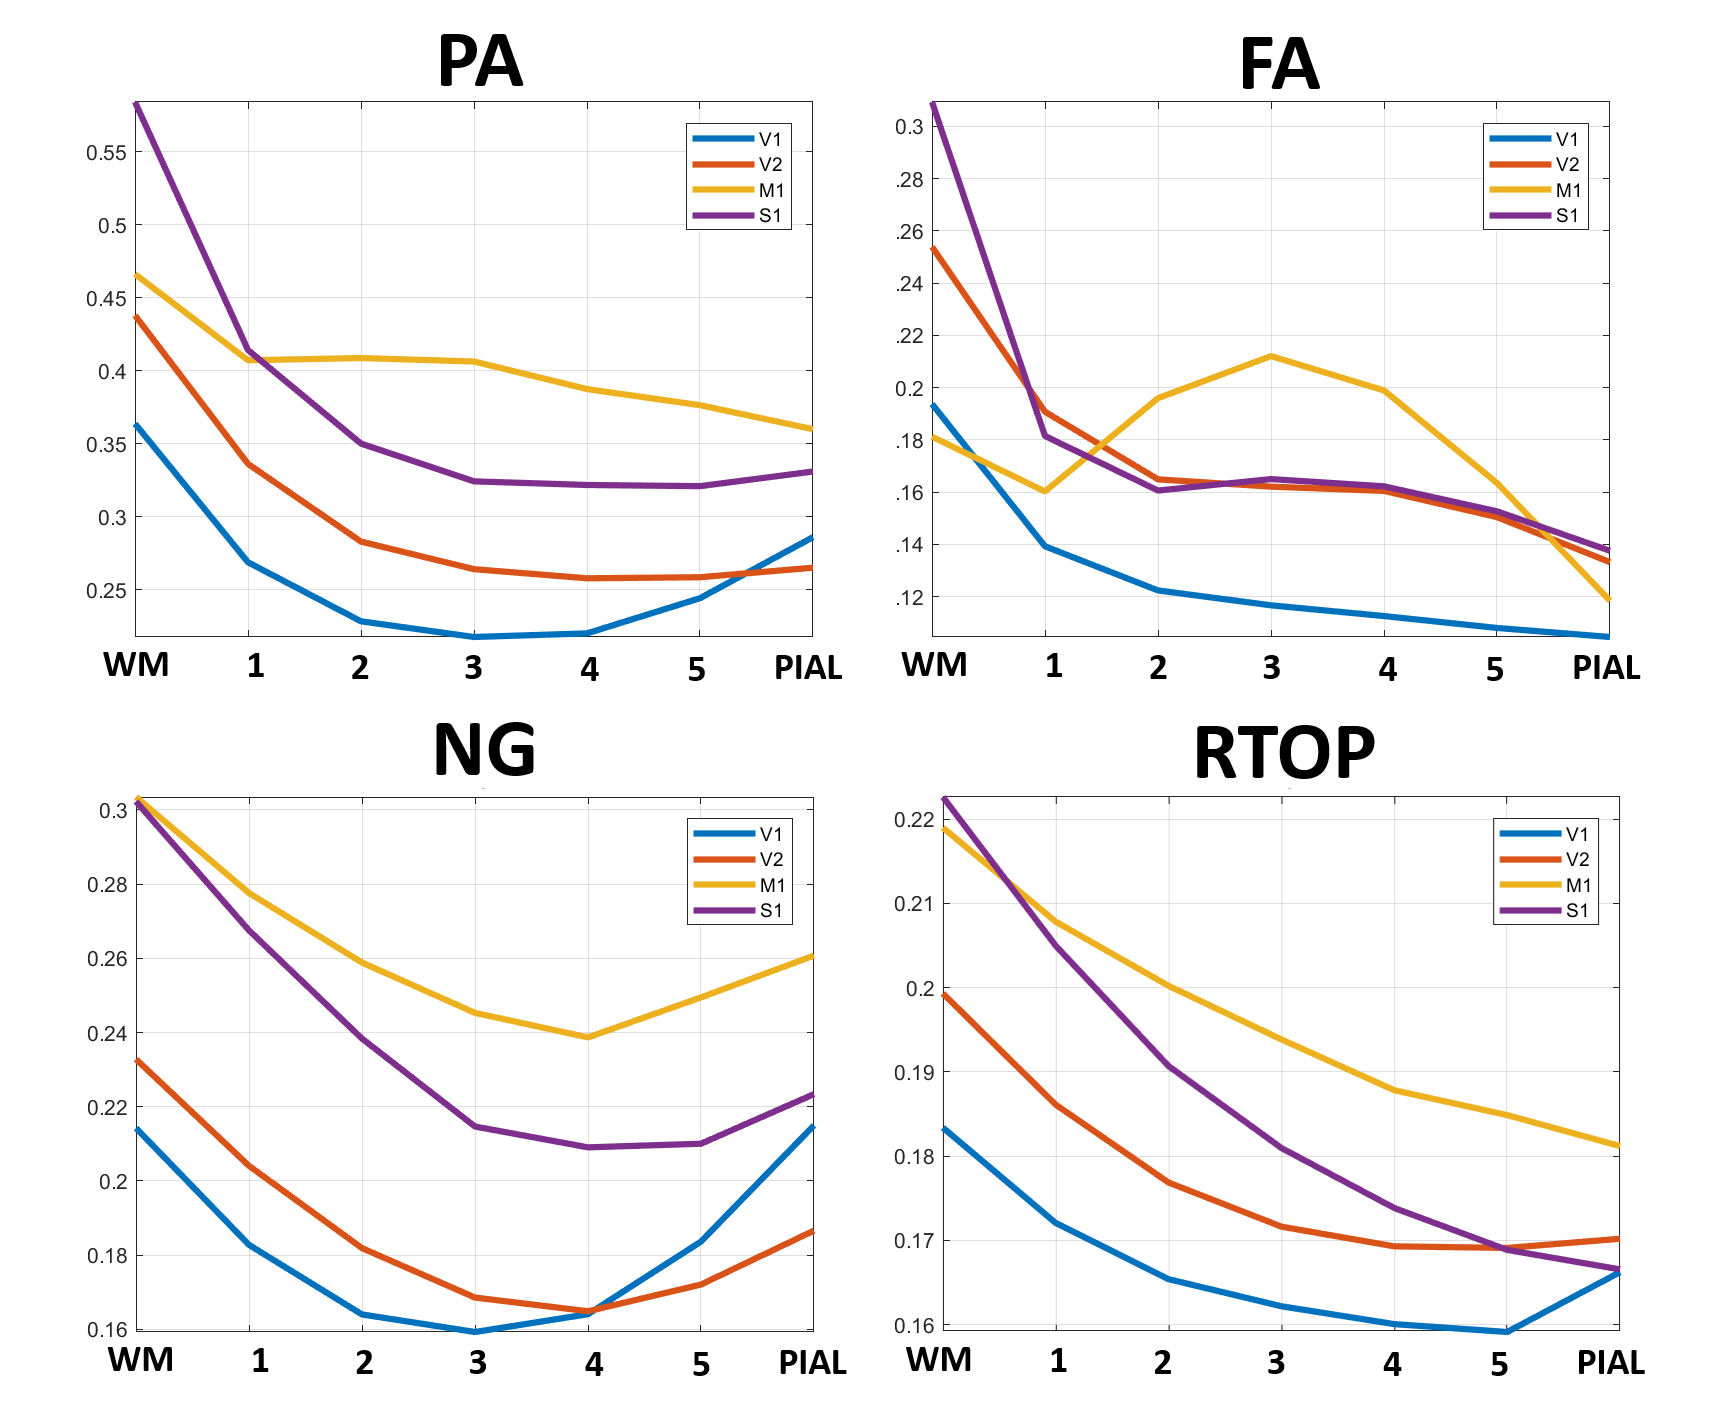
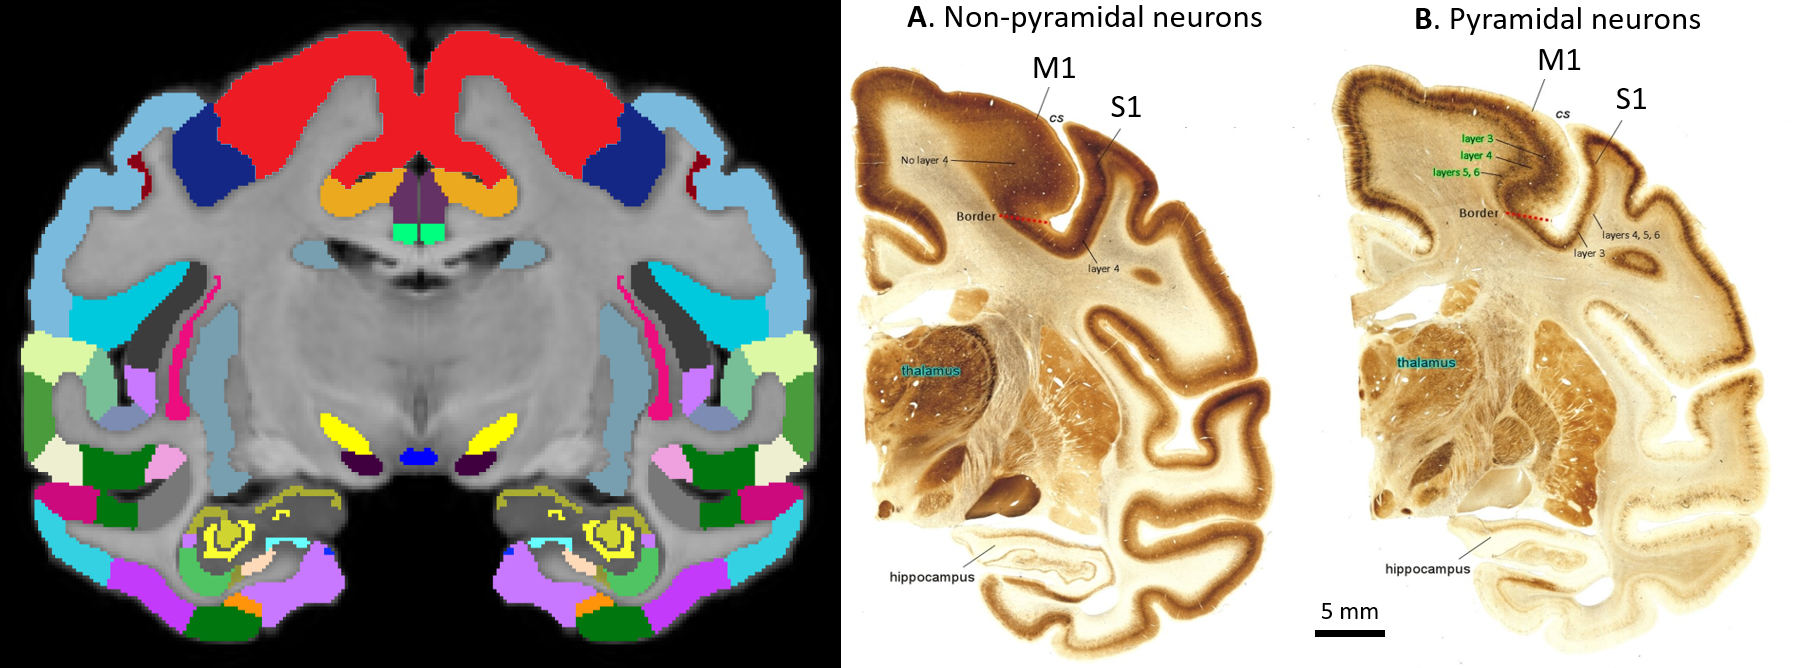
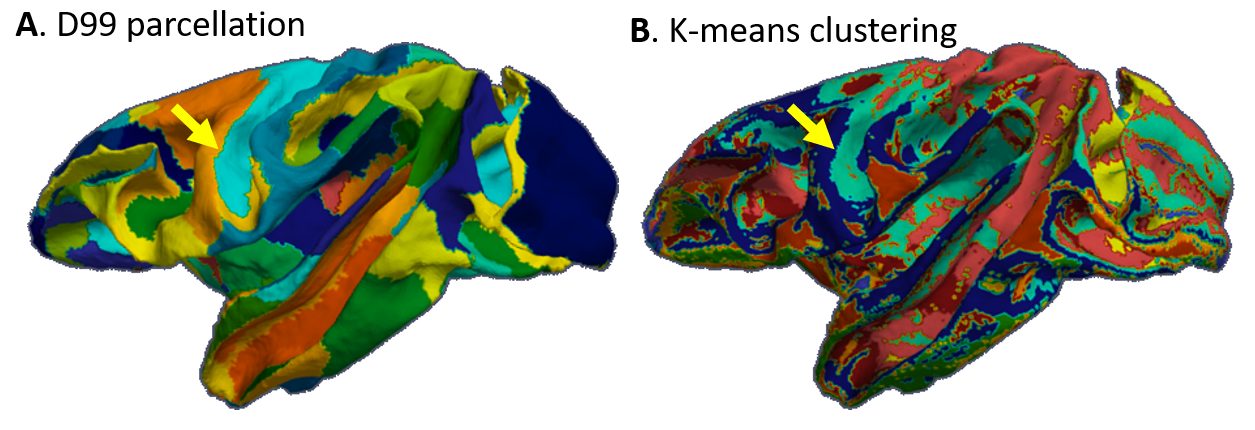
High-resolution MAP/DTI parameters showed good contrast and fine anatomical details throughout the brain including the cortical and subcortical regions (Fig. 1). Differences between cortical layers could be best visualized using anisotropy parameters, such as the PA and FA, as well as orientation information, such as the DEC map (Fig. 1) and orientation distribution functions (Fig. 2). Figure 3 shows the average cortical depth dependence of several MAP parameters in selected cortical areas: primary and secondary visual cortices (areas V1 and V2, respectively) and primary sensory-motor areas (S1 and M1, respectively). The PA and FA have very different profiles in these four regions (Fig. 3) which correlate with the cytoarchitectonic features shown in parvalbumin and SMI-32 stained histology sections (Fig. 4). Meanwhile, NG and RTOP showed some areal differences in cortical depth dependence, but to a lesser extent (Fig. 4). The decrease in RTPP and RTAP at more superficial layers correlated well with an increase in radial and tangential cortical diffusivities (Fig. 1) and may, to some extent, be attributed to re-hydration of the sample before the MR experiment. Simple k-means clustering analysis showed that distinct features of the MAP/DTI parameter depth profiles could be automatically classified into cortical regions that reflect histologically-defined parcellation (Fig. 5).DISCUSSION
Our results demonstrate that, at high spatial resolutions, dMRI in general, and MAP-MRI, in particular, can be sensitive to differences in cyto- and myelo-architectonic features in the cortex. In general, major challenges of analyzing areal architectonic differences using histological 2D sections are the variations in the relative thickness of the layers and in the relative angle between the cortical surface and the histological section (Fig. 4). Computing laminar profiles with respect to the local cortical geometry (Fig. 3) simplifies the statistical quantitation of microstructural parameters and the analysis of areal differences (Fig. 5).The specificity of dMRI to cortical cyto- and myelo-architecture could be further improved by using microstructural tissue models that take into account the local cortical reference frame. Ongoing studies in our lab aim at enhancing the automatic cortical parcellation by including additional MRI contrasts (e.g., T1W, or T2W), using spatial information in the k-means clustering analysis, and correlating imaging results with histological analysis obtained from the same brain.
Mapping cortical architectonic features with clinical MAP-MRI20 could provide a new neuroradiological tool for diagnosis of developmental and neurological disorders, and could improve our understanding of how the human brain is organized and connected.
Acknowledgements
This work was supported by the Intramural Research Program of the Eunice Kennedy Shriver National Institute of Child Health and Human Development, “Connectome 2.0: Developing the next generation human MRI scanner for bridging studies of the micro-, meso- and macro-connectome”, NIH BRAIN Initiative 1U01EB026996-01 and the CNRM Neuroradiology/Neuropathology Correlation/Integration Core, 309698-4.01-65310, (CNRM-89-9921). We thank Drs. Paul Taylor and Daniel Glen for helpful discussions and Dr. Bernard Dardzinski for providing the RF coil used in this experiment.References
1 Vogt, O. Die myeloarchitektonische Felderung des menschlichen Stirnhirns. J Psychol Neurol 15, 221-232 (1910).
2 Bok, S. T. Der Einflu\ der in den Furchen und Windungen auftretenden Krümmungen der Gro\hirnrinde auf die Rindenarchitektur. Zeitschrift für die gesamte Neurologie und Psychiatrie 121, 682-750, doi:10.1007/BF02864437 (1929).
3 Miller, K. L. et al. Diffusion imaging of whole, post-mortem human brains on a clinical MRI scanner. NeuroImage 57, 167-181, doi:10.1016/j.neuroimage.2011.03.070 (2011).
4 Assaf, Y. Imaging laminar structures in the gray matter with diffusion MRI. NeuroImage 197, 677-688, doi:https://doi.org/10.1016/j.neuroimage.2017.12.096 (2019).
5 Aggarwal, M., Nauen, D. W., Troncoso, J. C. & Mori, S. Probing region-specific microstructure of human cortical areas using high angular and spatial resolution diffusion MRI. NeuroImage 105, 198-207, doi:10.1016/j.neuroimage.2014.10.053 (2015).
6 Leuze, C. W. U. et al. Layer-Specific Intracortical Connectivity Revealed with Diffusion MRI. Cerebral Cortex 24, 328-339, doi:10.1093/cercor/bhs311 (2012).
7 Kleinnijenhuis, M. et al. Layer-specific diffusion weighted imaging in human primary visual cortex invitro. Cortex 49, 2569-2582, doi:10.1016/j.cortex.2012.11.015 (2013).
8 Bastiani, M. et al. Automatic segmentation of human cortical layer-complexes and architectural areas using Ex vivo diffusion MRI and its validation. Frontiers in Neuroscience 10, doi:10.3389/fnins.2016.00487 (2016).
9 Nagy, Z., Alexander, D. C., Thomas, D. L., Weiskopf, N. & Sereno, M. I. Using High Angular Resolution Diffusion Imaging Data to Discriminate Cortical Regions. PLoS ONE 8, doi:10.1371/journal.pone.0063842 (2013).
10 Özarslan, E. et al. Mean apparent propagator (MAP) MRI: a novel diffusion imaging method for mapping tissue microstructure. NeuroImage 78, 16-32 (2013).
11 D'Arceuil, H. E., Westmoreland, S. & de Crespigny, A. J. An approach to high resolution diffusion tensor imaging in fixed primate brain. NeuroImage 35, 553-565, doi:10.1016/j.neuroimage.2006.12.028 (2007).
12 Zhang, Y., Brady, M. & Smith, S. Segmentation of brain MR images through a hidden Markov random field model and the expectation-maximization algorithm. IEEE transactions on medical imaging 20, 45-57 (2001).
13 Fischl, B. FreeSurfer. NeuroImage 62, 774-781, doi:10.1016/j.neuroimage.2012.01.021 (2012).
14 Wagstyl, K. et al. Automated segmentation of cortical layers in BigBrain reveals divergent cortical and laminar thickness gradients in sensory and motor cortices. bioRxiv, 580597, doi:10.1101/580597 (2019).
15 Avants, B. B., Tustison, N. & Song, G. Advanced normalization tools (ANTS). Insight j 2, 1-35 (2009).
16 Reveley, C. et al. Three-dimensional digital template atlas of the macaque brain. Cerebral Cortex 27, 4463-4477 (2016).
17 Saleem, K. S. & Logothetis, N. K. A combined MRI and histology atlas of the rhesus monkey brain in stereotaxic coordinates. (Academic Press, 2012).
18 Pierpaoli, C. et al. in 18th Scientific Meeting of the International Society for Magnetic Resonance in Medicine. 1597.
19 Tournier, J. D., Calamante, F. & Connelly, A. MRtrix: diffusion tractography in crossing fiber regions. International journal of imaging systems and technology 22, 53-66 (2012).
20 Avram, A. V. et al. Clinical feasibility of using mean apparent propagator (MAP) MRI to characterize brain tissue microstructure. NeuroImage 127, 422-434 (2016).
Figures