0739
Single-shot isotropic diffusion-weighted NMR spectroscopy in the human brain at 7T using tetrahedral encoding
Chloé Najac1, Henrik Lundell2, Hermien E. Kan1, Andrew G. Webb1, and Itamar Ronen1
1C.J. Gorter Center for High Field MRI, Department of Radiology, Leiden University Medical Center, Leiden, Netherlands, 2Danish Research Centre for Magnetic Resonance, Copenhagen, Denmark
1C.J. Gorter Center for High Field MRI, Department of Radiology, Leiden University Medical Center, Leiden, Netherlands, 2Danish Research Centre for Magnetic Resonance, Copenhagen, Denmark
Synopsis
We propose a single-shot isotropic diffusion-weighted magnetic resonance spectroscopy (DW-MRS) sLASER-based sequence which enables single-shot measurement of metabolite apparent diffusion coefficient (ADC) at relatively short diffusion times and reasonable echo times in the human brain at 7T. Five brain metabolites and water ADC values were measured in two brain regions that differs significantly in white (WM) and grey matter (GM) content. Significantly higher ADCmetabolites and lower ADCwater were observed in WM compared to GM, illustrating microstructural tissue-specific differences.
Introduction
Diffusion-weighted magnetic resonance spectroscopy (DW-MRS) offers the unique ability to investigate cell- and compartment-specific microstructure. As opposed to water, brain metabolites are almost exclusively found in the intracellular space and are specific to cell-types (such as N-acetyl-aspartate (NAA) in neurons and Choline (Cho) in astrocytes)1,2. Previous reports demonstrated that the majority of the intracellular space consists of “neurites” (e.g. axons and astrocytic processes) in both grey matter (GM) and white matter (WM), across cell-types3,4, resulting in a very high intracellular micro-anisotropy. Past studies proposed different isotropic sequences to measure the trace of metabolites apparent diffusion coefficient (ADC) and trace of the diffusion tensor5-8. In this work, we propose an isotropic DW-MRS sequence based on the sLASER sequence that allows single-shot measurement of metabolite ADC at relatively short diffusion time (td) and reasonable echo times in the human brain. Following phantom validation, in vivo performance of the sequence was evaluated at 7T in two brain regions that differ significantly in their GM and WM content.Materials and methods
Single-shot tetrahedral-encoding sequence: A sLASER-based diffusion sequence containing 4 diffusion encodings that follow tetrahedral directions ([1,1,1], [1,-1,-1], [-1,1,-1], [-1,-1,1]) was implemented, as illustrated in Fig.1. For all measurements, a single gradient duration (δ=15.5ms), gap between diffusion gradient pairs (τ=10ms for a Δ=41ms) and TE=190ms were used. All experiments were conducted on a Philips 7T whole body MRI scanner (Philips Healthcare, The Netherlands) equipped with a volume transmit/32-channel receive head coil (Nova Medical, USA) and gradient coils with a maximal gradient strength of 40mT/m and a slew rate of 200T/m/s.Phantom data validation: In vitro sequence validation was performed on a GE-MR spectroscopy “Braino” phantom. DW water data (n=2, TR/TE=4000/190ms) were acquired using 4 different gradients strengths, resulting in 4 b values (223, 891, 2004 and 3563 s/mm2). After eddy currents correction, the water signal was integrated and ADC calculated (Fig.2).
In vivo acquisitions: Experiments were performed on 6 healthy volunteers (35±14y/o). A 3D-T1W gradient-echo acquisition (TR/TE=5/2ms, resolution 1x1x1mm) was used for planning of the measurements. An 8mL VOI was positioned either in parietal white matter (PWM, n=3, Fig.3A) or in the posterior cingulate cortex (PCC, n=4, Fig.3A). For PWM measurements, a dielectric pad was used to increase B1+ homogeneity and efficiency in the VOI9. DW-MRS data were acquired using the previously described sequence (TR/TE=5 cardiac cycles/190ms). Water and metabolite spectra were acquired using a gradient strength varying between 7 and 28mT/m, resulting in b values up to 3563s/mm2. Each condition was repeated 2x and 64x for water and metabolite acquisitions respectively. Individual spectra were corrected for eddy currents, phase and frequency variations using in-house Matlab routines. The water signal was integrated using Matlab, and NAA, total creatine (tCr), tCho, glutamate+glutamine (Glx) and myo-inositol (Ins) were quantified using LCModel10 for each b value. Anatomical images were segmented using FSL (Brain extraction Tool11) and an in-house Matlab routine was used to quantify the volume of WM, GM and CSF in the VOIs. Statistical significance was tested using an unpaired Student’s t-test with unequal variance (*p< 0.05, **p< 0.01, ***p< 0.001).
Results and discussion
As illustrated in Fig.2, using the single-shot isotropic DW-MRS sequence in the GE-MR “Braino” phantom, the logarithm of the water signal decreased linearly over our range of b values, resulting in the expected water ADC at room temperature (2.21±0.09μm2/ms). In vivo measurements in the human brain were performed in two regions that contain significantly different amount of WM and GM (Fig.3A/B). The PWM VOI contained mostly WM (81.2±1.0%), whereas the PCC VOI contained primarily GM (63.5±2.4%). Representative metabolite data are shown in Fig.4A, illustrating that signal could be detected for all metabolites of interest (NAA, tCr, tCho, Glx and Ins) up to b=3563s/mm2. CRLB values were <25% for all Ins measurements except for one PCC/PWM data point at the highest b value, and it was <25% for all Glx measurement except one PCC data point at highest b value and all highest b values in PWM. Over our range of b values, the logarithm of brain metabolites and water signal decreased linearly (Fig.4B). Quantification of ADC values showed higher water diffusivities in GM compared to WM while the metabolites’ diffusivities were lower in GM compared to WM for NAA, tCr and tCho (Fig.5). No significant difference between metabolites was observed. These results are in agreement with previous reports3,12. Metabolites ADC were however significantly higher than previously reported3,12, and this can be explained by our relatively short diffusion times (td~26ms)13.Conclusion
We have illustrated that a single-shot isotropic DW-MRS sequence using tetrahedral encoding can be used to measure the ADC of intracellular brain metabolites at 7T. Water ADCs are in good agreement with the literature3,12 supporting the hypothesis that the higher metabolites ADC values measured here is explained by the relatively short diffusion times. Conventional metabolites ADC measurement using two b values and three diffusion gradient directions result in acquisition times ~10min. Here, measurement could be performed in ~6min which is more suitable for patient studies. The results of isotropic diffusion will in the future be compared to measurement using double-diffusion encoding and powder-averaged diffusion measurements to gain more insight into microscopic anisotropy in the brain14-18.Acknowledgements
This project has received funding from the European Research Council (ERC) under the European Union’s Horizon 2020 research and innovation programme (grant agreement No 804746). The authors would also like to thank Drs. D. Deelchand and P.G. Henry from Center of Magnetic Resonance Research at University of Minnesota (USA) and Dr. Julien Valette at Atomic Energy and Alternative Energies Commission in Paris (France) for sharing their Matlab programs to create LCModel basis-sets.References
[1] Urenjak et al., J. Neurosci. 1993; [2] Choi et al., NMR Biomed. 2007; [3] Najac et al., Brain Struct. Funct. 2016; [4] Palombo et al., PNAS 2016; [5] Valette et al., MRM 2012; [6] de Graaf et al., MRM 2001; [7] Wong et al., MRM 1995; [8] Mori et al., MRM 1995; [9] O’Reilly et al., J. Magn. Res. 2016; [10] Provencher et al., MRM 1993; [11] Smith, Hum. Brain Mapp 2002; [12] Kan H.E. et al., MRM 2011; [13] Marchadour et al., J. Cereb. Blood Flow Metab. 2012; [14] Ianus et al., NeuroImage 2018; [15] Lawrenz et al., MRM 2018; [16] Lundell et al., ISMRM 2018; [17] Shemesh et al., MRM 2016; [18] Lasič et al., Front. Phys. 2014Figures
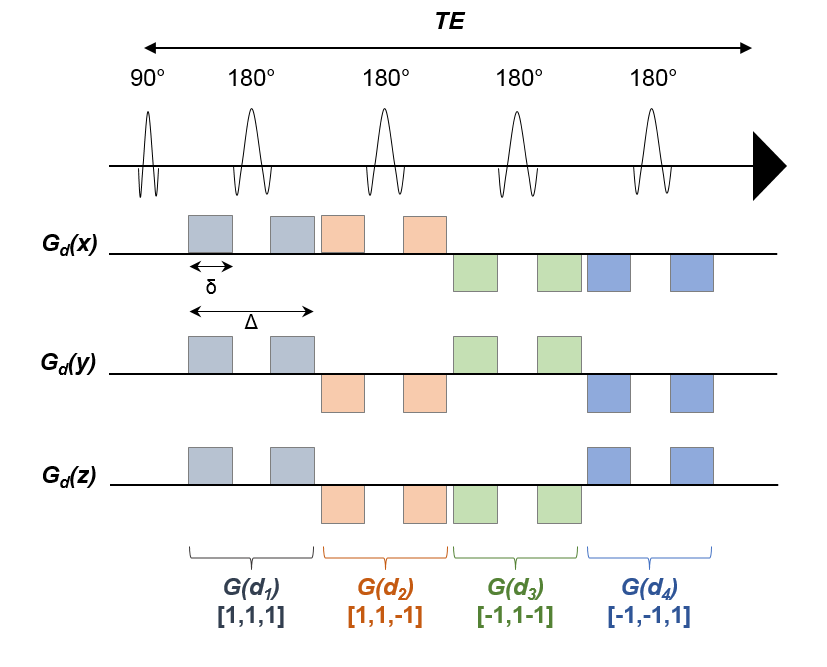
Figure 1: Illustration of the sLASER-based isotropic diffusion sequence containing
4 diffusion encodings that follow tetrahedral directions ([1,1,1], [1,-1,-1],
[-1,1,-1], [-1,-1,1]).
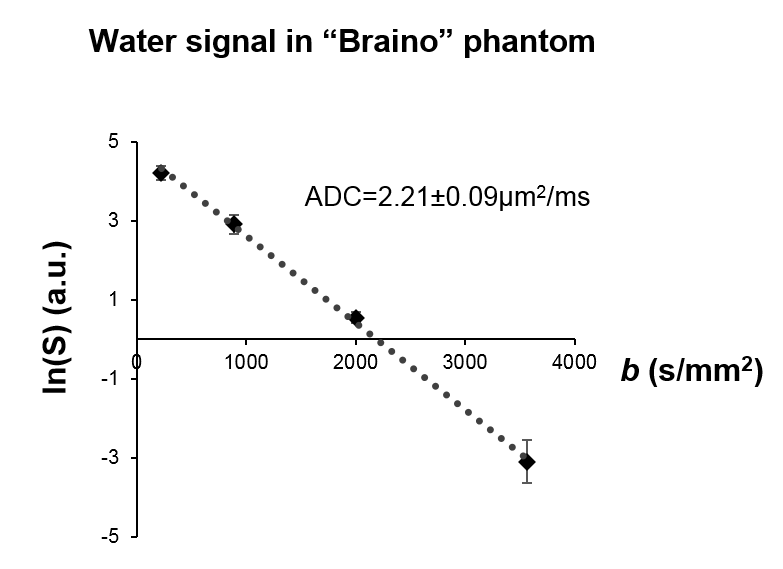
Figure 2: Validation in GE-MR “Braino” phantom.
The logarithm of the water signal as a function of b and linear fit are represented.
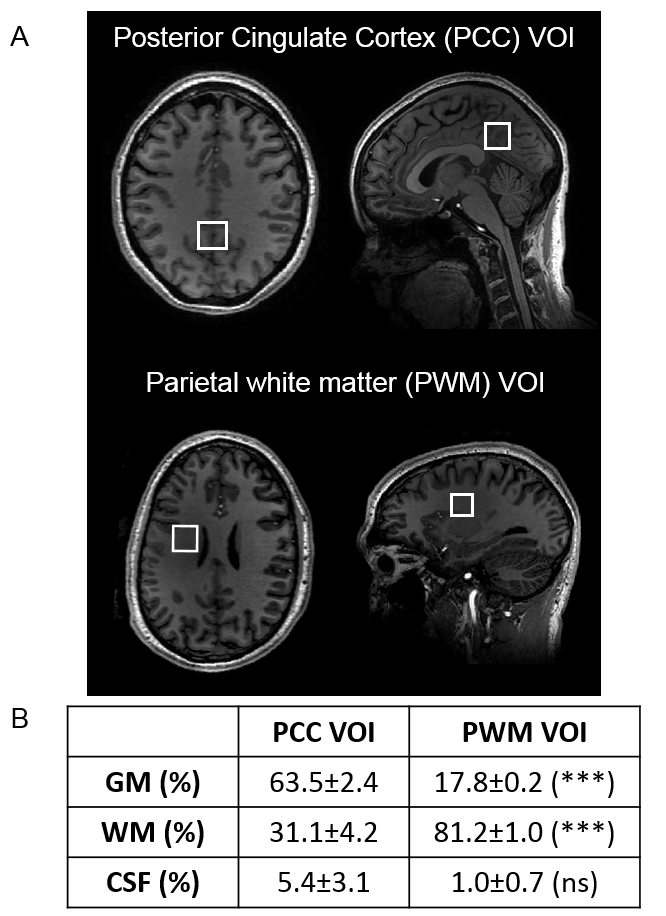
Figure 3: (A) VOI positioning on anatomical 3D-T1W images in parietal white matter (PWM) and posterior cingulate cortex (PCC) regions. (B)
Corresponding quantification of GM/WM/CSF. Unpaired Student’s t-test was used
to estimate differences between VOIs (*p< 0.05,
**p< 0.01,
***p< 0.001).
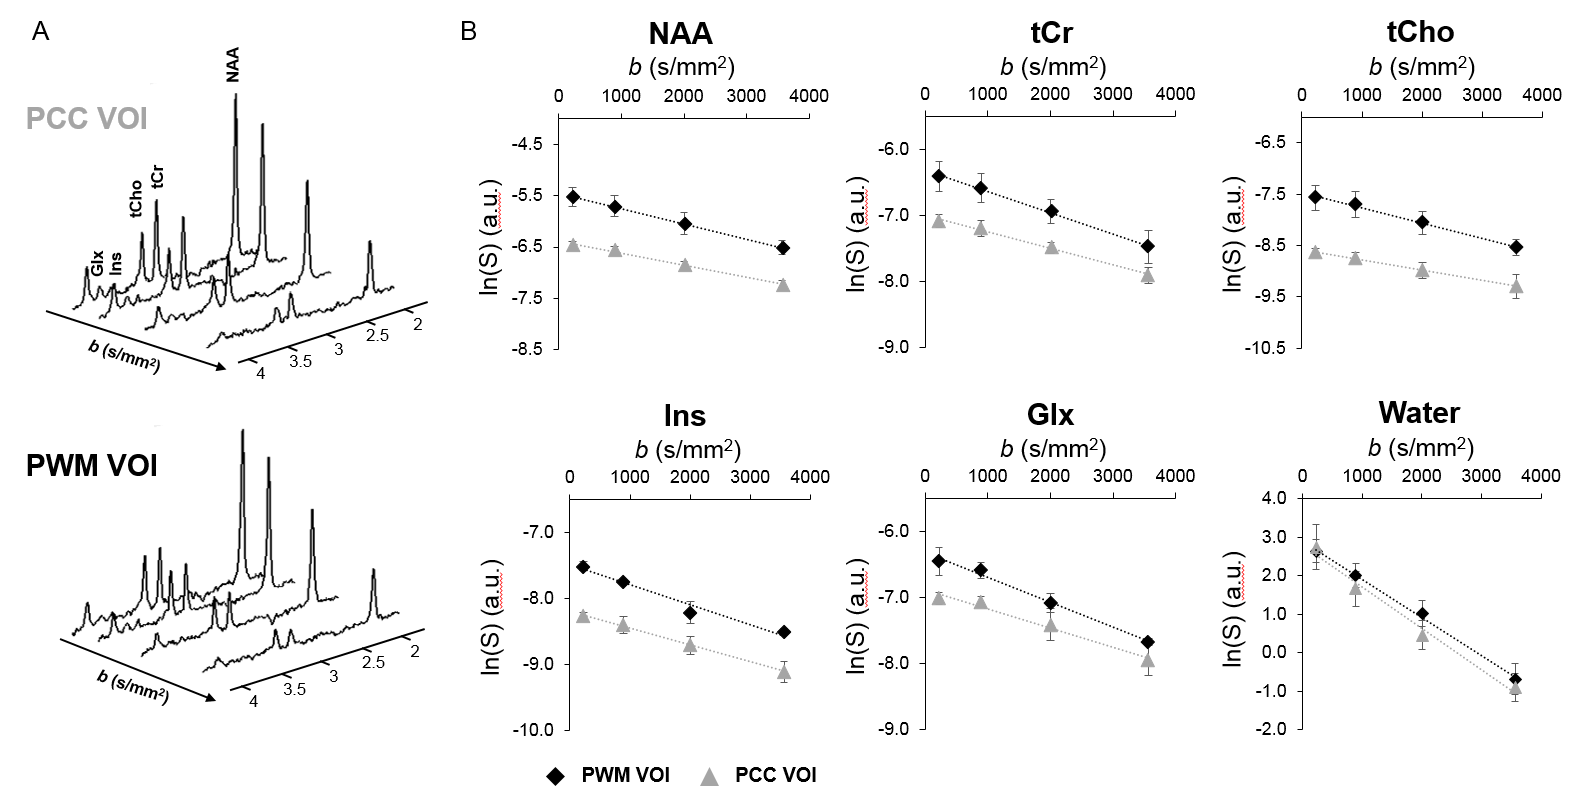
Figure 4: (A) Illustration of individual metabolites’ spectra over different b values in both PWM and PCC regions. (B) The logarithm of the signal for both
water and brain metabolites was quantified for each b values and fitted with a linear regression. The data (triangle for PCC and diamond for PWM) and fits (dotted lines) for the mean over all participants are
illustrated for both regions (grey for PCC and black for PWM). The error bars
represent the standard deviation over subjects.
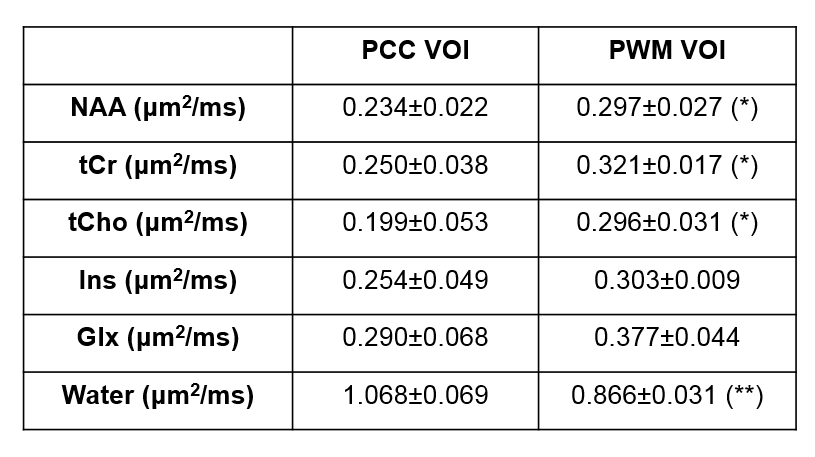
Figure 5: Results from metabolites and water data fits are
reported (mean±s.d.). Statistical significance was evaluated using an unpaired
Student’s t-test (*p< 0.05, **p< 0.01,
***p< 0.001). Significant differences observed between PWM and PCC
for NAA, tCr and tCho.