0738
Comparison of microstructural models of Sodium and Diffusion Basis Spectrum Images
Simona Schiavi1,2, Lazar Fleysher3, Peng Sun4, Nicole Graziano1, Arielle Falcone1, Yongxian Qian5, Fernando E. Boada5, Sheng-Kwei Song4,6,7, and Matilde Inglese1,2,3
1Department of Neurology, Icahn School of Medicine at Mount Sinai, New York, NY, United States, 2DINOGMI, University of Genoa/IRCCS AOU San Martino-IST, Genoa, Italy, 3Department of Radiology, Icahn School of Medicine at Mount Sinai, New York, NY, United States, 4Biomedical MR Laboratory, Department of Radiology, Washington University School of Medicine, St. Louis, MO, United States, 5Department of Radiology, NYU Langone Medical Center, New York, NY, United States, 6Hope Center for Neurological Disorders, Washington University School of Medicine, St. Louis, MO, United States, 7Biomedical Engineering, Washington University, St. Louis, MO, United States
1Department of Neurology, Icahn School of Medicine at Mount Sinai, New York, NY, United States, 2DINOGMI, University of Genoa/IRCCS AOU San Martino-IST, Genoa, Italy, 3Department of Radiology, Icahn School of Medicine at Mount Sinai, New York, NY, United States, 4Biomedical MR Laboratory, Department of Radiology, Washington University School of Medicine, St. Louis, MO, United States, 5Department of Radiology, NYU Langone Medical Center, New York, NY, United States, 6Hope Center for Neurological Disorders, Washington University School of Medicine, St. Louis, MO, United States, 7Biomedical Engineering, Washington University, St. Louis, MO, United States
Synopsis
Both diffusion weighted MRI and Sodium MRI are imaging techniques sensitive to tissue microstructure. The two methods provide complementary information and use tissue models to interpret observed signals to obtain tissue-specific parameters. We investigated the relationship between several tissue-parameters of the two models in the white matter and in the Corpus Callosum. Our results suggests that, the measured cell volume fraction of sodium agrees with diffusion basis spectrum images features. This opens to the possibility of using sodium MRI to investigate pathological tissues and recover complementary information to those we can retrieve with diffusion MRI.
Introduction
Both diffusion weighted MRI and Sodium (Na) MRI are imaging techniques sensitive to tissue microstructure. The two methods provide complementary information and interpret observed signals to obtain tissue-specific parameters based on specific tissue models 1,2. While, diffusion basis spectrum imaging (DBSI) has been validated against post-mortem tissues in both animal models and humans3,4, intracellular-sodium imaging is a more challenging area that post-mortem tissues have limitations. In this work, we investigated the relationship between several tissue-parameters of the two models.Methods
10 healthy volunteers underwent sequential MRI examinations on a Siemens Magnetom Prisma 3T with 64CH hydrogen and 8CH dual-tuned 1H-23Na head coils. Sodium images were acquired with a TPI sequence 5 at a 3D isotropic resolution of $$$3.5x3.5x3.5mm^3$$$. DBSI were acquired with resolution $$$2x2x2mm^3$$$ and 99-directions diffusion weighting scheme with maximum b-value$$$=2000s/mm^2$$$ as prescribed in reference 3. A 3D MPRAGE was also acquired with the 64- and 8-channel array and was used for co-registrations and tissue segmentation.A two-compartment model2 was used to analyse sodium images and derive microstructural parameters of tissue sodium concentration (TSC) and intracellular sodium volume fraction (ISVF). After correction for motion and distortions, the following DBSI microstructural parameters4 were computed: fibers fraction (apparent axonal density), hindered fraction (reflecting water in the extracellular space), restricted fraction (reflecting water inside cellular compartments), water fraction (reflecting free diffusion), fiber axial diffusivity (AD reflecting diffusivity along intact fibers), fiber radial diffusivity (RD reflecting myelination) and fractional anisotropy (FA reflecting fibers integrity).
Regions of Interest (ROI) analysis was performed to investigate microstructural similarities in the total WM segmented from the T1 images and in the Corpus Callosum (CC) selected from the ICBM-DTI-81 atlas6. Both DBSI and Sodium microstructural maps were co-registered to T1 images to have a more precise anatomical correspondence with the chosen ROIs. For all subjects, mean values of all parameters were extracted inside the ROIs and then compared using Pearson’s (R) and Spearman’s (rho) correlation coefficients.
Results and Discussion
As reported in Table 1 and Figure 1, in the global WM, we obtained statistically significant correlations between FA and TSC (R=-0.921, p<0.001; rho=-0.903, p<0.001); RD and TSC (R=0.713, p=0.021; rho=0.527, p=0.117); FA and ISVF (R=0.786, p=0.007; rho= 0.818, p=0.004). The negative correlation between TSC and FA indicates that while TSC increase we have an increase of the extracellular space which causes a reduction in anisotropy expansion of extracellular space, i.e. molecules can travel perpendicular to the tubes that represents the axons. The positive correlation between TSC and RD indicates that the increase of the extracellular space can be associated to an increase in the diameter of the channels between axons which results in an increase of RD. Finally, the positive correlation between ISVF and FA indicates that while cell volume increase the fibers are more tightly packed (i.e. we have less water between axons, but water can still travel along axons) which translates in an increase of FA because water channels become narrow and long.In Table 2 and Figure 2 are reported the results for the CC. We obtained statistically significant correlations between fiber fraction and ISVF (R=0.723, p=0.018; rho=0.636, p=0.048); hindered fraction and TSC (R=0.808, p=0.005; rho=0.709, p=0.022); restricted fraction and ISVF (R=0.219, p=0.519; rho=-0.673, p=0.033). The positive correlation between ISVF and fiber fraction indicates an agreement between the two modalities (the more intact fibers are present in a voxel, the larger the intracellular volume fraction). The positive correlation between TSC and hindered fraction confirms that TSC increases when water accumulates within the fiber bundles.
Conclusions
For the first time we investigated the relationship between Na MRI microstructural parameters and DBSI microstructural parameters in healthy volunteers. Our statistically significant correlations suggests that, the measured cell volume fraction of Na agrees with DBSI features. This opens to the possibility of using Na MRI to investigate pathological tissues and recover complementary information to those we can retrieve with diffusion MRI.Acknowledgements
This study was supported in part by NS099527.References
- D.S. Novikov, V.G. Kiselev, S.N. Jespersen. On modelling. Magnetic Resonance in Medicine. 2018, 79(6):3172-3193.
- L. Fleysher, N. Oesingmann, R. Brown, D. K. Sodickson, G. C. Wiggins, M. Inglese. Noninvasive quantification of intracellular sodium in human brain using ultrahigh–field MRI. NMR in Biomedicine 2013 26:9-19
- Y. Wang, Q. Wang, J.P. Haldar, et al. Quantification of increased cellularity during inflammatory demyelination. Brain. 2011;134(12):3587-3598.
- Y. Wang, P. Sun, Q. Wang, et al. Differentiation and quantification of inflammation, demyelination and axon injury or loss in multiple sclerosis. Brain. 2015;138(5):1223-1238
- Y. Qian, V.A. Stenger, F. E.Boada. Parallel imaging with 3D TPI trajectory: SNR and acceleration benefits. Magnetic Resonance Imaging, 2009 27(5):656-663
- Mori S, Wakana S, van Zijl Peter CM N-PLM. MRI Atlas of Human White Matter 1st Edition.; 2005.
Figures
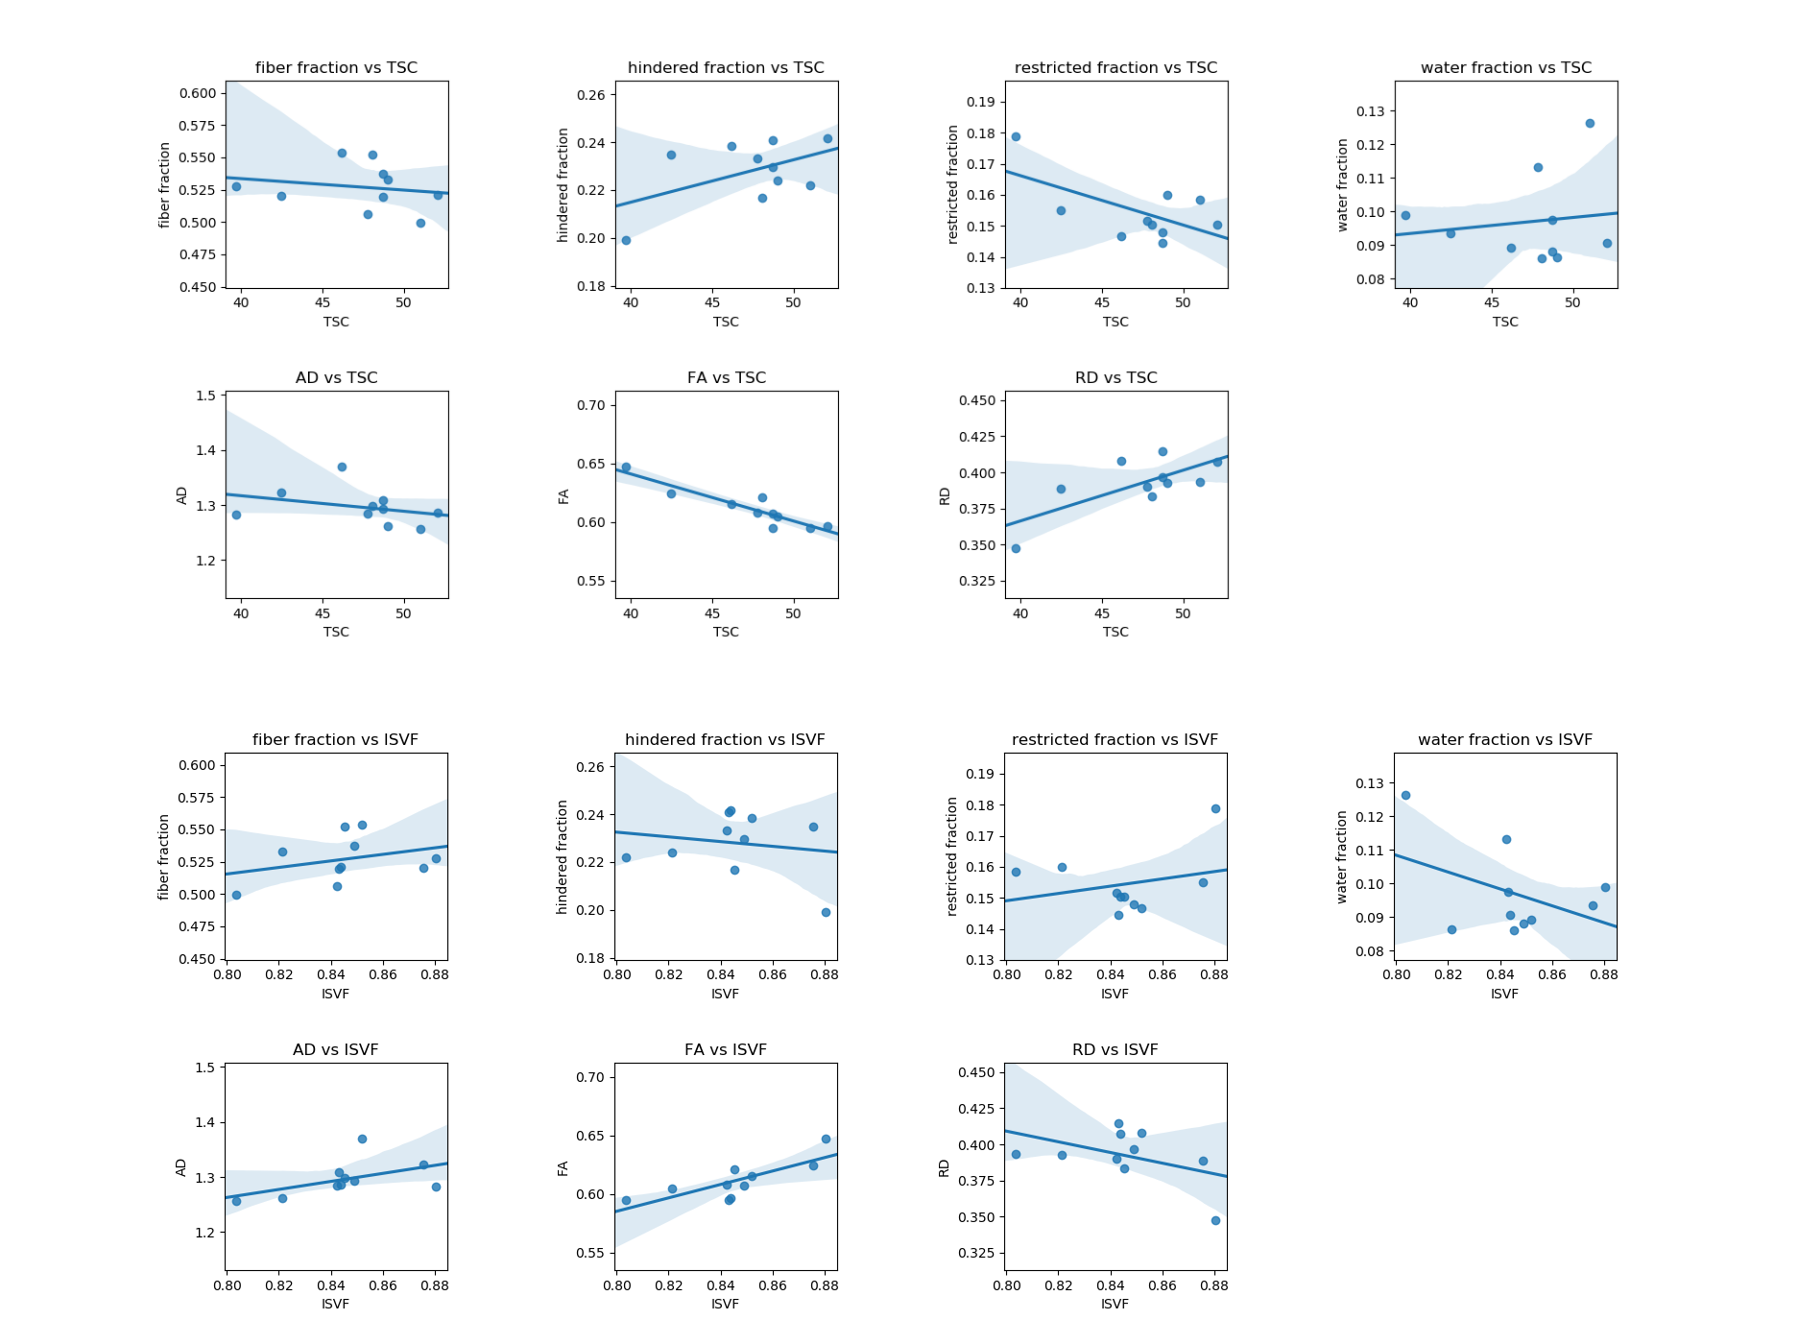
Figure 1: Scatter plots between mean values in the white matter of Sodium and DBSI metrics for the 10 healthy subjects included in our analysis. Each point correspond to one subject. Regression line with its shadowed 95% interval of confidence is drawn on each plot.
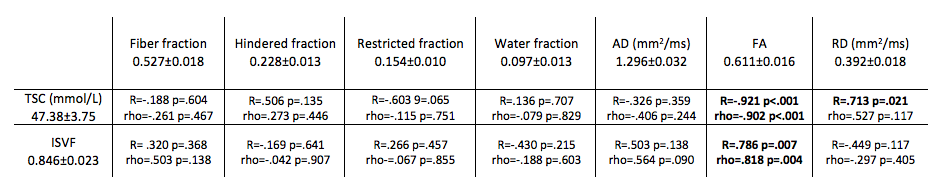
Table 1 summarising the comparisons between mean values of sodium and DBSI microstructural parameters for the 10 subjects in the white matter. Pearson’s (R) and Spearman’s (rho) correlation coefficients with relative p-values are reported in each column. Statistically significant results are highlighted in bold.
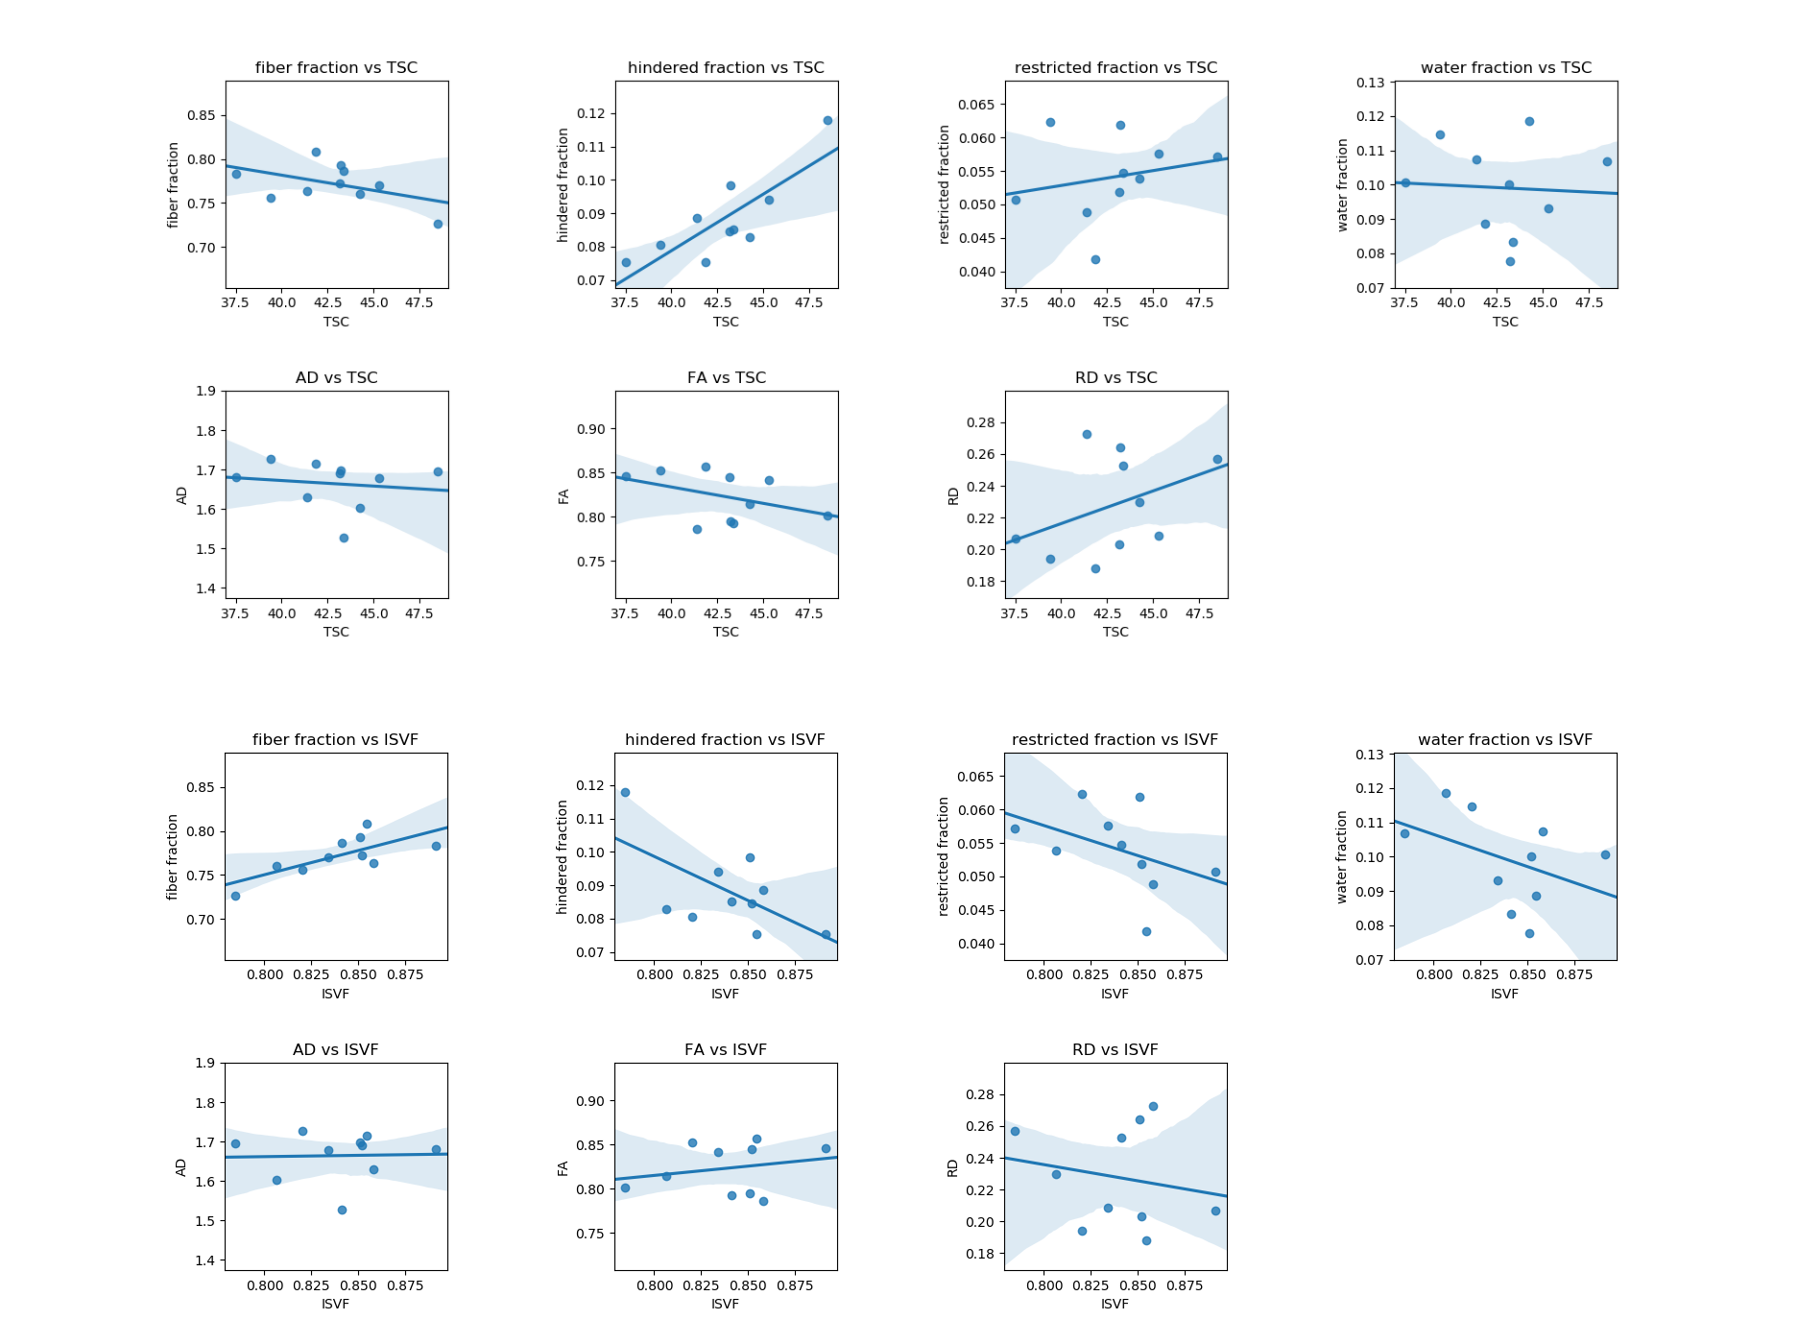
Figure 2: Scatter plots between mean values in the corpus callosum of Sodium and DBSI metrics for the 10 healthy subjects included in our analysis. Each point correspond to one subject. Regression line with its shadowed 95% interval of confidence is drawn on each plot.
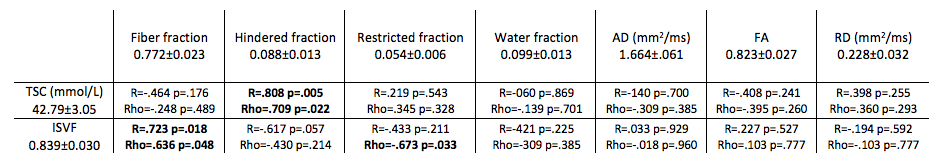
Table 2 summarising the comparisons between mean values of sodium and DBSI microstructural parameters for the 10 subjects in the corpus callosum. Pearson’s (R) and Spearman’s (rho) correlation coefficients with relative p-values are reported in each column. Statistically significant results are highlighted in bold.