0737
Diffusion ground truth quantification of axon scale phantom: Limits of diffusion MRI on 7T, 3T and Connectome 1.0
Sudhir Pathak1, Walter Schneider1, Anthony Zuccolotto2, Susie Huang3, Qiuyun Fan4, Thomas Witzel5, Lawrence Wald4, Els Fieremans6, Michal E. Komlosh7, Dan Benjamini7, Alexandru V Avram7, and Peter J. Basser7
1University of Pittsburgh, Pittsburgh, PA, United States, 2Psychology Software Tools, Inc, Pittsburgh, PA, United States, 3Athinoula A. Martinos Center for Biomedical Imaging, Massachusetts General Hospital, Boston, MA, United States, 4Department of Radiology, Massachusetts General Hospital, Boston, MA, United States, 5Massachusetts General Hospital, Boston, MA, United States, 6Department of Radiology, New York University, New York City, NY, United States, 7National Institutes of Health, Bethesda, DC, United States
1University of Pittsburgh, Pittsburgh, PA, United States, 2Psychology Software Tools, Inc, Pittsburgh, PA, United States, 3Athinoula A. Martinos Center for Biomedical Imaging, Massachusetts General Hospital, Boston, MA, United States, 4Department of Radiology, Massachusetts General Hospital, Boston, MA, United States, 5Massachusetts General Hospital, Boston, MA, United States, 6Department of Radiology, New York University, New York City, NY, United States, 7National Institutes of Health, Bethesda, DC, United States
Synopsis
We have constructed a novel Taxon (textile water filled tubes) anisotropic diffusion phantom to provide “ground truth” verification of the current limits of diffusion imaging.This phantom is designed to contain 0.8 micron ID tubes with, a packing density of 106 per mm2 , matched to human axon histology, and allows parametric control of diameters, density, and angle dispersion. On a 7T small-bore scanner, we report the ability to distinguish fine Taxon diameter changes between 2-5 micron diameters and approximate 5 micron ID tubes on the 3T Connectome. This is approaching the anatomical scale of axons found in human brain.
INTRODUCTION
We developed a series of Taxon (textile axon) phantoms that for the first time achieve micron scale diameters on the order of human axon size consisting of 0.8, 2 and 5 um diameter tubes with a packing density of 106 per mm2 scaled to match human, chimp, and monkey corpus callosum axon samples [1] (see Figure 1). Previous studies have developed anisotropic phantoms [2-15] and reviewed in [16], but none have broken through the 5 micron internal diameter (ID) barrier. We report the construction of such phantoms configured for small bore 7T MR imaging as well as clinical 3T systems and the 3T Connectome 1.0 MRI scanner. A major goal of this work was to share the next-generation Taxon phantom by shipping similarly manufactured Taxon phantoms between laboratories and comparing the precision of measurements across scanners with different gradient/system capabilities and different operators. Through this collaborative effort, we tested the phantom in Pittsburgh, NIH, and MGH to determine if 2 and 5 micron diameter fibers could be distinguished using diffusion imaging.METHODS
Phantom production used a bi-component polymer production process with parametric control of Taxon size and shape. The process achieved 0.45 micron control of 9700 pixel points within a nylon thread the size of a human hair to produce a filament of 72-478 microns with hole sizes from 0.8 to 5 microns in phantoms of size ranging from 1 to 140 mm in [17]. Characterization of the fibers was performed with NIST traceable precision using complementary measurement technologies, including confocal microscopy, electron microscopy, micro-CT and analytical balances of filled and unfilled fibers. A micro-phantom consisting of 5 um and 2 um ID fibers located on opposite ends of a 5-mm NMR tube was manufactured and sent to NIH and MGH for diffusion MR imaging. Scanning of the micro-phantom was performed on small-bore and clinical MR systems, including a 7T Bruker in Pittsburgh, and on a 7T Bruker scanner at the NIH equipped with a micro 2.5 microimaging probe and AVANCE III spectrometer where the 2 and 5 mm ID Taxon phantom was scanned using a DPFG-based method [7, 18]. The 5-um region of the micro- phantom was scanned on the dedicated high-gradient 3T Connectome 1.0 MRI system at MGH.RESULTS
Figure 2 shows the micro-phantoms and a head-sized 140-mm phantom. Within the head phantom, two test patterns were used to evaluate variable packing density and crossing angles for comprehensive assessment of fiber geometry and structure in a clinical scanner. FA values varied from 0.55-1.0 within the variable packing density cubes. FA in crossing regions was on the order of 0.5. FA was ~0.7 for density cubes within the central region. Figure 3 shows the pore diameter distributions estimated from measurements on the NIH Bruker 7T using ROI analysis on the micro-phantom. Nominally 2 and 5 microns ID showed reasonable agreement between Taxon diameter distributions measured by a sensitive double diffusion encoding (DDE) MRI method. A second distribution peaked at 11mm was possibly due to phantom imperfection and ROI partial volume artifacts from interstitial fluid around the Taxons. The distribution peaks were observed around the expected/nominal diameters. There was a small positive bias for the 2μm ID Taxons. The peaks were clearly shifted in both the 2 and 5 micron Taxons. Figure 4 shows diffusion MRI signal decays averaged within an ROI centered in the 5-um region of the micro-phantom acquired with a multi-diffusion time, multi-gradient strength protocol on the Connectome 1.0 scanner using Gmax of 300 mT/m. The data was fitted to a generalized AxCaliber approach, and the mean taxon diameter was estimated at approximately 7 um, again demonstrating a slight positive bias as seen in the 7T Bruker data.DISCUSSION
These early results are encouraging, and suggest a pathway to ground truth measurements of axonal geometry in the range of 0.8 to 5 microns. The clear shift in the peaks at 3T and 7T indicate current MR diffusion imaging can distinguish signals in this range but not yet in the Connectome 1.0 scanner. The parametric control of Taxon diameters, packing density, crossings etc. provide challenging tests to advanced diffusion MRI methods. The sharing of matched phantoms across laboratories and creation of open-access data sets for the MRI diffusion community supports a clear pathway to the identification of the limits of the current techniques. The parametric control of Taxon shapes and routing patterns may elucidate options to push beyond those limits with improved hardware, pulse programming and post processing.Acknowledgements
We acknowledge support from the NIH BRAIN Initiative, “Connectome 2.0: Developing the next generation human MRI scanner for bridging studies of the micro-, meso- and macro-connectome”, 1U01EB026996-01; the Center for Neuroscience and Regenerative Medicine (CNRM), HJF; the Intramural Research Program of the Eunice Kennedy Shriver National Institute of Child Health and Human Development Title: Advanced Longitudinal Diffusion Imaging for TBI Diagnosis of Military PersonnelReferences
1. Innocenti, G.M., A. Vercelli, and R. Caminiti, The Diameter of Cortical Axons Depends Both on the Area of Origin and Target. Cerebral Cortex, 2014. 24(8): p. 2178-2188. 2. Caruyer, E., et al. Phantomas: a flexible software library to simulate diffusion MR phantoms. in ISMRM. 2014. 3. Chen, B. and A.W. Song, Diffusion tensor imaging fiber tracking with local tissue property sensitivity: phantom and in vivo validation. Magn Reson Imaging, 2008. 26(1): p. 103-8. 4. Chen, C.C., et al., Quality assurance of clinical MRI scanners using ACR MRI phantom: Preliminary results. Journal of Digital Imaging, 2004. 17(4): p. 279-284. 5. D'Souza, W.D., et al., Tissue mimicking materials for a multi-imaging modality prostate phantom. Medical physics, 2001. 28: p. 688-700. 6. Huber, J.S., Q. Peng, and W.W. Moses, Multi-modality phantom development. IEEE Transactions on Nuclear Science, 2009. 56: p. 2722-2727. 7. Komlosh, M.E., et al., Pore diameter mapping using double pulsed-field gradient MRI and its validation using a novel glass capillary array phantom. Journal of Magnetic Resonance, 2011. 208(1): p. 128-135. 8. Neher, P.F., et al., Fiberfox: facilitating the creation of realistic white matter software phantoms. Magnetic Resonance in Medicine, 2014. 72(5): p. 1460-1470. 9. Perrone, D., et al., D-BRAIN: anatomically accurate simulated diffusion MRI brain data. Plos One, 2016. 11(3): p. e0149778. 10. Yanasak, N. and J. Allison, Use of capillaries in the construction of an MRI phantom for the assessment of diffusion tensor imaging: demonstration of performance. Magnetic Resonance Imaging, 2006. 24: p. 1349-1361. 11. Matsuya, R., et al., A new phantom using polyethylene glycol as an apparent diffusion coefficient standard for MR imaging. International Journal of Oncology, 2009. 35: p. 893-900. 12. Lee, S., et al., Electrical conductivity estimation from diffusion tensor and T2: a silk yarn phantom study. Proceedings 14th Scientific Meeting, International Society for Magnetic Resonance in Medicine, 2006. 26: p. 3034. 13. Horkay, F., C. Pierpaoli, and P.J. Basser. Phantom for diffusion mri imaging. 2010 Januar1 26. 14. Ogrezeanu, G. and A. Hartlep. Fiber tracking phantom. 2009 Apri1 21. 15. Grech-Sollars, M., et al., Stability and reproducibility of co-electrospun brain-mimicking phantoms for quality assurance of diffusion MRI sequences. Neuroimage, 2018. 16. Fieremans, E. and Lee, HH, Physical and numerical phantoms for the validation of brain microstructural MRI: A cookbook. Neuroimage 2018.182: p. 39-61 17. Schneider, W., Pathak, S., Wu, Y., Busch, D., & Dzikiy, J. Taxon anisotropic phantom delivering human scale parametrically controlled diffusion compartments to advance cross laboratory research and calibration, ISMRM 2019, Montreal, Canada. 18. Benjamini, D., Komlosh, M. E., Holtclaw, L. A., Nevo, U. Basser, P. J. White matter microstructure from nonparametric axon diameter distribution mapping. NeuroImage 2016 135:333-44Figures
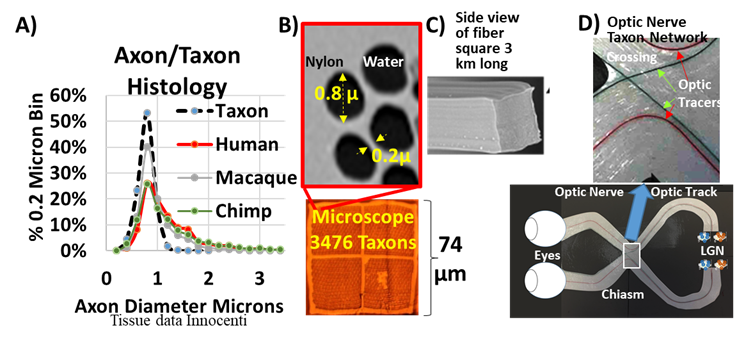
Figure 1. A) Histograms of axonal diameter in humans, macaques, chimpanzees and synthesized textile axons(Taxon). The peak diameter is approximately 0.8 µm based on literature values (Innocenti). B) Transverse electronmicroscopic image of Taxons and C) side view of the fibers. D) The fibers can also be routed to produce crossingpatterns with a 1:1 scale matching the crossing pattern in the optic chiasm, with the path and trajectory of eachfilament machined to 100 µm precision.
Figure
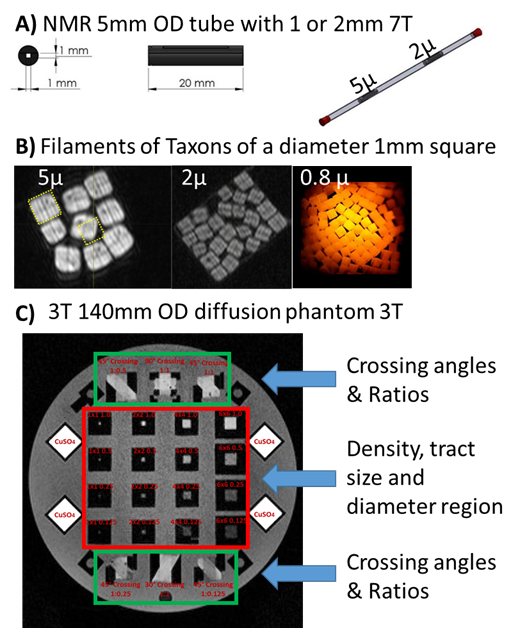
2. A) Micro-phantom manufactured to fit in a 5 mm NMR tube containing fibers of
5 um and 2 um ID. B) Filaments packed into a 1 mm square for three diameters (5
um, 2um and 0.8 um). Each filament contains 3476 Taxon tubes. C) 3T phantom
with crossing fibers (green areas) and variable packing density cubes of
variable size (1, 2, 4, and 6 mm on a side) and density (0.125, 0.25, 0.50, and
1.0). The phantom is sized to fit in a standard 20-cm head coil.
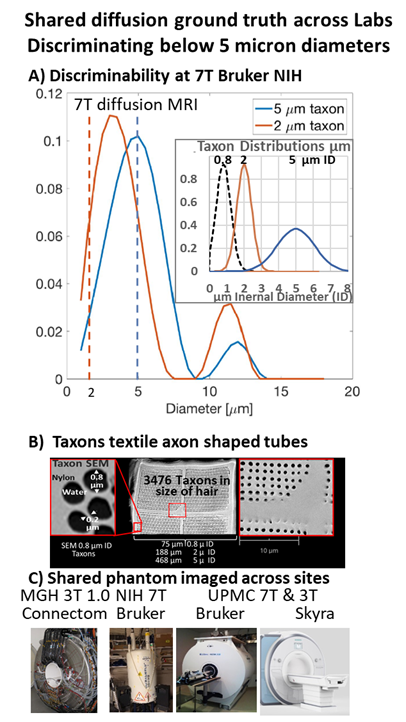
Figure
3. A) NMR tube phantom containing 2 & 5 µm Taxons. The 2 and 5µm peaks are
distinguishable and a shift in the 2. Acquisition was a double diffusion
encoding (DDE) with analysis using Non-parametric axon diameter distributions
(AADs) and Multiple Correlation Functions (MCF) framework. Insert Taxon
distributions illustration based on SEM measurements filament stretch models.
B) Taxon SEM image. C) Phantom scanned on: Connectome 1.0 MGH, Bruker 7T at
NIH, Skyra 3T and 7T Bruker at UPMC.
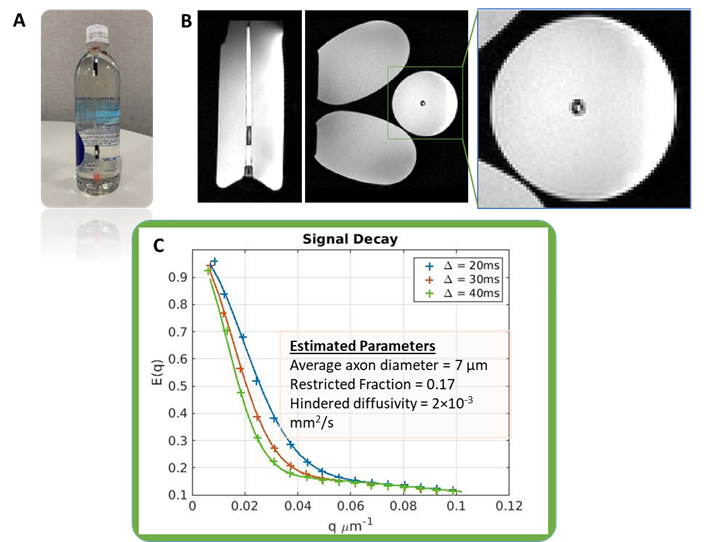
Figure 4. A) NMR tube phantom with containing 5 um ID
water-filled Taxons, immersed in a bottle of corn syrup to load the Connectome
1.0 head coil. B) T1-weighted images (sagittal and axial views) of the
micro-phantom immersed in corn syrup. C) Diffusion signal decays sampled within
an ROI centered in the test region containing the 5-um ID water-filled Taxons,
acquired over a range of diffusion times and q-values up to Gmax of 300 mT/m.
The average taxon diameter was estimated at 7 um.