0735
Incorporating T2-orientational dependence into diffusion-T2 correlation experiments using a tiltable coil1CUBRIC, Cardiff University, Cardiff, United Kingdom, 2Signal Processing Laboratory 5, Ecole Polytechnique Federale de Lausanne, Lausanne, Switzerland, 3Translational Imaging in Neurology Basel, Department of Biomedical Engineering, University Hospital Basel, Basel, Switzerland
Synopsis
The anisotropy of white matter is reflected in various white matter contrasts. Transverse relaxation rates can be probed as a function of fibre-orientation with respect to the main magnetic field, while diffusion properties are probed as a function of fibre-orientation with respect to the gradient field. While the latter is easy to obtain in the same head position, the former involves reorientation of the subject’s head inside the scanner. In this work we deployed a tiltable RF-coil to study R2 anisotropy of the brain white matter in diffusion-T2 correlation experiments.
Introduction
It is well established that in myelinated white matter T2* depends on the orientation of the fibre with respect to B0 due to microscopic susceptibility effects1–5. Orientation-dependence of T2 was also reported recently6-8 and could potentially characterise microscopic-susceptibility more reliably7 and reflect effects related to axon diameter8,9. Experiments designed to probe relaxation-anisotropy commonly involve reorienting the head inside the scanner, and are thus challenged by unintended SNR variations across orientations caused by differences in proximities to the receiver coil, and by increased susceptibility to motion and artefacts due to patient-discomfort.In this work, we re-purpose a tiltable RF coil (originally designed for patient comfort) to investigate T2-orientational dependence within the context of a diffusion-T2 correlation experiment. The coil can be tilted around the left-right axis by 0˚, 9˚and 18˚ to B0, which: 1) minimises patient-discomfort and thus improves reliability; 2) offers a new degree of freedom as tilting around the left-right axis is otherwise difficult to achieve; 3) fixes the coil-to-brain distance across orientations and thus reduces SNR variations; and 4) increases the reproducibility of the experiment. Instead of studying global variations across the whole brain volume, we adopt an along-tract profiling tractometry approach to assess spatial variations into more detail.
Methods
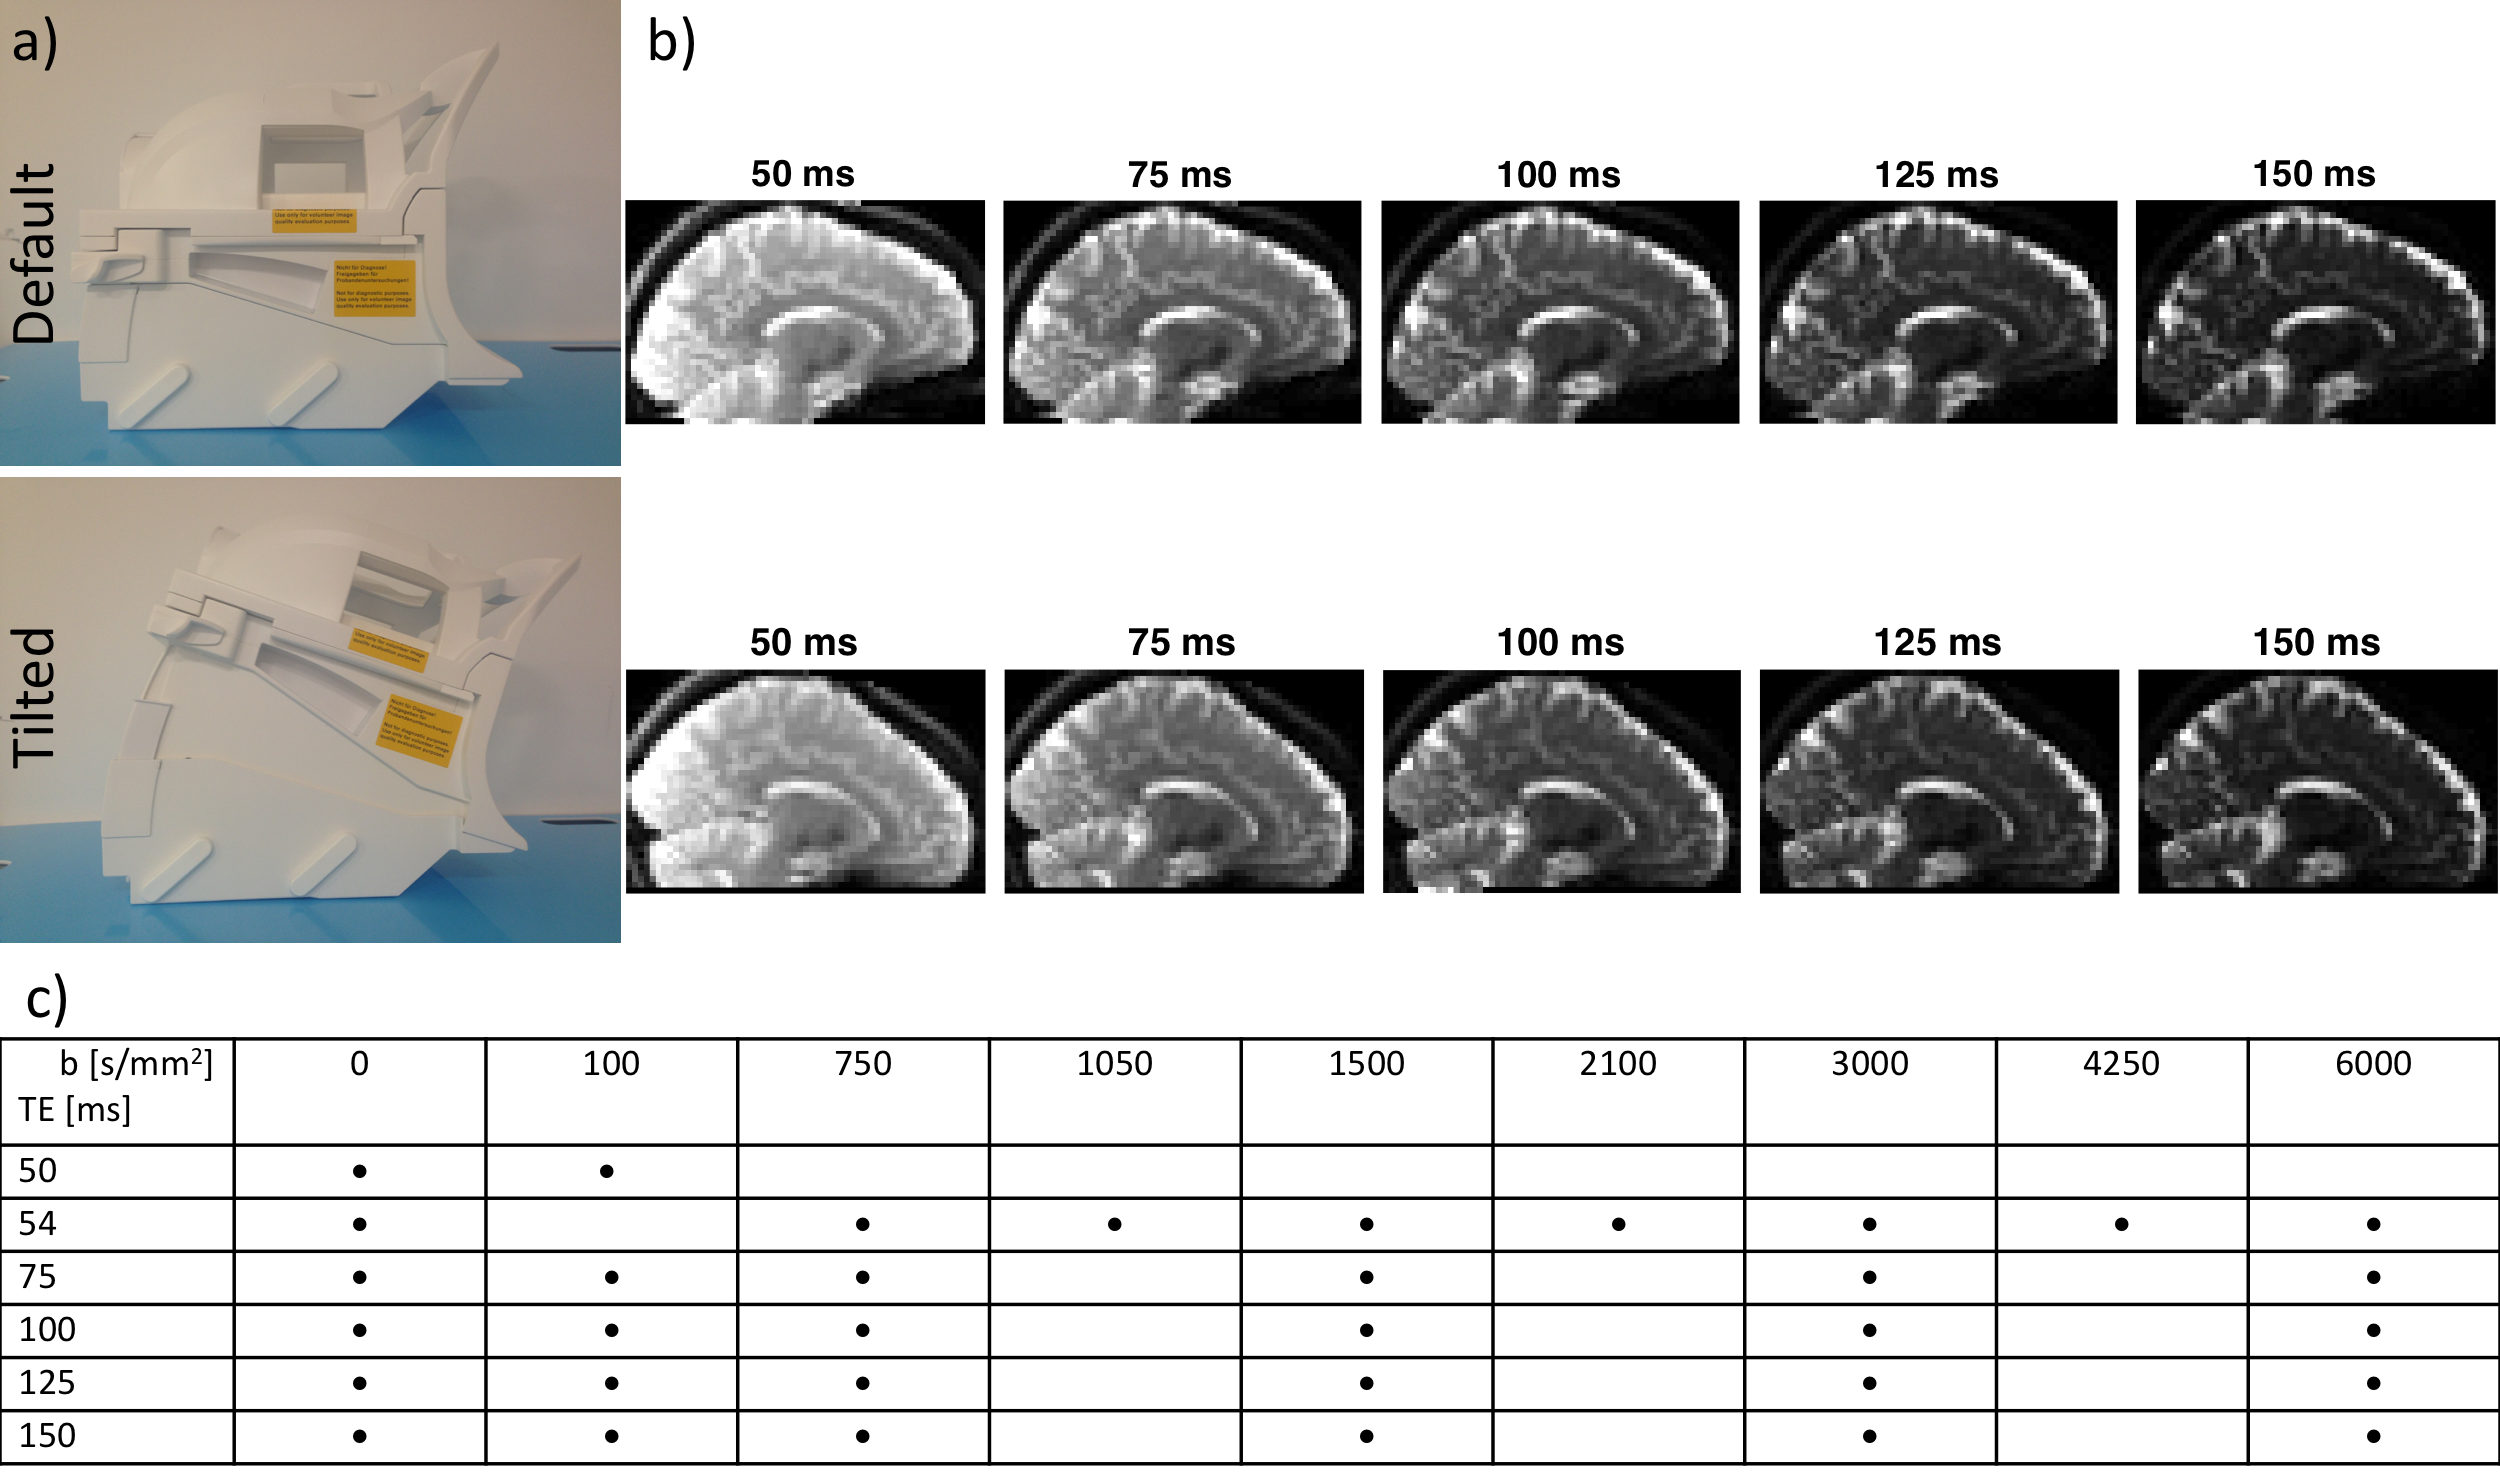
AcquisitionTwo healthy volunteers were scanned on a 3T 300mT/m Connectom scanner equipped with a modified 20-channel head/neck tiltable coil (Siemens Healthcare, Erlangen, Germany) in the default (0˚) and tilted (18˚) position (Fig. 1ab). Diffusion-T2 correlation data were acquired with different TE and b-values (Fig. 1c). Additional b0-images were acquired in the halfway-tilted (9˚) position (not shown). One subject had a second scan in the default position to examine test-retest variability.
Processing
The diffusion-T2 data were preprocessed10–12 and spatial correspondence between the tilted and default position was obtained in two ways:
1) Nonlinear registration13 to the halfway-tilted (9˚) space; and
2) A tractometry (along-tract profiling) approach in each orientations’ native space: multi-shell multi-tissue tractography14 on the TE=54ms data was performed for each coil orientation, and 29 bundles were extracted15 and segmented (20 segments per bundle)16. For segments that visually had minimal fanning, voxels with a single-fibre-population were identified17 and their average orientation within a segment computed after removing directional outliers18.
Estimation
SNR estimates were obtained from the background of the TE=54ms b=0s/mm2 images for both the 0˚ and 18˚ coil-orientations19. The voxel-wise T2 was estimated from the b0-images using a nonlinear least-squares trust-region-reflective algorithm in Matlab.
Residual bootstrapping (100 permutations) was performed to test if the difference in T2 due to coil-orientation was larger than the estimation-uncertainty.
Results
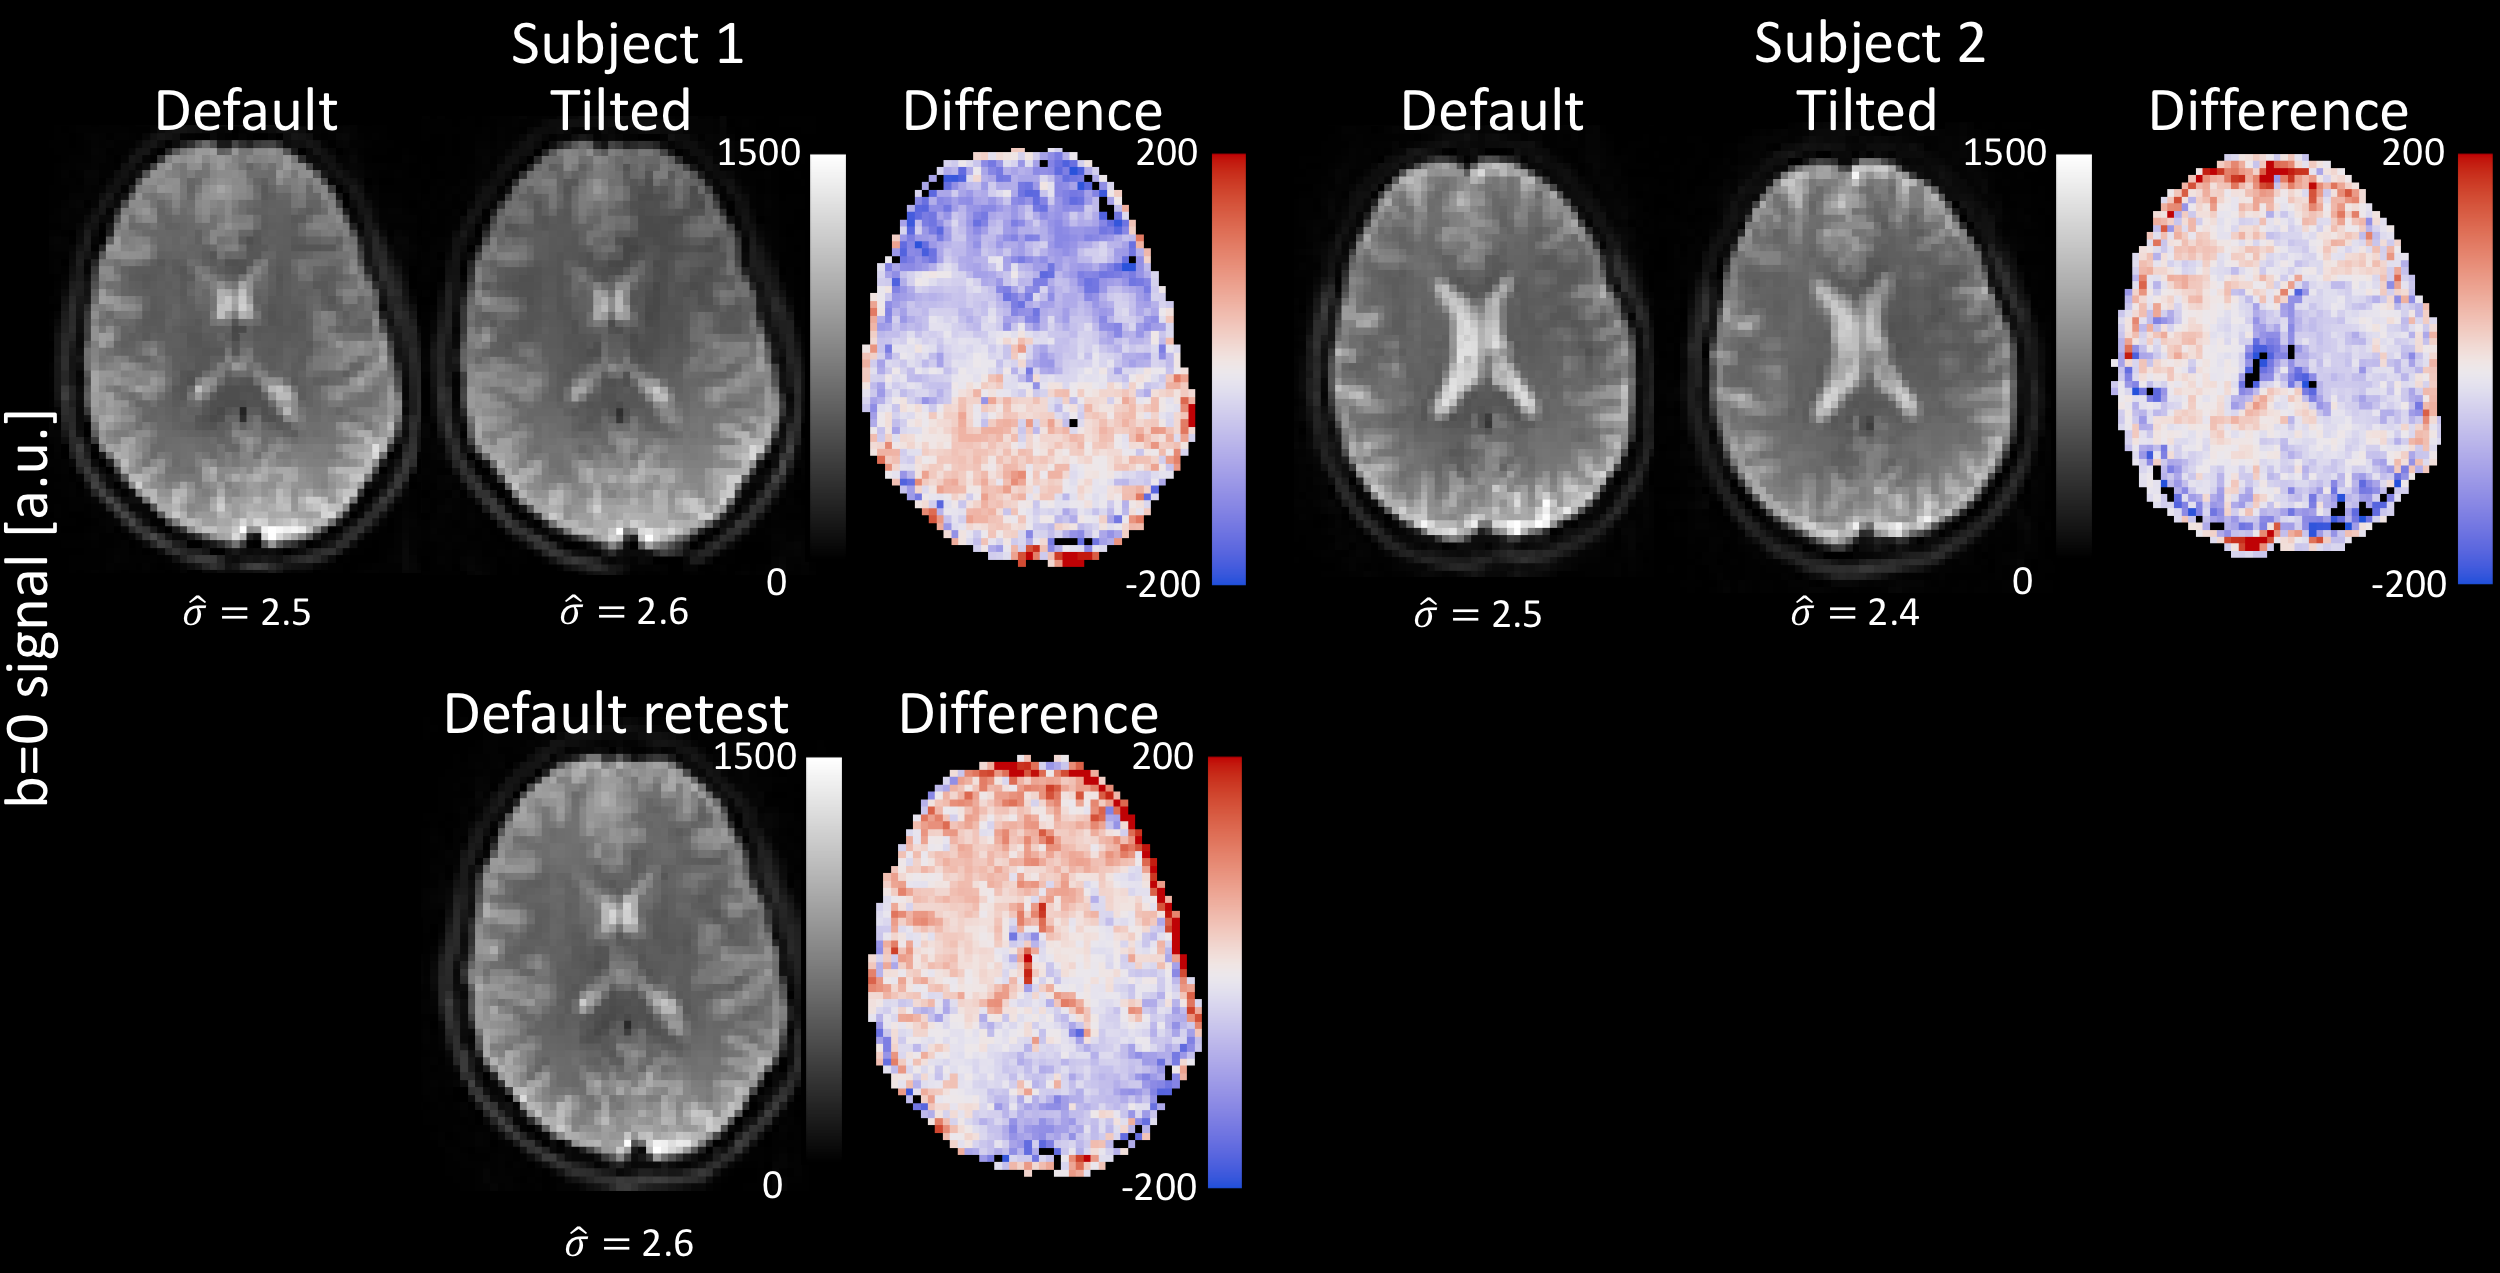
1) Registration to halfway-tilted spaceThe estimated noise standard deviation was similar for the two coil-orientations, and the signal (and thus SNR) varied within a similar range as could be expected from test-retest scans in the same orientation (Fig.2). Globally the images are aligned but some local misalignments can still be observed.
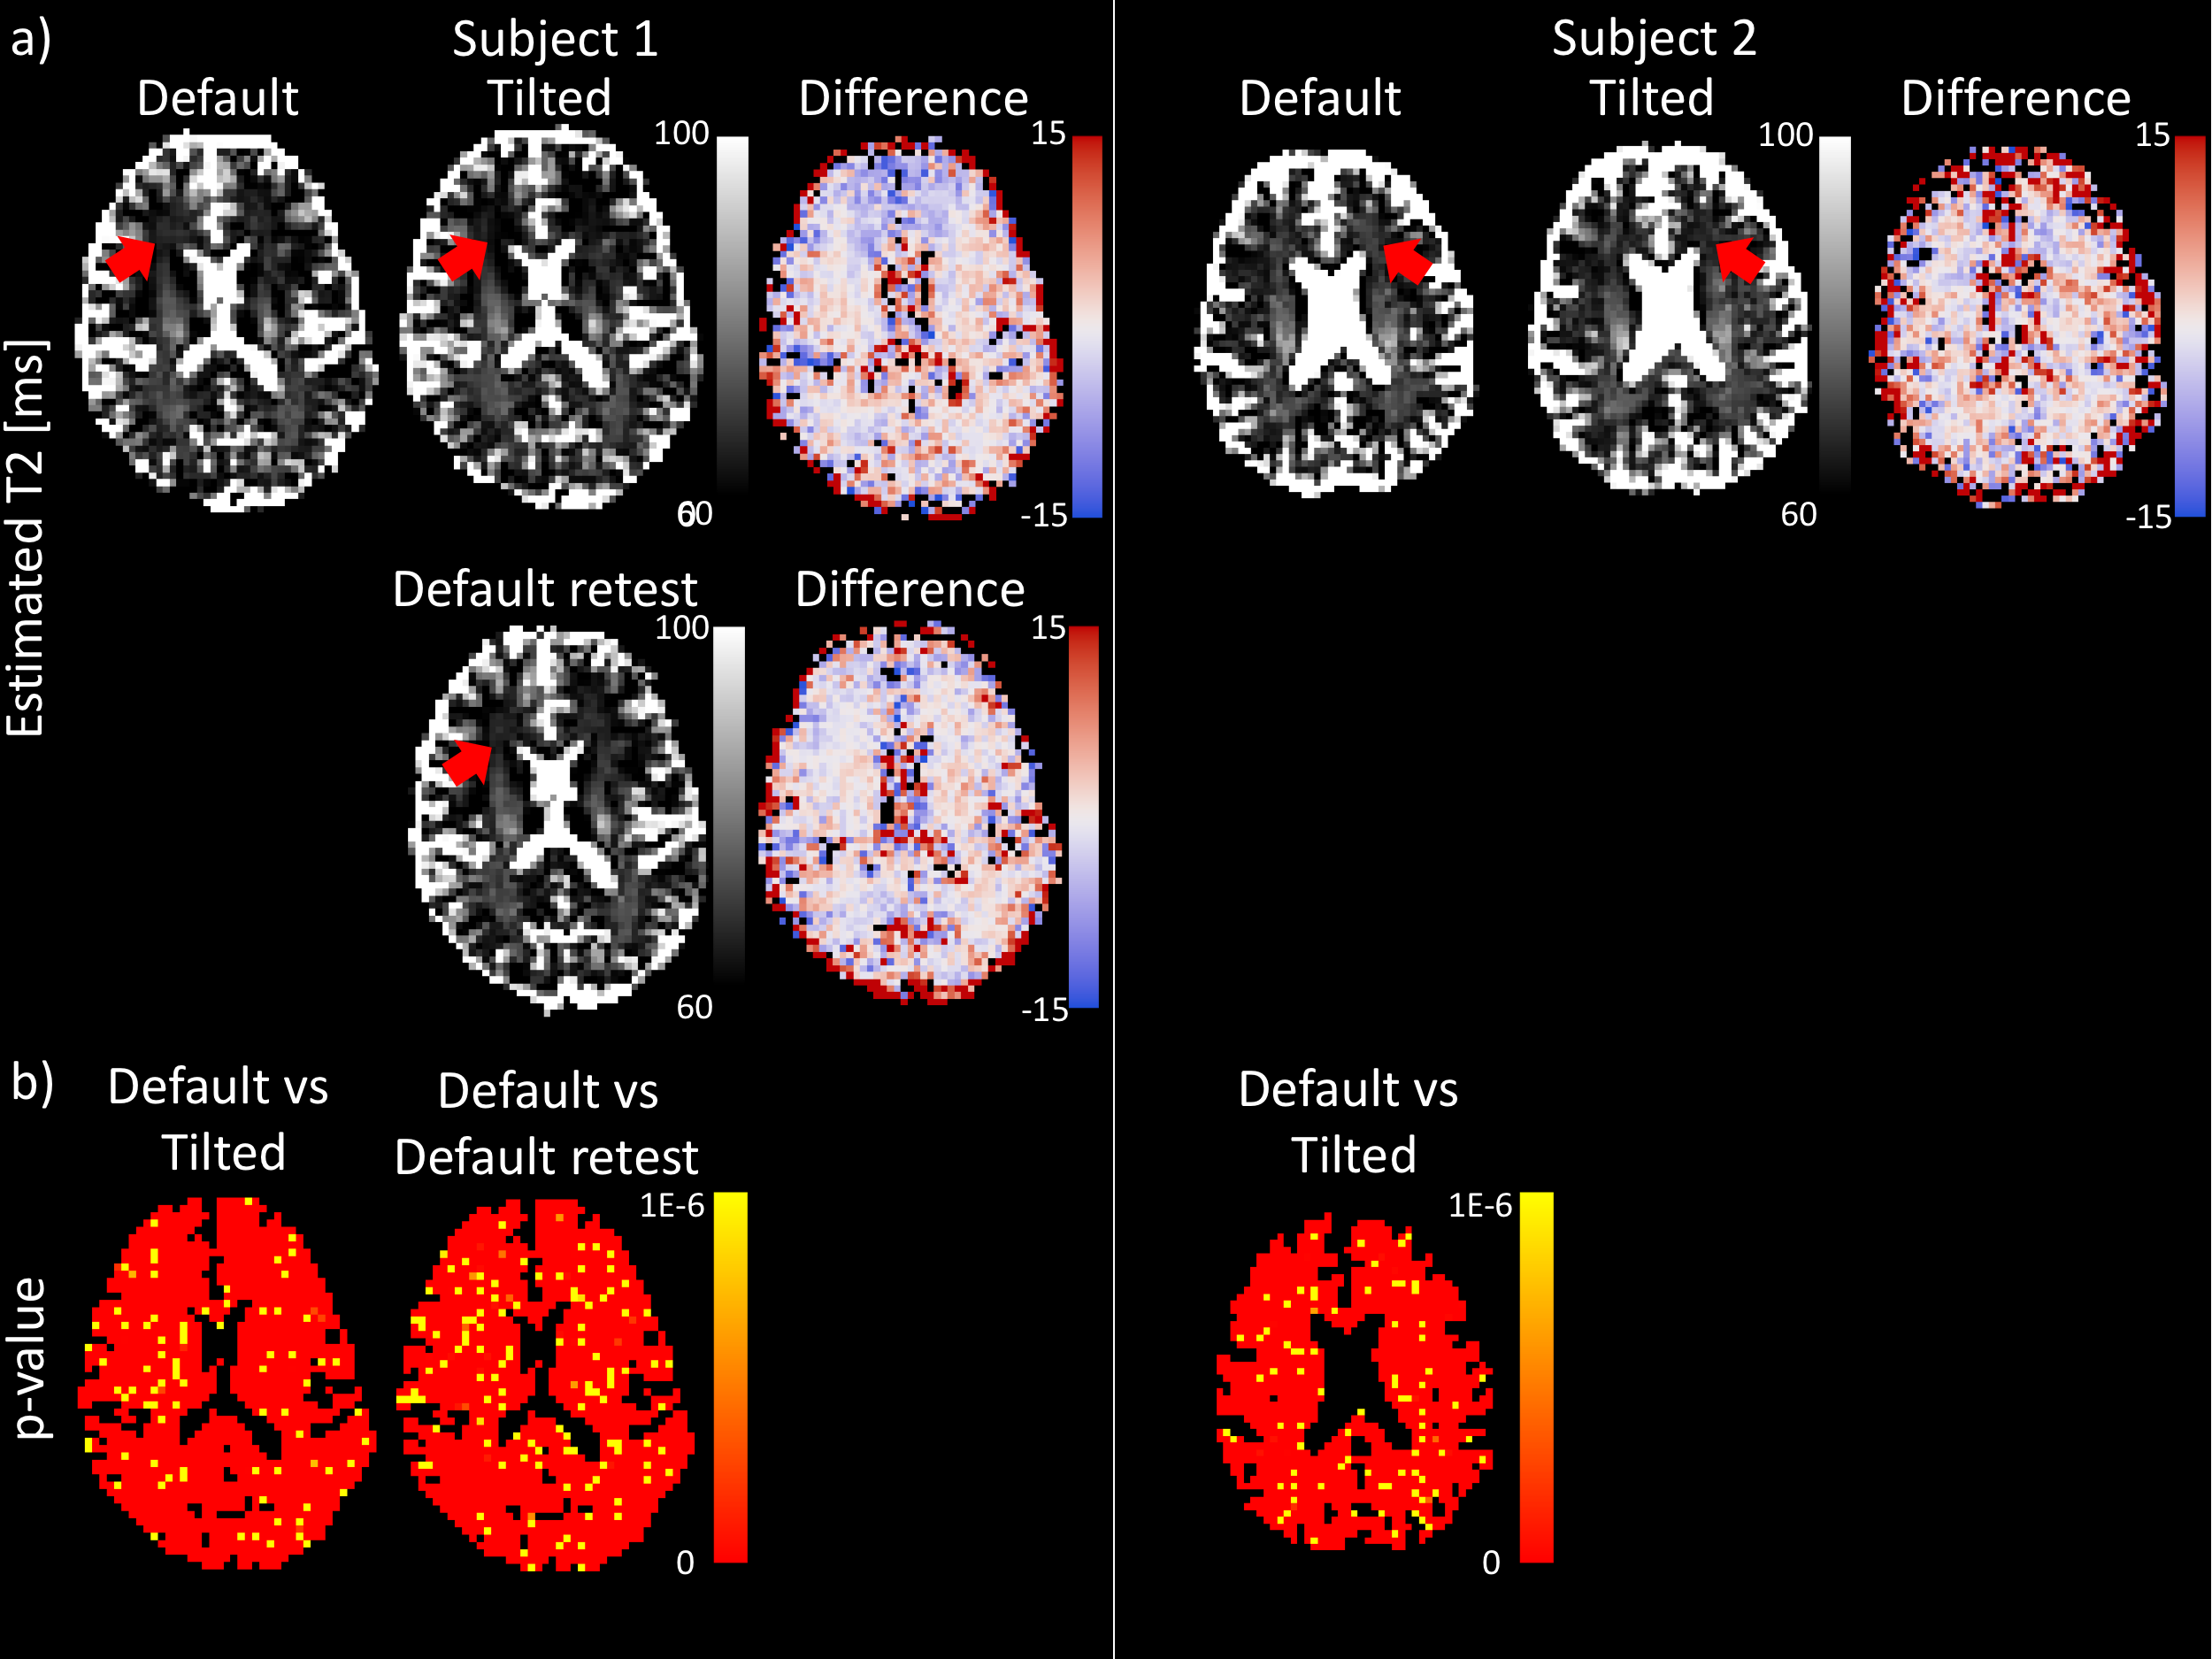
Fig.3a highlights differences in estimated T2 for different coil-orientations; globally the difference is larger than would be expected from test-retest variability. Fig. 3b highlights challenges with voxel-wise comparison; the inherent scan-rescan variability already induces significant T2-differences and more power is needed, which could be achieved with a tractometry approach.
2) Tractometry in native space
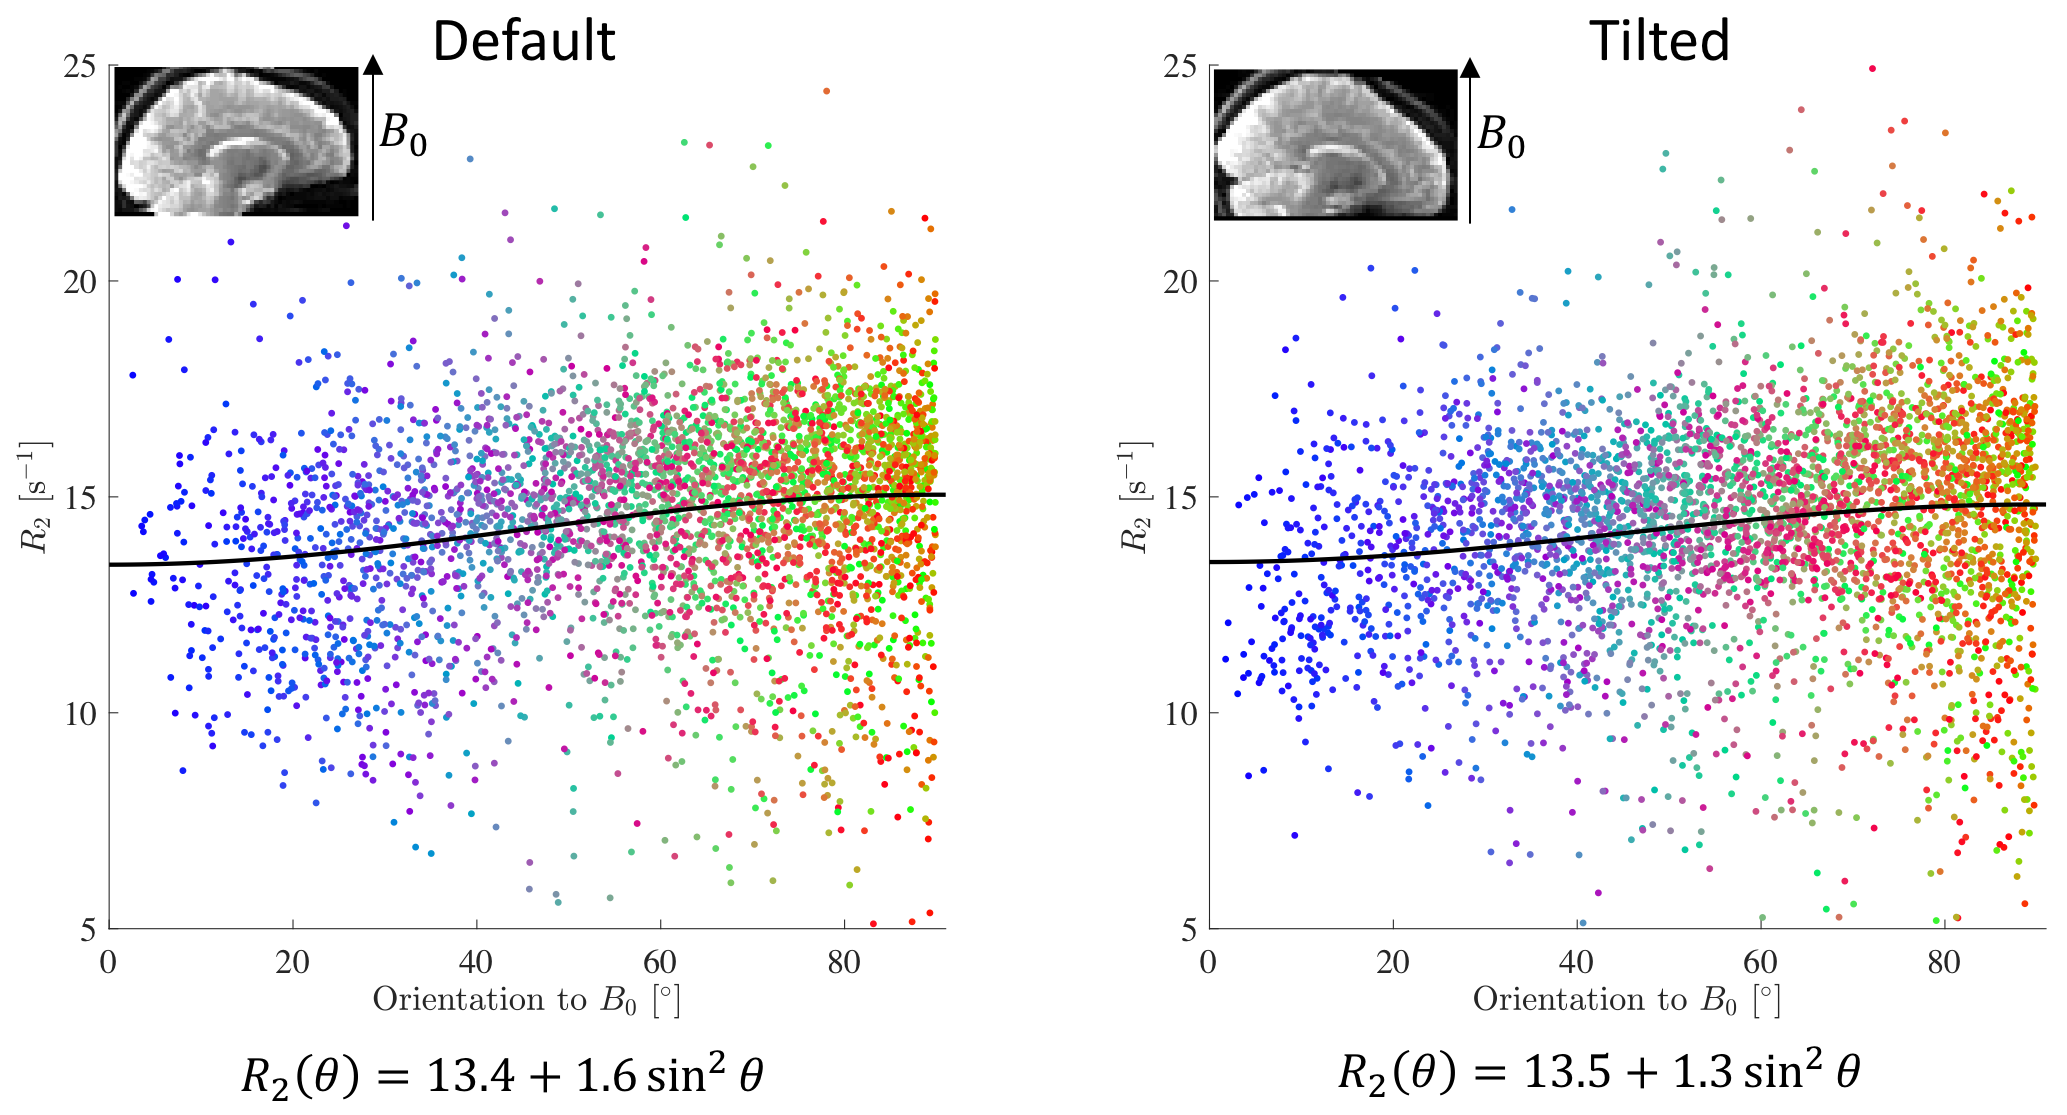
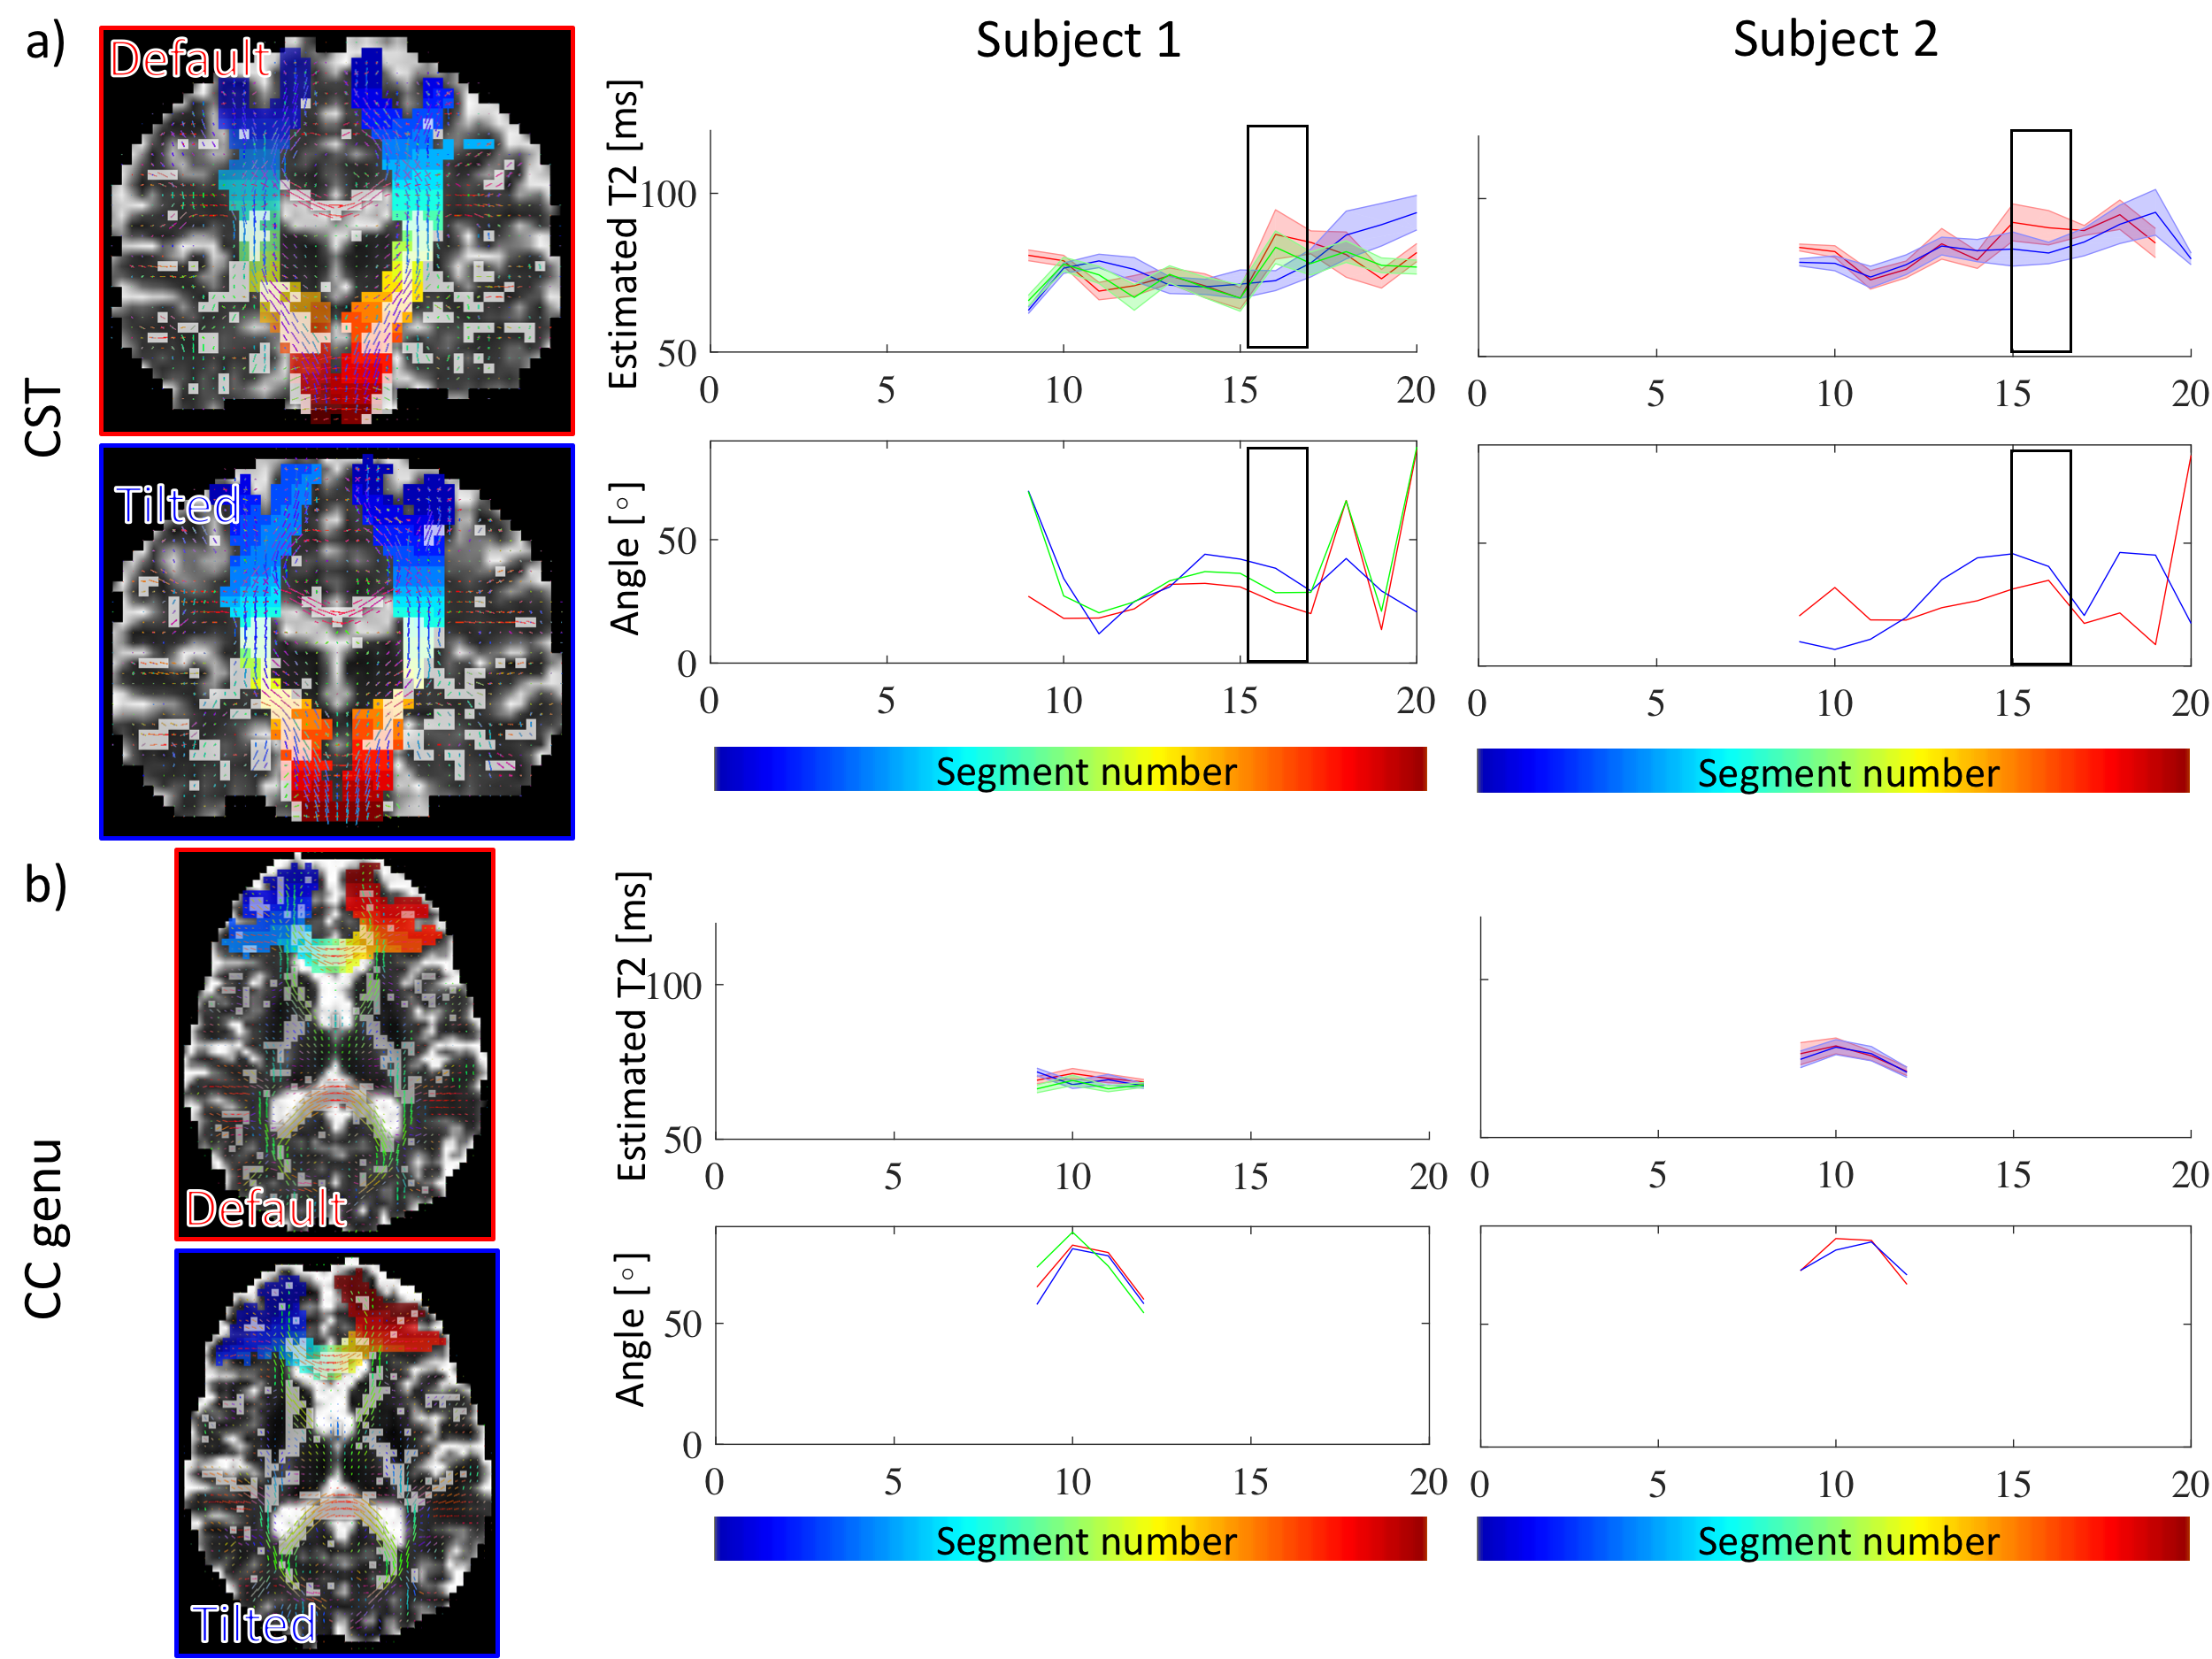
Fig.4 shows how T2 changes as a function of the fibre-orientation w.r.t. the main magnetic field in single-fibre-population voxels.
Tractometry of T2 in the CST reveals a significant increase in T2 (p numerically indistinguishable from 0) in a segment that experiences change in orientation w.r.t. B0 from ~45˚ in the default position to ~30˚ in the tilted position (Fig.5). This is in the regime where the derivative of the relaxation rate as a function of angle is the largest (Fig.4). In the callosal midbody the angle remains relatively unchanged and so does T2.
Discussion
Including a tiltable coil into the experimental set-up for diffusion-T2 correlation measurements paves the way for a more reliable assessment of orientational T2 dependence. Microstructural origins of the T2 difference could include differences in pathway properties (e.g. axon diameter) or susceptibility effects. T2 orientational-dependence would furthermore impact analyses frameworks that assume constant T2 along pathways20. Voxel-wise comparison of T2 from different head-orientations remains challenging due to complications in experiment setup, imperfect correction for geometric distortions, and intrinsic scan-variability. Using a tractometry framework, we found significant regional changes in T2 upon tilting of the head. In future work, the diffusion-T2 correlation experiments can be used to study compartmental T2 orientation-dependence.Acknowledgements
CMWT is supported by a Rubicon grant (680-50-1527) from the Netherlands Organisation for Scientific Research (NWO) and a Sir Henry Wellcome Fellowship (215944/Z/19/Z). DKJ and MC are supported by a Wellcome Trust Investigator Award (096646/Z/11/Z) and a Wellcome Trust Strategic Award (104943/Z/14/Z). We are grateful to Fabrizio Fasano, Peter Gall, and Matschl Volker from Siemens Healthcare GmbH for their support.References
1. Rudko DA, Klassen LM, De Chickera SN, Gati JS, Dekaban GA, Menon RS. Origins of R2* orientation dependence in gray and white matter. Proc Natl Acad Sci U S A. 2014;111(1). doi:10.1073/pnas.1306516111
2. Van Gelderen P, De Zwart JA, Lee J, Sati P, Reich DS, Duyn JH. Nonexponential T 2* decay in white matter. Magn Reson Med. 2012;67(1):110-117. doi:10.1002/mrm.22990
3. Wharton S, Bowtell R. Fiber orientation-dependent white matter contrast in gradient echo MRI. Proc Natl Acad Sci U S A. 2012;109(45):18559-18564. doi:10.1073/pnas.1211075109
4. Bender B, Klose U. The in vivo influence of white matter fiber orientation towards B 0 on T2* in the human brain. NMR Biomed. 2010;23(9):1071-1076. doi:10.1002/nbm.1534
5. Sati P, van Gelderen P, Silva AC, et al. Micro-compartment specific T2* relaxation in the brain. Neuroimage. 2013;77:268-278. doi:10.1016/j.neuroimage.2013.03.005
6. Knight MJ, Wood B, Couthard E, Kauppinen R. Anisotropy of spin-echo T 2 relaxation by magnetic resonance imaging in the human brain in vivo. Biomed Spectrosc Imaging. 2015;4(3):299-310. doi:10.3233/BSI-150114
7. Gil R, Khabipova D, Zwiers M, Hilbert T, Kober T, Marques JP. An in vivo study of the orientation-dependent and independent components of transverse relaxation rates in white matter. NMR Biomed. 2016;29(12):1780-1790. doi:10.1002/nbm.3616
8. McKinnon ET, Jensen JH. Measuring intra-axonal T 2 in white matter with direction-averaged diffusion MRI. Magn Reson Med. 2019;81(5):2985-2994. doi:10.1002/mrm.27617
9. Kaden E, Alexander DC. Can T2-spectroscopy resolve submicrometer axon diameters? Inf Process Med Imaging. 2013;23:607-618. doi:10.1007/978-3-642-38868-2_51
10. Andersson JLR, Sotiropoulos SN. An integrated approach to correction for off-resonance effects and subject movement in diffusion MR imaging. Neuroimage. 2016;125:1063-1078. doi:10.1016/j.neuroimage.2015.10.019
11. Kellner E, Dhital B, Kiselev VG, Reisert M. Gibbs-ringing artifact removal based on local subvoxel-shifts. Magn Reson Med. 2016;76(5):1574-1581. doi:10.1002/mrm.26054
12. Rudrapatna SU, Parker GD, Roberts J, Jones DK. Can we correct for interactions between subject motion and gradient-nonlinearity in diffusion MRI? In: ISMRM. ; 2018:1206.
13. Avants BB, Tustison NJ, Stauffer M, Song G, Wu B, Gee JC. The Insight ToolKit image registration framework. Front Neuroinform. 2014;8(APR). doi:10.3389/fninf.2014.00044
14. Jeurissen B, Tournier JD, Dhollander T, Connelly A, Sijbers J. Multi-tissue constrained spherical deconvolution for improved analysis of multi-shell diffusion MRI data. Neuroimage. 2014;103:411-426. doi:10.1016/j.neuroimage.2014.07.061
15. Wasserthal J, Neher P, Maier-Hein KH. TractSeg - Fast and accurate white matter tract segmentation. Neuroimage. 2018;183:239-253. doi:10.1016/j.neuroimage.2018.07.070
16. Cousineau M, Jodoin PM, Morency FC, et al. A test-retest study on Parkinson’s PPMI dataset yields statistically significant white matter fascicles. NeuroImage Clin. 2017;16:222-233. doi:10.1016/j.nicl.2017.07.020
17. Tax CMW, Jeurissen B, Vos SB, Viergever MA, Leemans A. Recursive calibration of the fiber response function for spherical deconvolution of diffusion MRI data. Neuroimage. 2014;86. doi:10.1016/j.neuroimage.2013.07.067
18. Rodriguez A, Laio A. Clustering by fast search and find of density peaks. Science (80- ). 2014;344(6191):1492-1496. doi:10.1126/science.1242072
19. Koay CG, Özarslan E, Pierpaoli C. Probabilistic Identification and Estimation of Noise (PIESNO): A self-consistent approach and its applications in MRI. J Magn Reson. 2009;199(1):94-103. doi:10.1016/J.JMR.2009.03.005
20. Daducci A, Dal Palù A, Lemkaddem A, Thiran JP. COMMIT: Convex optimization modeling for microstructure informed tractography. IEEE Trans Med Imaging. 2015;34(1):246-257. doi:10.1109/TMI.2014.2352414
Figures