0734
Orientation-dependent biases in powder averaging caused by inhomogeneous distributions of magnetic susceptibility in white matter1DTU Compute, Technical University of Denmark, Kgs. Lyngby, Denmark, 2Danish Research Center for Magnetic Resonance, Functional and Diagnostic Imaging and Research, Copenhagen University Hospital Hvidovre, Hvidovre, Denmark
Synopsis
Numerical experiments show orientation dependency of the powder averaged diffusion signal (commonly assumed orientation-invariant) when susceptibility-induced inhomogeneity in white matter is taken into account. This implies an axon-orientation-dependent bias of the diffusion signal from white matter regions containing non-uniformly dispersed myelinated axons, which would lead to an over-estimation of the anisotropy. This implies a potential bias between the interpretation of the signal from eg. the internal capsule (oriented inferior-superior) and corpus callosum (oriented left-right).
Introduction
Susceptibility-induced inhomogeneity in the $$$B_0$$$-field is well-known and well-studied at the macrostructural scale, where especially the boundaries between air cavities, brain tissue and bone can cause significant deviations [6][1]. Such effects are also present at the micro-structural scale, where the main contribution comes from myelin [16]. As the geometries and susceptibility differences are much smaller at this scale, the effects are as well. But inhomogeneous distributions of magnetic susceptibility has been shown to affect the diffusion signal [11]. We show numerical computations of the microstructure-induced $$$B_0$$$-field inhomogeneity for straight myelinated axons, and how this induces an axon-orientation-dependent bias in the powder averages (commonly applied and assumed to be orientation-independent). Furthermore we show how a biologically realistic axon, segmented from three-dimensional x-ray scattering tomography [2] affects the $$$B_0$$$-field and discuss the influence of such realistic biological structures.Methods
Straight-parallel-axon-substrateA white matter model of straight myelinated axons and three compartments (intra-axonal, extra-axonal and myelin) containing straight hollow cylinders was generated with the AxonPacking-software [9]. Outer diameters were sampled from a gamma distribution with $$$\text{mean}=3\mu\text{m}$$$ and $$$\text{var}=1\mu\text{m}$$$. The fiber volume fraction is $$$0.69$$$. Myelin thickness was determined from a g-ratio of 0.6 [12]. The magnetic susceptibility $$$\chi$$$ of the myelin is set to 0.99999221 (as fat), and the intra-axonal and extra-axonal is set to 0.99999096 (as water) [13].
Bio-realistic-axon-substrate
A biologically realistic axon substrate was acquired from segmentation of synchrotron imaging [2] with a spatial resolution of 375 nm isotropic.
B-field computation
The B-field resulting from a three-dimensional distribution of magnetic permeability $$$\mathbf{\mu_r}=\mathbf{\chi}+1$$$ is given by\begin{equation} \mathbf{B_{resulting}}=\mu_0\mathbf{\mu_r}\left(1-\frac{2}{3}(\mathbf{\mu_r}-1)\right)\left(-\nabla\mathbf{\Phi}\right),\end{equation}where $$$\mu_0$$$ is the magnetic permeability of vacuum, and $$$\mathbf{\Phi}$$$ is the magnetic scalar potential (MSP). The MSP is computed numerically with in-house software [15] (inspired by [4][3]) by applying finite difference methods to solve the equation\begin{equation} \nabla\cdot\left(\mathbf{\mu_r}\nabla\mathbf{\Phi}\right)=0.\end{equation}Fields were computed for different angles $$$\theta_z=[0.00,0.50]\cdot\pi$$$ between the $$$B_0$$$-field and the axon axes.
PGSE simulations
Numerical multi-shell PGSE [14] experiments were conducted with in-house software [15] for 63 uniformly distributed gradient directions, $$$\text{TE}=15.6\text{ms}$$$, $$$\delta=4.8\text{ms}$$$, $$$\Delta=10.8\text{ms}$$$, gradient strengths $$$[0.00,0.26,0.36,0.44,0.51,0.57]\text{T/m}$$$, and resulting b-values $$$[0.00,1.00,2.00,3.00,4.00,5.00]\cdot 10^9\text{s/m}^2$$$, for the two different orientations $$$\theta_z=[0.00,0.50]\cdot\pi$$$ (by including the corresponding B-fields). As the T2 relaxation in the myelin is short compared to TE, and the remaining compartments [8], the signal from this compartment is neglected.
Powder average fitting
The powder averaged signals [10] were fitted as uniformly oriented monodisperse tensors [5][7]\begin{equation} \frac{S(b)}{S(b=0)}=\exp\left(-b\cdot\text{ADC}_{\perp}\right)\sqrt{\frac{\pi}{4b\cdot\left(\text{ADC}_{||}-\text{ADC}_{\perp}\right)}}\text{erf}\left(\sqrt{\left(\text{ADC}_{||}-\text{ADC}_{\perp}\right)\cdot b}\right),\end{equation}where $$$S$$$ is the signal, $$$b=(\gamma\delta g)^2(\Delta-1/3\delta)$$$ is the b-value, and $$$\text{ADC}_{||}$$$ and $$$\text{ADC}_{\perp}$$$ are the apparent diffusion coefficients parallel and perpendicular to the axon axes, respectively. $$$\text{ADC}_{||}$$$ is assumed to be influenced minimally because the gradient of the induced inhomogeneity is $$$0$$$ parallel to the straight axon axes, and is therefore fixed to the diffusion coefficient $$$2\cdot 10^{-9}\text{m}^2\text{/s}$$$ used to produce the simulations.
Results and discussion
Figure 1 shows cross sections of the deviation $$$\Delta B=B_{applied}-B_{resulting}$$$ for the straight-axon-substrate at both orientations. Deviations are at the order of $$$10^{-5}\text{T}$$$. For $$$\theta_z=0.0$$$ (parallel orientation) deviations are present, but the field within each compartment stays homogeneous. For $$$\theta_z=0.5\pi$$$ deviations are more severe, and the fields within the extra-axonal compartment and the myelin compartment become inhomogeneous.The field inhomogeneity is causing a constant negative offset of the un-normalized signal obtained from the PGSE sequence, and a more anisotropic signal (signal from b-vectors oriented parallel to the axon-axes are less influenced than those oriented perpendicular to). When normalizing the signal with respect to $$$S(b=0)$$$, the individual signal values are experiencing an axon-orientation-dependent re-scaling. Signal normalized by the lower $$$S(b=0)$$$ will have an increased anisotropy compared to the signal normalized by the higher $$$S(b=0)$$$. Hence, higher field inhomogeneity is causing the powder averaged signal to appear more anisotropic, and the powder averaged signal thereby contains a bias due to the field inhomogeneity induced by the myelin in the substrate.
Figure 2 shows powder averages obtained from the PGSE experiments for the straight-parallel-axon-substrate. The signal for $$$\theta_z=0.5\pi$$$ appears more restricted than the signal for $$$\theta_z=0.0$$$ due to the axon-orientation-dependent susceptibility-induced $$$\Delta B$$$.
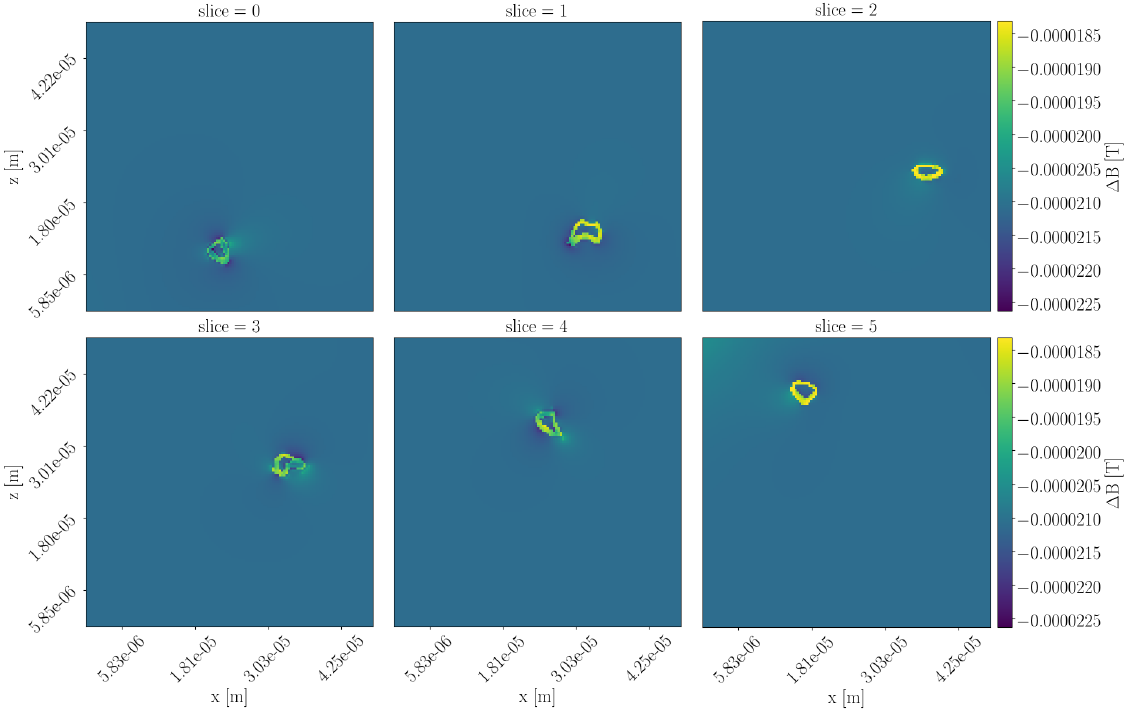
But in biological tissue, axons are not perfectly straight. Figure 3 shows the three-dimensional structure of the bio-realistic-axon-substrate. Figure 4 shows cross-sections of the corresponding $$$\Delta B$$$, where it is clear, that also the B-field in the intra-axonal space will be affecting the diffusion signal. Variance in the orientation of the axon axes is assumed to cancel out some of the axon-orientation-dependency, as gradients will be present for all orientations. Likewise, the axon-orientation-dependency is expected to cancel out for voxels containing uniformly dispersed axons.
Conclusion
An axon-orientation-dependent bias in powder averages was shown for a substrate of straight myelinated axons. When axon-axes were oriented perpendicular to the $$$B_0$$$-field the diffusion signal appeared more anisotropic than when they were oriented parallel to the $$$B_0$$$-field. The gradients induced by biological (non-straight) axons are expected to decrease the axon-orientation-dependency, and uniformly dispersed axons are expected to cancel out the local axon-orientation-dependencies at voxel-scale. This implies an axon-orientation-dependent bias of the diffusion signal from white matter regions containing non-uniformly dispersed myelinated axons, which would lead to an over-estimation of the anisotropy. This implies a potential bias between the interpretation of the signal from eg. the internal capsule (oriented inferior-superior) and corpus callosum (oriented left-right).Acknowledgements
MA and TD has received funding from the Capital Region Research Foundation (grant number A5657). HL has received funding from the European Research Council (ERC) under the European Union’s Horizon 2020 research and innovation programme (grant agreement number 804746).
References
[1] J. L. R. Andersson, S. Skare, and J. Ashburner. How to correct susceptibility distortions in spin-echo echo-planar images: application to diffusion tensor imaging. NeuroImage, 20:870–888, 2003.
[2] M. Andersson, H. M. Kjer, J. Rafael-patino, V. A. Dahl, A. Pacureanu, P. Thiran, M. Bech, A. B.Dahl, and T. B. Dyrby. Uncovering 3D Axonal Morphologies with Synchrotron Imaging : Impact on Microstructure Imaging with Diffusion MRI. ISMRM, 3:4–6, 2019.
[3] R. Bhagwandien, M. A. Moerland, C. J. Bakker, R. Beersma, and J. J. Lagendijk. Numerical analysis of the magnetic field for arbitrary magnetic susceptibility distributions in 3D. Magnetic resonance imaging,12(1):101–7, 1994.
[4] R. Bhagwandien, R. van Ee, R. Beersma, C. J. Bakker, M. A. Moerland, and J. J. Lagendijk. Numerical analysis of the magnetic field for arbitrary magnetic susceptibility distributions in 2D. Magnetic resonance imaging, 10(2):299–313, 1992.
[5] P. T. Callaghan, K. W. Jolley, and J. Lelievre. Diffusion of water in the endosperm tissue of wheat grains as studied by pulsed field gradient nuclear magnetic resonance. Biophysical journal, 28(1), 1979.
[6] C. M. Collins, B. Yang, Q. X. Yang, and M. B. Smith. Numerical calculations of the static magnetic field in three-dimensional multi-tissue models of the human head. Magnetic resonance imaging, 20(5):413–24,jun 2002.
[7] C. D. Kroenke, J. J. Ackerman, and D. A. Yablonskiy. On the nature of the NAA diffusion attenuated MR signal in the central nervous system. Magnetic Resonance in Medicine, 52(5):1052–1059, 2004.
[8] A. L. MacKay and C. Laule. Magnetic Resonance of Myelin Water: An in vivo Marker for Myelin. Brain Plasticity, 2(1):71–91, 2016.
[9] T. Mingasson, T. Duval, N. Stikov, and J. Cohen-Adad. AxonPacking: An Open-Source Software to Simulate Arrangements of Axons in White Matter. Frontiers in neuroinformatics, 11:5, 2017.
[10] S. Nørhøj, H. Lundell, C. Kaae, and T. B. Dyrby. Orientationally invariant metrics of apparent com-partment eccentricity from double pulsed fi eld gradient diffusion experiments. NMR in Biomedicine,(June):1647–1662, 2013.
[11] D. S. Novikov, M. Reisert, and V. G. Kiselev. Effects of mesoscopic susceptibility and transverse relaxation on diffusion NMR. Journal of Magnetic Resonance, 293:134–144, 2018.
[12] B. Y. W. A. H. Rushton. From the Physiological Laboratory, University of Cambridge (Received 10 May 1951) Our knowledge. Journal of Physiology, 115(1):101–122, 1951.
[13] J. F. Schenck. The role of magnetic susceptibility in magnetic resonance imaging: MRI magnetic compatibility of the first and second kinds. Medical Physics, 23(6):815–850, jun 1996.
[14] E. O. Stejskal and J. E. Tanner. Spin diffusion measurements: Spin echoes in the presence of a time-dependent field gradient. The Journal of Chemical Physics, 42(1):288–292, 1965.
[15] S. B. Winther. Susceptibility-induced B-field inhomogeneities at the microstructural scale of brain white matter and the effect in diffusion weighted magnetic resonance imaging. MSc thesis, University of Copenhagen, 2018.
[16] T. Xu, S. Foxley, M. Kleinnijenhuis, W. C. Chen, and K. L. Miller. The effect of realistic geometries on the susceptibility-weighted MR signal in white matter. Magnetic Resonance in Medicine, 79(1):489–500,2018.
Figures
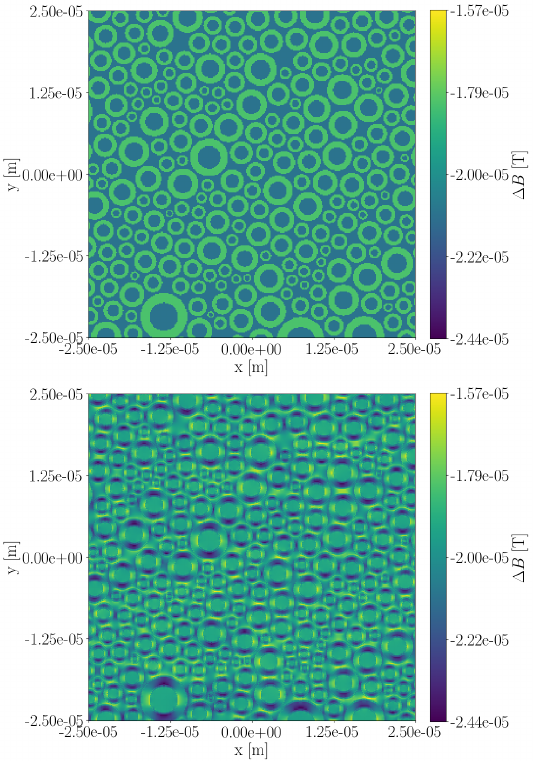
Figure 1: Cross-sections of the deviation between the applied B-field and the inhomogeneity $$$\Delta B$$$ induced by a phantom of axons with radii sampled from a gamma distribution with a mean equal to $$$3\mu\text{m}$$$. Upper: For $$$\theta_z=0.0\pi$$$. Lower: For $$$\theta_z=0.5\pi$$$.
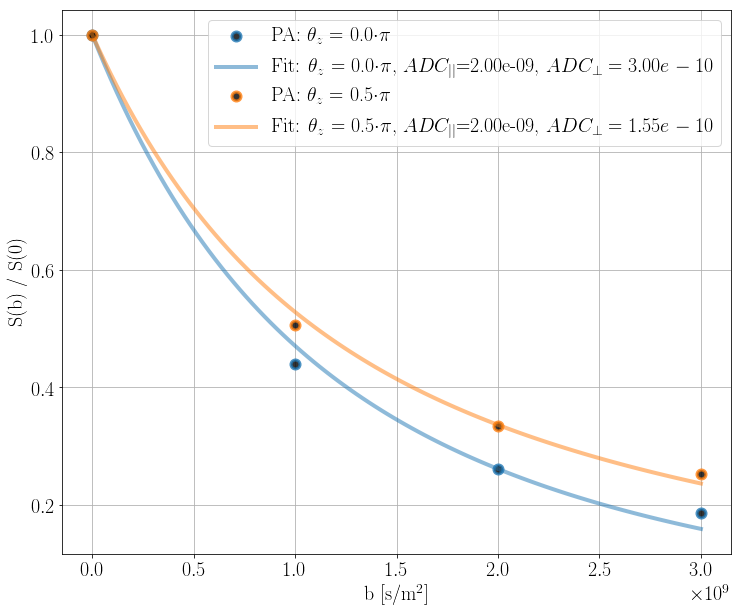
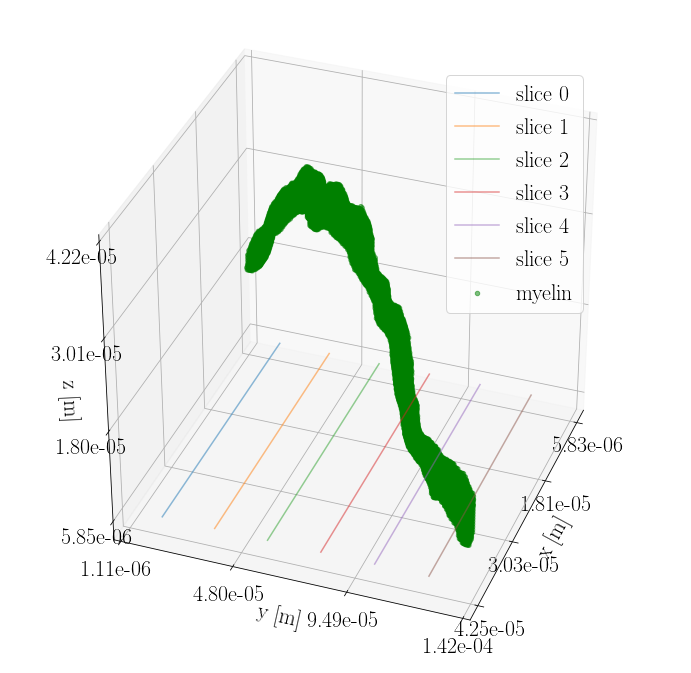
Figure 3: Three-dimensional structure of the bio-realistic-axon-substrate acquired from segmentation of synchrotron imaging \cite{MariamISMRM2019} with a spatial resolution of 375 nm isotropic. Six cross-sections are marked with lines in the xy-plane. $$$\Delta B$$$ for these cross-sections is seen in Figure 4.