0733
Resolving bundle-specific intra-axonal T2 within a voxel using a microstructure-informed approach1Cardiff University Brain Research Imaging Centre, Cardiff University, Cardiff, United Kingdom, 2Signal Processing Laboratory 5 (LTS5), Ecole Polytechnique Fédérale de Lausanne, Lausanne, Switzerland, 3Translational Imaging in Neurology (ThINk) Basel, Department of Biomedical Engineering, University Hospital Basel and University of Basel, Basel, Switzerland, 4Radiology Department, Centre Hospitalier Universitaire Vaudois and University of Lausanne, Lausanne, Switzerland, 5Department of Computer Science, University of Verona, Verona, Italy, 6FIDMAG Germanes Hospitalaries Research Foundation, Barcelona, Spain, 7Mary MacKillop Institute for Health Research, Faculty of Health Sciences, Australian Catholic University, Melbourne, Australia
Synopsis
At the typical spatial resolution of MRI, approximately 60-90% of voxels in the human brain contain multiple fibre populations. Quantifying microstructural properties of distinct fibre bundles within a voxel is challenging. While progress has been made for diffusion and T1-relaxation properties, resolving intra-voxel T2 heterogeneity remains an open question. Here we proposed a novel framework, COMMIT-T2, that uses tractography-based spatial regularization. Unlike previously-proposed voxel-based methods, COMMIT-T2 can recover bundle-specific T2 values within a voxel. Adding this new dimension to the microstructural characterisation of white matter pathways improves the power of tractometry to detect subtle differences in tissue properties.
Introduction
The signal fractions assigned to the intra-axonal and extra-axonal spaces are weighted according to their relative transverse relaxation $$$T_2$$$ times1-8. For example, McKinnon and Jensen8 estimated the mean $$$T_2$$$ of the intra-axonal compartment by suppressing the extra-axonal signal. In their work, the $$$T_2$$$ computed for various regions of interest (ROIs) located in areas of different bundles with single fibre populations were similar within the tracts and different between tracts7,8, which suggests that different bundles are characterized by different $$$T_2$$$ times and that the $$$T_2$$$ relaxation may be bundle-specific.We propose a new method for recovering the distinct intra-axonal $$$T_2$$$ of each bundle passing through a voxel. This approach, named COMMIT-$$$T_2$$$, is an extension of the COMMIT framework9.
We compared our novel approach with voxel-based methods, including the direction-averaged method8 and AMICO-$$$T_2$$$, a new extension to the AMICO framework10.
Methods
Generative modelThe measured signal $$$S(TE,b,\overrightarrow{g})$$$ for a given $$$TE$$$, $$$b$$$-value, and diffusion gradient unit vector $$$\overrightarrow{g}$$$ is given by:
$$ S(TE,b,\overrightarrow{g})=kPD \left(f_ie^{ \frac{-TE}{T_{2,i}}}S_i (b,\overrightarrow{g})+f_ee^{\frac{-TE}{T_{2,e}}}S_e(b,\overrightarrow{g})\right); Eq.(1)$$
where $$$PD$$$ is the proton density, $$$k$$$ is a factor dependent on the MRI acquisition $$$f_i$$$ and $$$f_e$$$ denote the intra- and extra-axonal water signal fractions, respectively; $$$T_{2,i}$$$ and $$$T_{2,e}$$$ are the $$$T_2$$$ values of the compartments, and $$$S_i$$$ and $$$S_e$$$ denote the diffusion-weighted signals from the compartments.
For $$$b=6000s/mm^2$$$, $$$S_e\simeq0$$$ and Eq.(1) becomes:
$$S(TE,b,\overrightarrow{g} )=C\left(e^{\frac{-TE}{T_{2,i}}}S_i(b,\overrightarrow{g})\right); Eq.(2)$$
where $$$C=kPDf_i$$$.
AMICO-$$$T_2$$$
The original dictionary-based AMICO framework10 was extended to include $$$T_2$$$. Each element of the dictionary $$$A$$$ was obtained using Eq. (2), $$$A_{j,k}=e^{ \frac{-TE_j}{T_{2,i_k}}} S_i (b_j, \overrightarrow{g_j})$$$, where $$$TE_j$$$, $$$b_j$$$, and $$$\overrightarrow{g_j}$$$ are the experimental parameters used to acquire the $$$j$$$-th measurement (i.e., $$$y_j$$$), and $$$T_{2,i_k}$$$ is the $$$k$$$-th value from a set of predefined $$$T_{2,i}$$$ values. Specifically, the dictionary was built using $$$20$$$ equally-spaced $$$T_{2,i}$$$ values in the range $$$40-135ms$$$ and $$$S_i$$$ was evaluated using the "stick" model11,12. We fixed13 $$$D_{\parallel}=2mm^2/s$$$.
COMMIT-$$$T_2$$$
Similarly to AMICO, COMMIT is modified to allow for streamline-based $$$T_{2,i}$$$ estimation. COMMIT-$$$T_2$$$ assumes that $$$T_{2,i}$$$ remains constant along a given streamline. The same model parameters used in AMICO-$$$T_2$$$ are employed. To compare this tract-based estimation method with the voxel-based approaches described in previous sections, the resulting mean $$$T_{2,i}$$$ values from multiple streamlines are averaged and projected at each voxel.
Numerical simulations
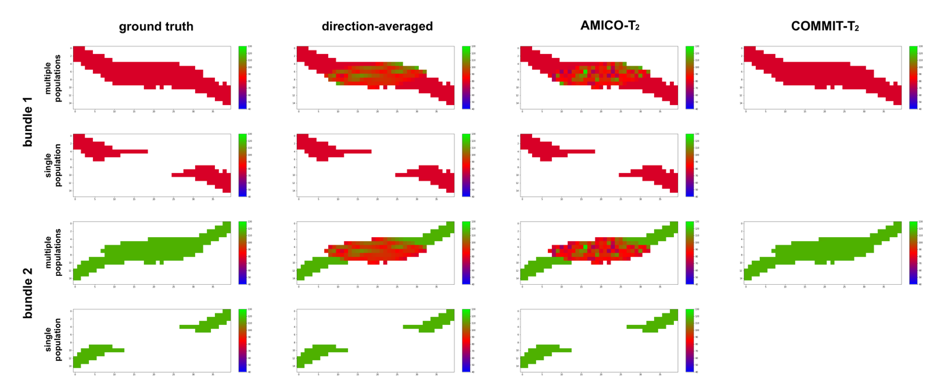
A crossing phantom was drawn in Blender14. The DW-MRI signals were generated following model parameters: Bundle1: $$$T_{2,B_1}=78ms$$$; Bundle2: $$$T_{2,B_2}=116ms$$$. A second experiment generated a suite of numerical phantoms of the crossing fixing $$$T_{2,B_1}=78ms$$$ and changing $$$T_{2,B_2}$$$ in the range $$$40-135ms$$$ with 41 values equally-spaced in $$$T_{2,B_2}$$$.The resulting datasets were corrupted with noise equivalent to the estimation of in-vivo data.
In-vivo data
DWI-MRI data of one subject was acquired using the Connectom 3T MRI scanner, with the following parameters: δ/Δ=$$$8/22$$$ms with b-value=$$$[0/6000]s/mm^2$$$. The protocol was acquired at TE=$$$[73,93,118,150]ms$$$. Additional acquisition at b=$$$3000s/mm^2$$$ and TE=$$$73ms$$$ was to perform tractography. The following preprocessing was applied: denoising15, Gibbs ringing16 and eddy correction17. Probabilistic tractography18 was used to generate 100K streamlines.
Results
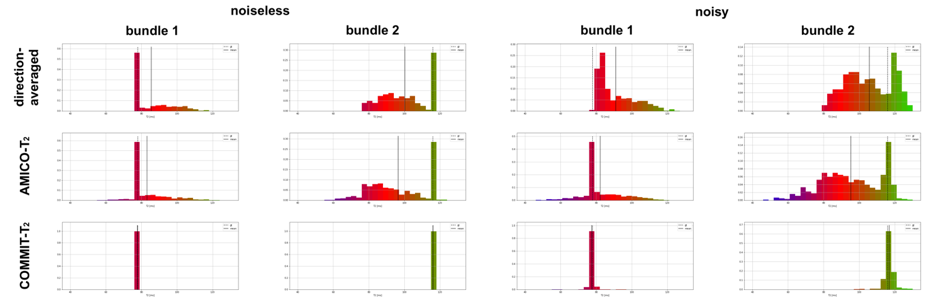
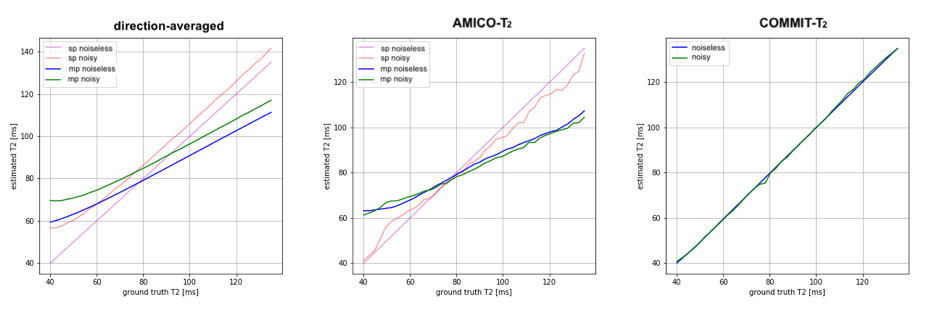
Fig.1 shows the estimated $$$T_{2,i}$$$ values estimated. The first column depicts the two bundles with ground-truth values of $$$T_{2,B_1}=78ms$$$ and $$$T_{2,B_2}=116ms$$$, respectively. In voxels containing a single fiber population, the three methods correctly recovered the ground-truth values. In contrast, in regions with fiber crossings, the $$$T_{2,i}$$$ values estimated by the voxel-based methods lie between the two ground truth $$$T_{2,B_1}$$$ and $$$T_{2,B_2}$$$ values. Notably, COMMIT-$$$T_2$$$ correctly estimated the $$$T_{2,i}$$$ values in both bundles in the fiber crossing region. The histograms of the $$$T_{2,i}$$$ values obtained are shown in Fig.2.Fig.3 shows the plot of the estimated means $$$T_2$$$ of Bundle 2 vs the ground-truth value. In the single-bundle population, estimates derived from the direction-averaged and AMICO-$$$T_2$$$ methods are close to the ground-truth. When multiple bundles are simulated the voxel-based estimates are positively biased for ground-truth values lower than $$$78ms$$$, and negatively biased for values higher than $$$78ms$$$. In contrast, COMMIT-$$$T_2$$$ recovers the correct $$$T_2$$$ values.
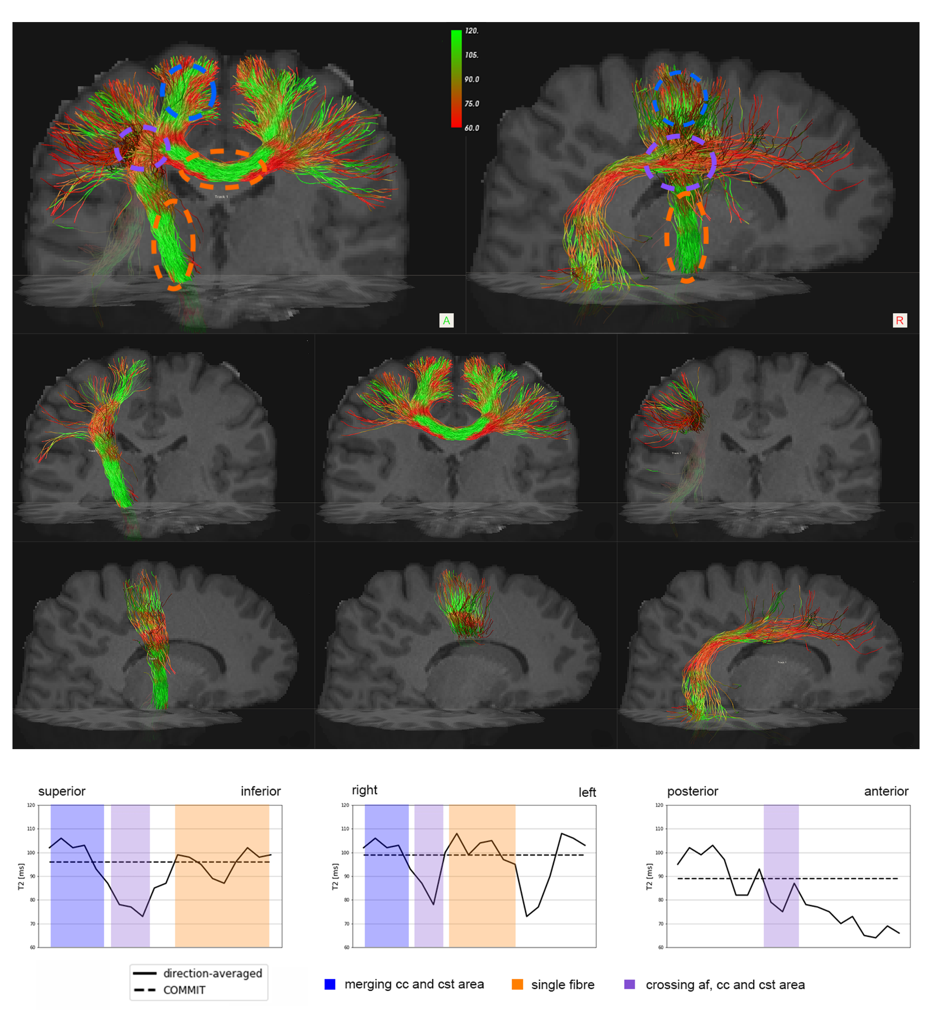
Furthermore, we applied COMMIT-$$$T_2$$$ in vivo data. Fig.4 shows an example of the voxel-wise $$$T_2$$$ estimation projected onto the Corpus Callosum (CC), Corticospinal tract (CST) and Arcuate Fasciculus (AF) bundles. We report that in voxels where three bundles are crossing there is a significant decrease of $$$T_2$$$ values for the CC and CST. This decrease can be related to the $$$T_2$$$ values of the AF which seem to be a bundle with a lower $$$T_2$$$ values.
Discussion
Our results demonstrate superior performance of the COMMIT-$$$T_2$$$ over the other methods evaluated, both in silico and in vivo. An area for future study is to evaluate the impact of violation of the assumption of uniform $$$T_2$$$ along a bundle. It may be that COMMIT-$$$T_2$$$ is more suited to studying developmental, psychiatric disorders, where highly localised changes in microstructure are not anticipated, as opposed to neurological disorders, such as stroke, where the assumption of uniform $$$T_2$$$ along the damaged bundle is certainly not valid.Conclusion
In this study, we focused on quantifying intra-axonal $$$T_2$$$ properties of distinct populations with a voxel. In particular, we addressed some limitations of current voxel-wise techniques and propose an extension of the COMMIT framework to enable the recovery of bundle-specific $$$T_2$$$ within a voxel, even if there are multiple bundles.Acknowledgements
The data were acquired at the UK National Facility for In Vivo MR Imaging of Human Tissue Microstructure funded by the EPSRC (grant EP/M029778/1), and The Wolfson Foundation. The work was also supported by a Wellcome Trust Investigator Award (096646/Z/11/Z) and a Wellcome Trust Strategic Award (104943/Z/14/Z).References
1Niendorf T, Dijkhuizen RM, Norris DG, Campagne M, van L, Nicolay K. Biexponential diffusion attenuation in various states of brain tissue: Implications for diffusion-weighted imaging. Magn. Reson. Med. 1996; 36, 847–857
2Benjamini D, Basser, PJ. Use of marginal distributions constrained optimization (MADCO) for accelerated 2D MRI relaxometry and diffusometry. J. Magn. Reson. 2016; 271, 40–45.
3Kim D, Doyle EK, Wisnowski JL, Kim JH, Haldar JP. Diffusion-relaxation correlation spectroscopic imaging: A multidimensional approach for probing microstructure. Magn. Reson. Med. 2017; 78, 2236–2249.
4Tax C, Rudrapatna U, Witzel T, Jones D. Disentangling in two dimensions in the living human brain: Feasibility of relaxometry- diffusometry using ultra-strong gradients. ISMRM 2017
5Canales-Rodriguez E, Pizzolato M, Aleman-Gomez Y, Kunz N, Pot C, Thiran JP, Daducci A. Unified multi-modal characterization of microstructural parameters of brain tissue using diffusion MRI and multi-echo T2 data. ISMRM 2018
6Pizzolato M, Canales-Rodriguez E, Daducci A, Thiran JP. Multimodal microstructure imaging: joint T2-relaxometry and diffusometry to estimate myelin, intracellular, extracellular, and cerebrospinal fluid properties. ISMRM 2018
7Veraart J, Novikov DS, Fieremans E. TE dependent Diffusion Imaging (TEdDI) distinguishes between compartmental T2 relaxation times. NeuroImage 2018
8McKinnon ET, Jensen JH. Measuring intra-axonal T2 in white matter with direction-averaged diffusion MRI. Magn. Reson. Med. 2019
9Daducci A, Dal Palù A, Lemkaddem A, Thiran JP. COMMIT: Convex optimization modeling for microstructure informed tractography. IEEE Trans. Med. Imaging. (2015)
10Daducci A, Canales-Rodriguez EJ, Zhang H, Dyrby TB, Alexander DC, Thiran JP. Accelerated Microstructure Imaging via Convex Optimization (AMICO) from diffusion MRI data. NeuroImage 2016
11Behrens TEJ, Woolrich MW, Jenkinson M, Johansen-Berg H, Nunes RG, Clare S, Matthews PM, Brady JM, Smith SM. Characterization and Propagation of Uncertainty in Diffusion-Weighted MR Imaging. Magn. Reson. Med. 2003
12Jespersen SN, Kroenke CD, Ostergaard, L, Ackerman JJH, Yablonskiy DA. Modeling dendrite density from magnetic resonance diffusion measurements. NeuroImage 2007
13Dhital, B., Reisert, M., Kellner, E., Kiselev, V.G., 2019. Intra-axonal diffusivity in brain white matter. NeuroImage 2019
14https://www.blender.org/
15Veraart J, Novikov DS, Christiaens D, Ades-Aron B, Sijbers J, Fieremans E. Denoising of diffusion MRI using random matrix theory. NeuroImage 2016
16Kellner E, Dhital B, Kiselev, VG, Reisert M. Gibbs-ringing artifact removal based on local subvoxel-shifts. Magn. Reson. Med.2016
17Andersson JLR, Skare S, Ashburner J. How to correct susceptibility distortions in spin-echo echo-planar images: application to diffusion tensor imaging. NeuroImage 2003
18Tournier J-D, Smith, RE, Raffelt D, Tabbara R, Dhollander T, Pietsch M, Christiaens D, Jeurissen B, Yeh C-H, Connelly A. MRtrix3: A fast, flexible and open software framework for medical image processing and visualisation. bioRxiv 2019
Figures