0726
Testing white matter tissue modeling with multiple diffusion encoding MRI1Neuroscience, Medical University of South Carolina, Charleston, SC, United States, 2Center for Biomedical Imaging, Medical University of South Carolina, Charleston, SC, United States, 3Neurology, Medical University of South Carolina, Charleston, SC, United States
Synopsis
The validation of white matter (WM) tissue modeling for diffusion MRI is challenging, in part, because some of the predicted microstructural parameters (e.g., compartment-specific diffusivities) cannot be easily measured with independent methods such as histology. Most WM tissue models are designed to utilize single diffusion encoding (SDE) MRI data as provided by conventional diffusion MRI sequences. Since multiple diffusion encoding (MDE) MRI yields more information than SDE, it allows for tissue modeling that requires fewer assumptions. Hence, MDE can be applied to help validate the predictions for all SDE model parameters. Here we give an explicit example of this.
Introduction
There are several proposed tissue models for estimating specific microstructural properties in white matter (WM) from diffusion MRI (dMRI) data.1-7 The validation of these models is challenging, in part, because many of the parameters they predict are difficult to measure with independent techniques such as histology. This is particularly true for compartment-specific diffusivities which are often among the most interesting of the predicted quantities. One approach for meeting this challenge is to employ multiple diffusion encoding (MDE) MRI since it generates more comprehensive information about the diffusion dynamics than is possible to obtain with the single diffusion encoding (SDE) MRI sequences (e.g., the Stejskal-Tanner sequence)8 conventionally used with tissue modeling. As a consequence, one can construct MDE tissue models that rely on fewer assumptions than SDE models. Comparison of MDE predictions with the SDE predictions is then a meaningful (if not definitive) test for the accuracy the SDE model. As an example, we use a recently proposed triple diffusion encoding (TDE)9 technique to test an SDE method known as fiber ball white matter (FBWM)10 modeling. A key difference between the two is that FBWM idealizes diffusion in the extra-axonal water pool as Gaussian while this assumption is not needed if TDE data is used. Although useful as a benchmark for FBWM, as well as other tissue models, the TDE method is less practical because the needed sequence is not widely available and requires stronger gradients than found on typical clinical MRI systems.Methods
Three healthy adult volunteers were recruited under a protocol approved by the MUSC IRB. TDE data were gathered with 64 diffusion-encoding directions, an axial b-value of 4000 s/mm2, and a radial b-value of 307 s/mm2 on a Prismafit scanner. Other imaging parameters were TE = 122 ms and TR = 3900 ms with (3 mm)3 voxels. Diffusional kurtosis imaging (DKI)11 data with matched imaging parameters were also acquired for b-values of b = 0, 1000 and 2000 s/mm2. Ten additional b = 0 s/mm2 images were gathered at the end of each dMRI sequence.Raw diffusion data were processed prior to parameter estimation using MP-PCA denoising,12 Gibbs ringing artifact correction,13 motion correction,14 Gaussian smoothing15 and Rician noise bias correction.16 Estimation of microstructural parameters for both TDE and FBWM was performed using methods detailed in prior publications.9,10,17 Parameter values were only compared within cerebral WM. The calculated tissue modeling parameters were the axonal water fraction, $$$ f $$$, the intra-axonal diffusivity, $$$D_a$$$ , the extra-axonal mean diffusivity, $$$\bar{D}_e$$$ , the extra-axonal radial diffusivity, $$$D_{e\perp}$$$ , and the extra-axonal axial diffusivity, $$$D_{e||}$$$. Aggregate diffusion parameters such as mean diffusivity (MD) and fractional anisotropy (FA) were also derived.15
Results
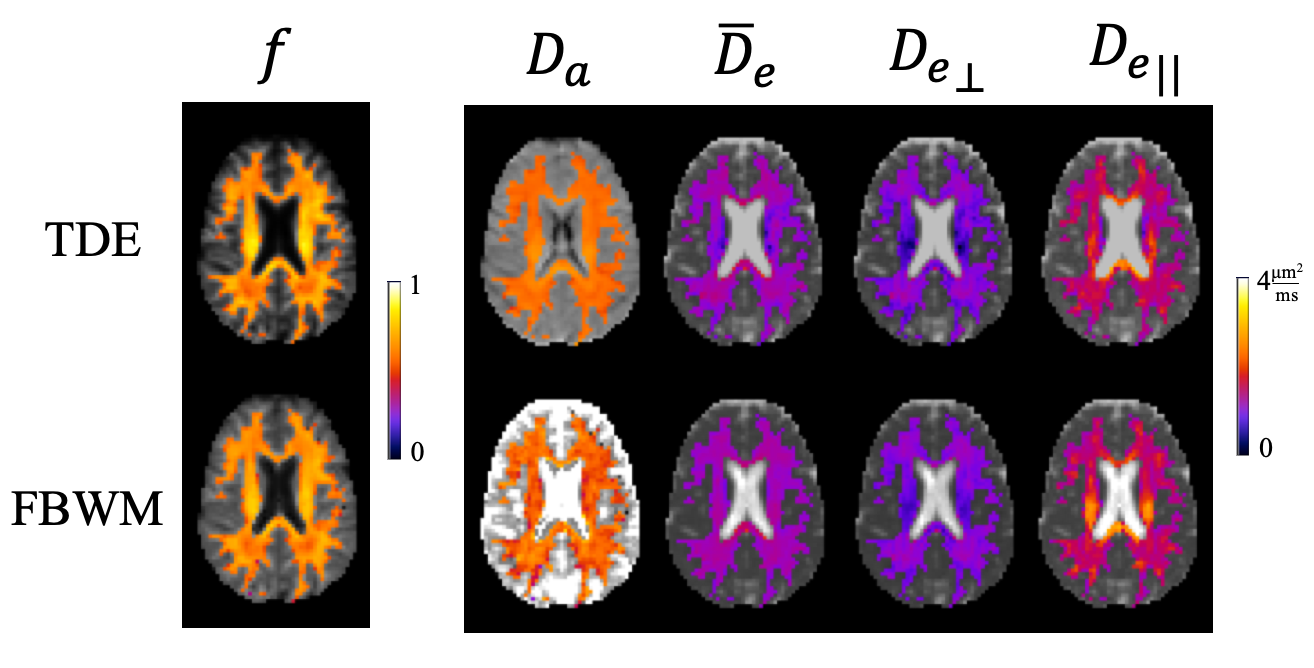
Figure 1 shows an axial slice from one volunteer comparing the modeling parameters estimated from the FBWM and TDE techniques. The WM voxels are colored indicating where the methods are applicable. Qualitatively similar results are seen in deep WM regions but some discrepancies are apparent particularly in edge voxels where gray matter/cerebrospinal fluid (CSF) partial volume effects may be expected. This is most clearly seen in the $$$ D_a $$$ maps which show considerably more spatial variations for FBWM.Histograms of the voxel counts within WM are overlaid for both TDE and FBWM in Figure 2. A remarkable overlap of the histogram values is seen with the mean values for the two technique differing by no more than 7%. However, the spread in $$$ D_a $$$ values for FBWM is substantially larger than for TDE, while the spread in $$$\bar{D}_e$$$ is substantially smaller for TDE.
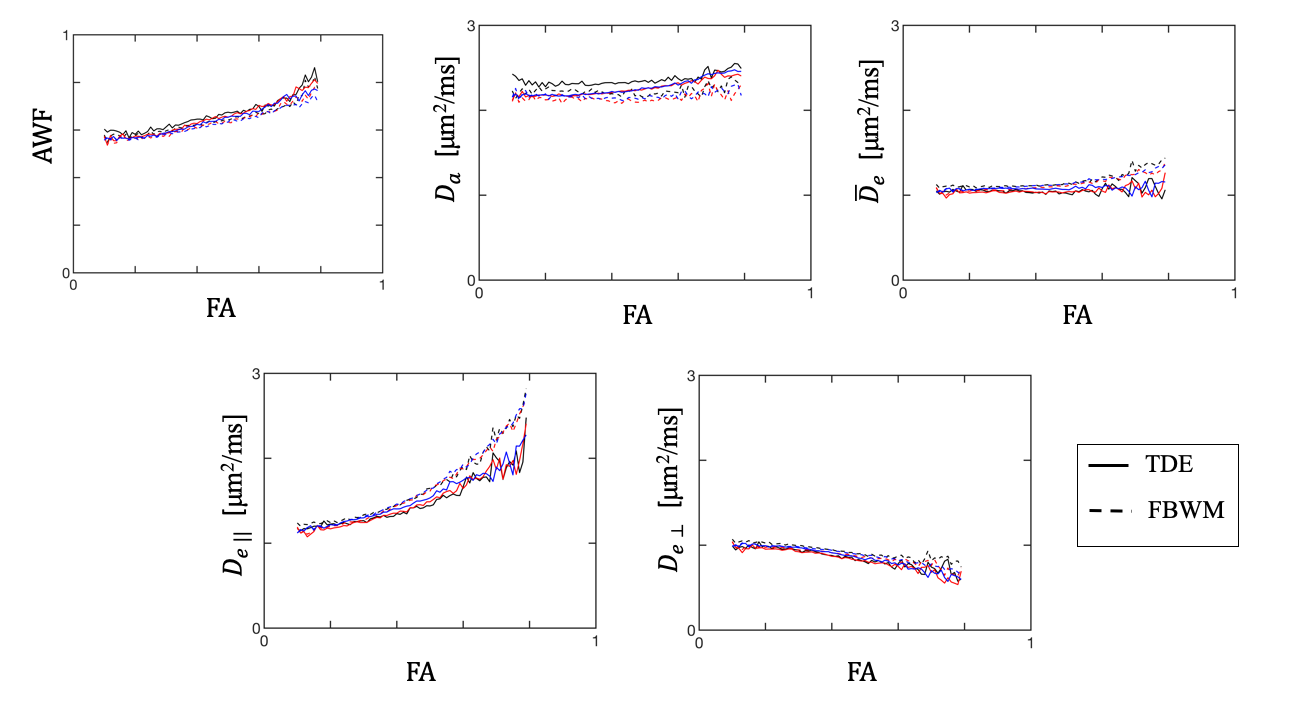
Figure 3 shows the average parameter values for each subject as a function of fractional anisotropy (FA) (bin size = 0.1). A striking similarity is again seen between the two methods in the low to medium anisotropy regimes. Noticeable differences do occur in the higher anisotropy regions, especially for $$$ D_{e||} $$$.
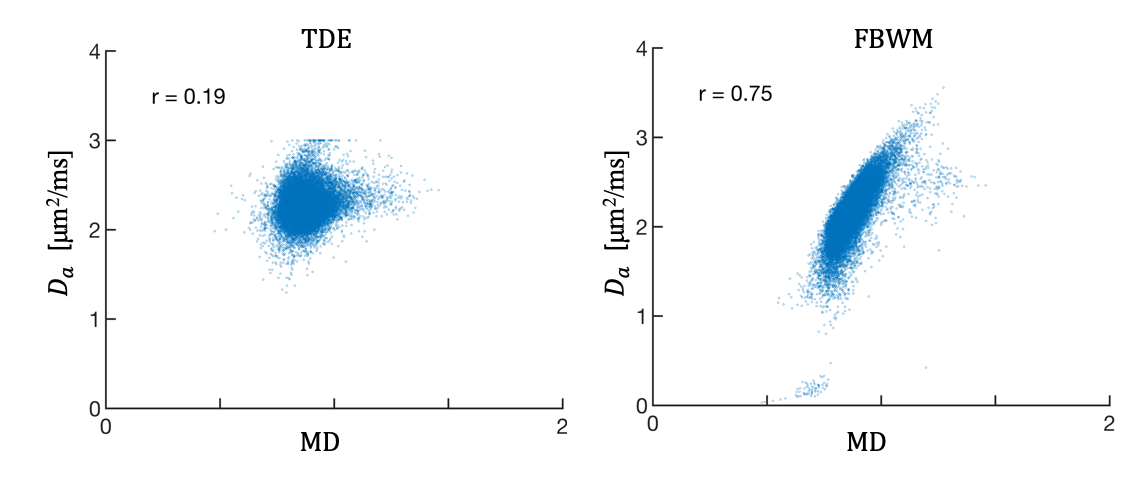
To elucidate potential sources for the observed differences, $$$ D_a $$$ as a function of mean diffusivity (MD) is shown in Figure 4 for both TDE and FBWM. It is seen that $$$ D_a $$$ is strongly correlated with MD for FBWM and not for TDE, suggesting that CSF partial volume effects may be contributing to the higher spatial variability seen with FBWM. This is plausible because the TDE approach is expected to be much less sensitive to CSF contamination.
Discussion
Both intra- and extra-axonal WM tissue modeling parameters were quantitatively compared between TDE and FBWM with good congruence is being observed. Some observed discrepancies may be due to a greater sensitivity to partial volume effects for FBWM. Although the MDE predictions are not true gold standards, they are based on fewer assumptions than the SDE predictions and can thus serve as a meaningful reference. Overall, our results support the accuracy of FBWM especially in deep WM where consistency with TDE was best.The approach used here illustrates how SDE tissue models can be tested with MDE MRI, which provides information on diffusion properties that other commonly used validation techniques, such as histology, are unable to assess. Since TDE predicts the full intra-axonal and extra-axonal diffusion tensors, it could also be used to test SDE MRI methods other than FBWM.
Acknowledgements
NIH NINDS funding: F31NS108623 (to H. Moss)
NIH funding: T32DC014435 (to J. Dubno)
References
1. Zhang H, Schneider T, Wheeler-Kingshott CA, Alexander DC. NODDI: practical in vivo neurite orientation dispersion and density imaging of the human brain. Neuroimage. 2012;61(4):1000-1016.
2. Assaf Y, Basser PJ. Composite hindered and restricted model of diffusion (CHARMED) MR imaging of the human brain. Neuroimage. 2005;27(1):48-58.
3. Kaden E, Kelm ND, Carson RP, Does MD, Alexander DC. Multi-compartment microscopic diffusion imaging. Neuroimage. 2016;139:346-359.
4. Novikov DS, Veraart J, Jelescu IO, Fieremans E. Rotationally-invariant mapping of scalar and orientational metrics of neuronal microstructure with diffusion MRI. Neuroimage. 2018;174:518-538.
5. Veraart J, Novikov DS, Fieremans E. TE dependent Diffusion Imaging (TEdDI) distinguishes between compartmental T2 relaxation times. Neuroimage. 2018;182:360-369.
6. Jensen JH, Russell Glenn G, Helpern JA. Fiber ball imaging. Neuroimage. 2016;124(Pt A):824-833.
7. Moss HG, McKinnon ET, Glenn GR, Helpern JA, Jensen JH. Optimization of data acquisition and analysis for fiber ball imaging. Neuroimage. 2019;200:690-703.
8. Stejskal EOT, J. E. Spin diffusion measurements: spin echoes in the presence of time-dependent field gradient. J Chem Phys. 1965;42:288-292.
9. Jensen JH, Helpern JA. Characterizing intra-axonal water diffusion with direction-averaged triple diffusion encoding MRI. NMR Biomed. 2018;31(7):e3930.
10. McKinnon ET, Helpern JA, Jensen JH. Modeling white matter microstructure with fiber ball imaging. Neuroimage. 2018;176:11-21.
11. Jensen JH, Helpern JA. MRI quantification of non-Gaussian water diffusion by kurtosis analysis. NMR Biomed. 2010;23(7):698-710.
12. Veraart J, Novikov DS, Christiaens D, Ades-Aron B, Sijbers J, Fieremans E. Denoising of diffusion MRI using random matrix theory. Neuroimage. 2016;142:394-406.
13. Kellner E, Dhital B, Kiselev VG, Reisert M. Gibbs-ringing artifact removal based on local subvoxel-shifts. Magn Reson Med. 2016;76(5):1574-1581.
14. Andersson JLR, Sotiropoulos SN. An integrated approach to correction for off-resonance effects and subject movement in diffusion MR imaging. Neuroimage. 2016;125:1063-1078.
15. Tabesh A, Jensen JH, Ardekani BA, Helpern JA. Estimation of tensors and tensor-derived measures in diffusional kurtosis imaging. Magn Reson Med. 2011;65(3):823-836.
16. Gudbjartsson H, Patz S. The Rician distribution of noisy MRI data. Magn Reson Med. 1995;34(6):910-914.
17. Ramanna SM, H. G.; McKinnon, E. T.; Yacoub, E.; Helpern, J. A.; Jensen, J. H. Triple diffusion encoding MRI predicts intra-axonal and extra-axonal diffusion tensors in white matter. Magn Reson Med. 2020.
Figures