0723
Characterizing white matter lesions in multiple sclerosis with time-dependent diffusion MRI reveals the signature of axonal beading1Center for Biomedical Imaging, Department of Radiology, NYU School of Medicine, New York, NY, United States
Synopsis
We observe diffusivity time-dependence along white matter axons in normal-appearing white matter (NAWM) and lesions in 5 relapse remitting multiple sclerosis (MS) patients. The long-time diffusivity along axons is higher in MS lesion than that in NAWM due to persistent demyelination and axonal loss, consistent with previous studies. Further, the axial diffusivity time-dependence is weaker in MS lesions than in NAWM, probably caused by beading due to increased mitochondria in astrocytes/axons in MS lesions. we propose the axial diffusivity time-dependence as a potential specific biomarker for beading, to monitor the progression and treatment response of MS.
Purpose
Multiple sclerosis (MS) is the most prevalent chronic inflammatory disease of the central nervous system[1]. To monitor disease progression and treatment response, it is essential to develop biomarkers[2] that can distinguish between neuroinflammation and degeneration. Biophysical modeling of diffusion MRI has the potential of gaining specificity to cellular changes. Recently, it was shown that diffusion tensor imaging (DTI) with varying diffusion times enables capturing the micrometer-scale axon caliber variation, also referred to as axonal beading in pathology[3]. Here, we show altered time-dependence in the axial diffusivity (AD) in white matter (WM) lesions compared to normal-appearing white matter (NAWM) in MS, and relate the observed changes to specific underlying pathological processes.Methods
$$$\textit{Theory}$$$The time-dependent DTI signal along major axonal tracts is shown to be most sensitive to $$$\textit{axon caliber variation}$$$[3], a vital signature of normal axonal microgeometry that may be altered in pathology, turning into axonal beading, and characterized by a specific power-law time-dependence[4,5],
$$AD(t)\simeq D_\infty + c\cdot t^{-\vartheta}\,, \quad \vartheta = \frac{1}{2}\quad\quad(1),$$
with $$$D_\infty$$$ its long-time limit and $$$c$$$ the amplitude of the overall AD time-dependence emerging from randomly-placed axonal caliber maxima, focal swellings or beads.
$$$\textit{In vivo MRI}$$$
DTI was performed on 5 relapse-remitting MS patients (female, 32-48 years old) using a monopolar PGSE sequence provided by the vendor (Siemens WIP 511) on a 3T Prisma scanner (Erlangen Germany) with a 64-channel head coil, for varying diffusion times, $$$t$$$ = 21-110 ms, and fixed gradient pulse width $$$\delta$$$ = 15 ms. For each diffusion time, we obtained three $$$b=0$$$ and $$$b=500$$$ s/mm$$$^2$$$ along 30 gradient directions, all with the same TR/TE = 4200/150ms. A slab of 5 slices aligned parallel to the AC-PC line was acquired, with an isotropic resolution of (3 mm)$$$^3$$$ and a FOV of 222$$$\times$$$222 mm$$$^2$$$. Total DTI acquisition time is $$$\sim$$$15 min for each subject. In addition, whole brain sagittal 3$$$d$$$ MPRAGE was acquired with isotropic resolution of (1 mm)$$$^3$$$, FOV of 256$$$\times$$$256 mm$$$^2$$$, and TR/TE/TI = 2100/2.72/900 ms, as well as axial FLAIR with anisotropic resolution of 0.6875$$$\times$$$0.6875$$$\times$$$5 mm$$$^3$$$, FOV of 220$$$\times$$$220 mm$$$^2$$$, and TR/TE/TI = 9000/90/2500 ms.
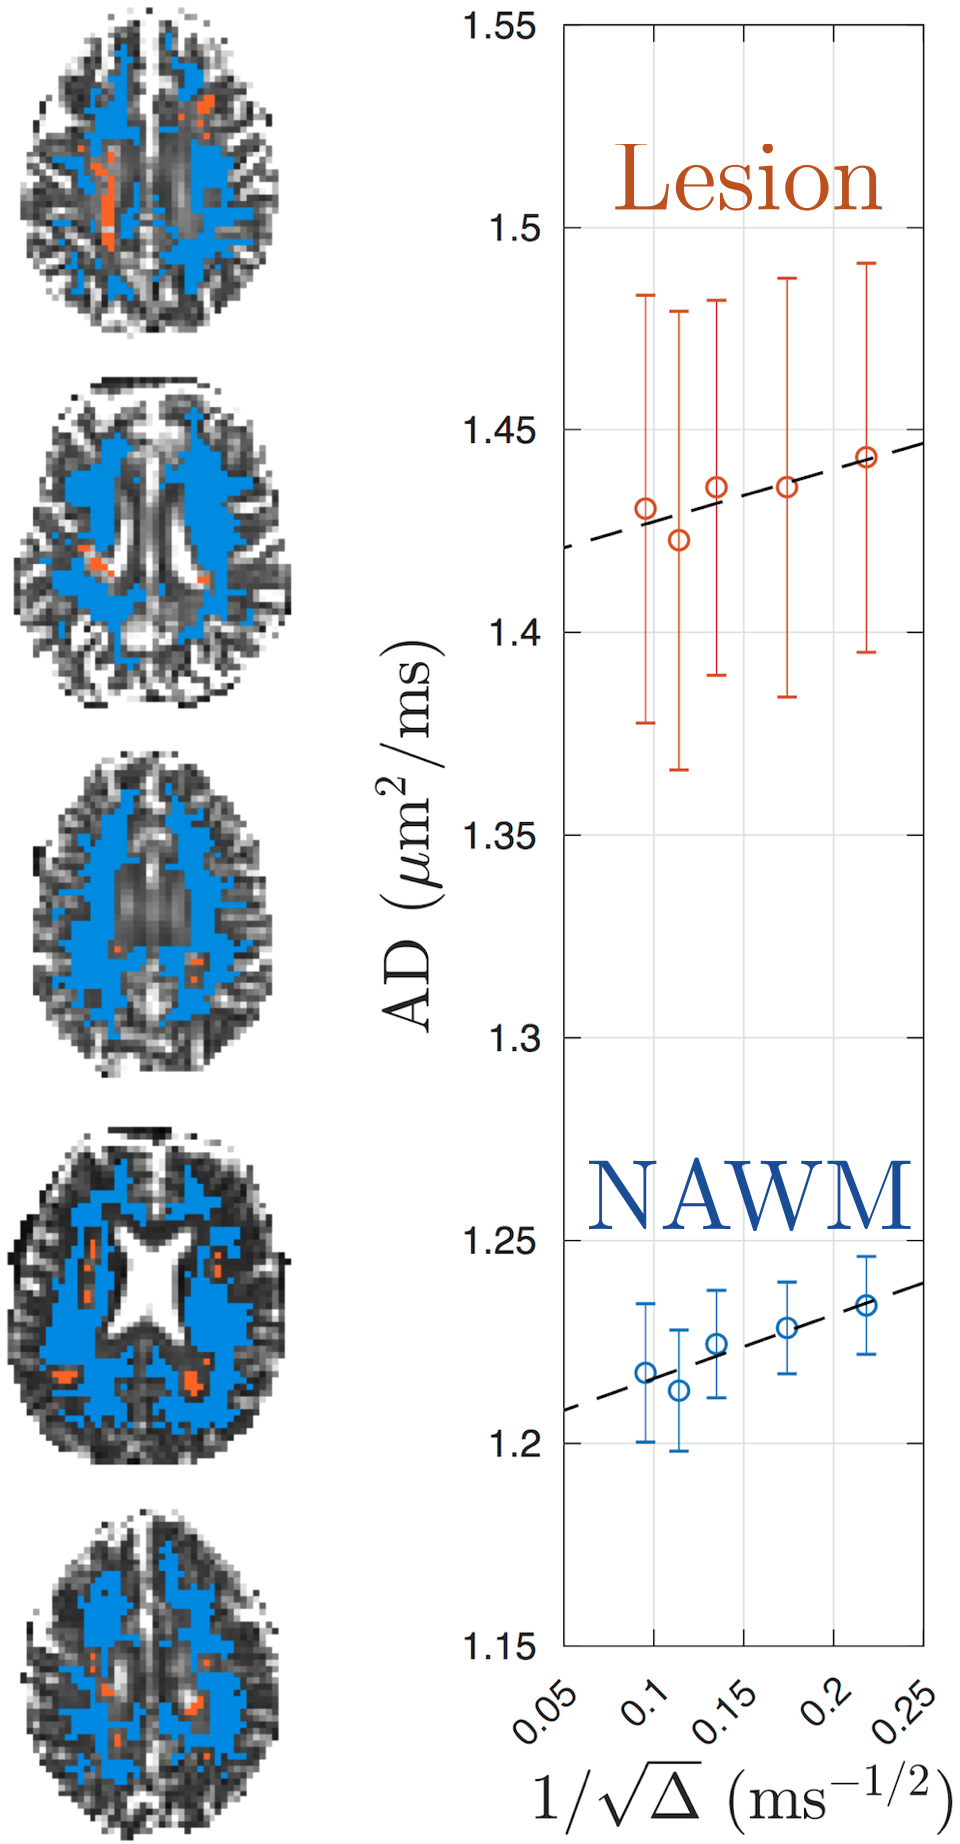
DTI was processed with DESIGNER[6] to extract AD parametric maps. WM lesions were manually segmented by identifying hyper-intensity regions on FLAIR, and transformed to DTI-space using FSL FLIRT/FNIRT. The NAWM was segmented on MPRAGE using FSL FAST and transformed into DTI-space. To avoid partial volume effect, we excluded voxels close to WM lesions and CSF by expanding the mask of lesions and CSF by one voxel. Examples of ROIs of WM lesions and NAWM are shown in Fig.1.
Results
Fig. 1 shows the time-dependent AD in WM lesions and NAWM, averaged over 5 MS patients, with respect to $$$1/\sqrt{t}$$$, demonstrating the characteristic $$$1/\sqrt{t}$$$ power-law relation, Eq. (1), with P-values = 0.042 and 0.012, respectively.Fig. 2 compares the fitted parameters ($$$D_\infty$$$, $$$c$$$) in WM lesions and NAWM, estimated individually in each subject. The bulk diffusivity $$$D_\infty$$$ along axons is increased in WM lesions compared to NAWM (P-value = 0.031, Fig. 2a), potentially due to persistent demyelination and axonal loss in MS lesions[7]. In addition, parameter values for $$$c$$$ are found to be smaller in WM lesions than that in NAWM (P-value = 0.031, Fig.2b).
Fig. 3 explains the observation of decreased $$$c$$$ in terms of increased mitochondrial density and dysfunction. Since the correlation length of diffusion along axons $$$l_c\propto{}c$$$[5], the difference between NAWM and lesions corresponds to a decrease of about 20% in the correlation length, which could be interpreted as a smaller distance between beads. At the same time, it has been shown that these beads happen at locations with mitochondria[3,8], Fig. 3b. Hence, our finding of increased beading suggests a potential increase in mitochondria, which is in agreement with animal and histopathological studies of MS[9], Fig. 3c.
Discussion and Conclusion
Time-dependent DTI measured in vivo in brain WM provides a signature for along-axon caliber variation and beading, as determined by a characteristic power law decay in the AD, Eq.(1), and previously validated in control WM and with realistic Monte Carlo simulations[3].Here, we employ time-dependent DTI in MS pathology, and report an increase in $$$D_\infty$$$ in MS lesions compared to NAWM, consistent with demyelination and axonal loss, and in agreement with previous DTI studies[10,11,12]. In addition, our results reveal for the first time that the AD time-dependence, i.e. $$$c$$$ in Eq.(1), is smaller in MS lesions compared to NAWM. This observation potentially indicates an increase in mitochondria density[9], as detailed in $$$\textit{Results}$$$ and Fig. 3.
Empirical MRI, including DTI and $$$T_2$$$, has been shown sensitive to both demyelination, axonal loss and mitochondria density changes. Here, we show that time-dependent DTI combined with biophysical modeling allows us to disentangle between these pathological processes, whereby the parameter $$$c$$$ specifically points to axonal beading and mitochondrial dysfunction in MS, and $$$D_\infty$$$ points to axonal degeneration and loss.
This gain in pathological specificity prompts to study time-dependent DTI for axonal beading in WM of MS[13], as well as traumatic brain injury[14,15], and stroke[16]. Furthermore, Eq.(1) and its equivalence have been observed in gray matter[4,17,18], warranting studying DTI time-dependence in neurodegenerative disorders including Alzheimer's[19], Parkinson's[20] and schizophrenia[21].
Acknowledgements
We would like to thank Thorsten Feiweier for developing advanced diffusion WIP sequence. Research was supported by the National Institute of Neurological Disorders and Stroke of the NIH under award number R01 NS088040 and R21 NS081230, and was performed at the Center of Advanced Imaging Innovation and Research (CAI2R, www.cai2r.net), an NIBIB Biomedical Technology Resource Center (NIH P41 EB017183).References
[1] Goldenberg, M. M. (2012). Multiple sclerosis review. Pharmacy and Therapeutics, 37(3), 175.
[2] Paul, A., Comabella, M. and Gandhi, R. (2019). Biomarkers inmultiple sclerosis. Cold Spring Harbor Perspectives in Medicine, 9(3). doi:10.1101/cshperspect.a029058
[3] Lee, H. H., Papaioannou, A., Kim, S. L., Novikov, D. S., & Fieremans, E. (2019). Probing axonal swelling with time dependent diffusion MRI. arXiv preprint arXiv:1907.12685.
[4] Novikov, D. S., Jensen, J. H., Helpern, J. A., & Fieremans, E. (2014). Revealing mesoscopic structural universality with diffusion. Proceedings of the National Academy of Sciences, 111(14), 5088-5093.
[5] Fieremans, E., Burcaw, L. M., Lee, H. H., Lemberskiy, G., Veraart, J., & Novikov, D. S. (2016). In vivo observation and biophysical interpretation of time-dependent diffusion in human white matter. NeuroImage, 129, 414-427.
[6] Ades-Aron, B., Veraart, J., Kochunov, P., McGuire, S., Sherman, P., Kellner, E., ... & Fieremans, E. (2018). Evaluation of the accuracy and precision of the diffusion parameter EStImation with Gibbs and NoisE removal pipeline. NeuroImage, 183, 532-543.
[7] Moll, N. M., Rietsch, A. M., Thomas, S., Ransohoff, A. J., Lee, J. C., Fox, R., ... & Fisher, E. (2011). Multiple sclerosis normal‐appearing white matter: Pathology–imaging correlations. Annals of neurology, 70(5), 764-773.
[8] Wang, L., Dong, J., Cull, G., Fortune, B., & Cioffi, G. A. (2003). Varicosities of intraretinal ganglion cell axons in human and nonhuman primates. Investigative ophthalmology & visual science, 44(1), 2-9.
[9] Witte, M. E., Mahad, D. J., Lassmann, H., & van Horssen, J. (2014). Mitochondrial dysfunction contributes to neurodegeneration in multiple sclerosis. Trends in molecular medicine, 20(3), 179-187.
[10] Werring, D. J., Clark, C. A., Barker, G. J., Thompson, A. J., & Miller, D. H. (1999). Diffusion tensor imaging of lesions and normal-appearing white matter in multiple sclerosis. Neurology, 52(8), 1626-1626.
[11] Guo, A. C., Jewells, V. L., & Provenzale, J. M. (2001). Analysis of normal-appearing white matter in multiple sclerosis: comparison of diffusion tensor MR imaging and magnetization transfer imaging. American journal of neuroradiology, 22(10), 1893-1900.
[12] Mustafi, S. M., Harezlak, J., Kodiweera, C., Randolph, J. S., Ford, J. C., Wishart, H. A., & Wu, Y. C. (2019). Detecting white matter alterations in multiple sclerosis using advanced diffusion magnetic resonance imaging. Neural regeneration research, 14(1), 114.
[13] Trapp, B. D., Peterson, J., Ransohoff, R. M., Rudick, R., Mörk, S., & Bö, L. (1998). Axonal transection in the lesions of multiple sclerosis. New England Journal of Medicine, 338(5), 278-285.
[14] Johnson, V. E., Stewart, W., & Smith, D. H. (2013). Axonal pathology in traumatic brain injury. Experimental neurology, 246, 35-43.
[15] Tang-Schomer, M. D., Johnson, V. E., Baas, P. W., Stewart, W., & Smith, D. H. (2012). Partial interruption of axonal transport due to microtubule breakage accounts for the formation of periodic varicosities after traumatic axonal injury. Experimental neurology, 233(1), 364-372.
[16] Garthwaite, G., Brown, G., Batchelor, A. M., Goodwin, D. A., & Garthwaite, J. (1999). Mechanisms of ischaemic damage to central white matter axons: a quantitative histological analysis using rat optic nerve. Neuroscience, 94(4), 1219-1230.
[17] Does, M. D., Parsons, E. C., & Gore, J. C. (2003). Oscillating gradient measurements of water diffusion in normal and globally ischemic rat brain. Magnetic Resonance in Medicine: An Official Journal of the International Society for Magnetic Resonance in Medicine, 49(2), 206-215.
[18] Papaioannou, A., Novikov, D. S., & Fieremans, E. (2017). In vivo observation and interpretation of time dependent diffusion in human gray matter. Proceedings of ISMRM, 25, 0723.
[19] Ikonomovic, M. D., Abrahamson, E. E., Isanski, B. A., Wuu, J., Mufson, E. J., & DeKosky, S. T. (2007). Superior frontal cortex cholinergic axon density in mild cognitive impairment and early Alzheimer disease. Archives of neurology, 64(9), 1312-1317.
[20] Finkelstein, D. I., Stanic, D., Parish, C. L., Tomas, D., Dickson, K., & Horne, M. K. (2000). Axonal sprouting following lesions of the rat substantia nigra. Neuroscience, 97(1), 99-112.
[21] Glantz, L. A., & Lewis, D. A. (2000). Decreased dendritic spine density on prefrontal cortical pyramidal neurons in schizophrenia. Archives of general psychiatry, 57(1), 65-73.
Figures