0722
High-Resolution Neural Soma Imaging with FLAIR: Eliminating CSF Contamination in Grey Matter1Centre for Medical Image Computing, University College London, London, United Kingdom, 2Great Ormond Street Institute of Child Health, University College London, London, United Kingdom, 3Siemens Healthcare Ltd, Frimley, United Kingdom
Synopsis
In-vivo microstructure imaging in cortical grey matter is limited by low imaging resolution and signal contamination from CSF. In this work, we use FLAIR to eliminate free water signal in the brain, and thus enhance sensitivity to microscopic tissue architecture in the cortex. We present the advantage of CSF suppression in Neural Soma Imaging, a state-of-the-art diffusion technique that focuses on the salient features of grey matter. We show high-resolution maps (1.5 mm isotropic) of neural tissue microstructure and T1- and T2-relaxation times, and demonstrate that neural projection density estimates are significantly higher when the CSF signal is eliminated.
Introduction
Accurately imaging the microscopic architecture of grey matter in-vivo in the brain is imperative for the diagnosis and assessment of numerous neurodevelopmental and neurodegenerative disorders. However, in the past, mapping cellular structure in grey matter has been hindered by low diffusion imaging resolution, lack of biophysical models appropriate for grey matter, and the low sensitivity of conventional diffusion measurements. These limitations are particularly apparent in the cerebral cortex, where the diffusion signal is confounded by cerebrospinal fluid (CSF)1.In this work, we show that different T1- and T2-relaxation times in CSF and tissue may lead to significant misestimation of microscopic tissue parameters in grey matter. To overcome this problem, we combine B-tensor encoding2-6 with fluid-attenuated inversion recovery (FLAIR), using 1.5 mm isotropic voxels, and map neural tissue in-vivo in the human brain without signal contamination from CSF.
We demonstrate the advantage of CSF suppression in Neural Soma Imaging7, a novel microstructure imaging technique that disentangles quasi-spherical cellular structures associated with neural soma from quasi-cylindrical structures associated with neural projections such as axons, dendrites and glial processes. By making additional MRI measurements at different echo times and inversion times, we also estimate T1- and T2-relaxation, and CSF volume fraction in the same subject. Our high-resolution maps of neural tissue microstructure suggest that eliminating the CSF signal may be essential for the accurate estimation of cellular content in cortical grey matter.
Methods
Data AcquisitionWe developed a custom diffusion-weighted EPI sequence that enables measurements with arbitrary gradient waveforms. After informed written consent, a healthy volunteer was scanned three times on a 3T Siemens Prisma scanner using a 64-channel head coil and our bespoke sequence. In the first scan, we used FLAIR to suppress CSF with TI = 2.5 s, and in the second scan no inversion recovery was used. All other measurement parameters were identical for these two scans, including 1.5 mm isotropic resolution over 80 slices, TE = 89 ms and TR = 23.4 s, planar tensor encoding (PTE) waveforms measured with b-values of [0, 500, 1000, 1500, 2000] s/mm2, and linear tensor encoding (LTE) waveforms measured with b-values of [0, 1000, 2000, 3500, 5000] s/mm2. PTE was designed using Maxwell-compensated optimisation8,9 and LTE was made using symmetric trapezoidal pulses. In the third scan, we acquired three b0 images without FLAIR with TE = [45, 89, 155] ms, and four b0 images with FLAIR with TE = [89, 89, 51, 89] ms and TI = [0.5, 1, 2.5, 2.5] s. All seven b0 images were acquired with 1.5 mm isotropic resolution and TR = 26.9 s. In addition, we also acquired a 3D T1-weighted MPRAGE with 1 mm isotropic resolution, which we segmented using FreeSurfer10.
Neural Soma Imaging
To capture the salient features of grey matter, we use a three-compartment biophysical model that consists of quasi-spherical structures associated with neural soma, quasi-cylindrical structures associated with neural projections such as axons, dendrites and glial processes, and the surrounding extra-cellular volume7,11. We disentangle these geometries in-vivo in the human brain using B-tensor encoding, which is achievable in clinical settings. In particular, this work combines LTE and PTE acquisitions that facilitate low TE and high-resolution measurements. The orientation dependence of the signal is factored out by computing the powder average of uniformly distributed gradient directions. To recover model parameters in a fast and robust way, we train a 3-layer fully connected neural network with synthesised data7.
Results and Discussion
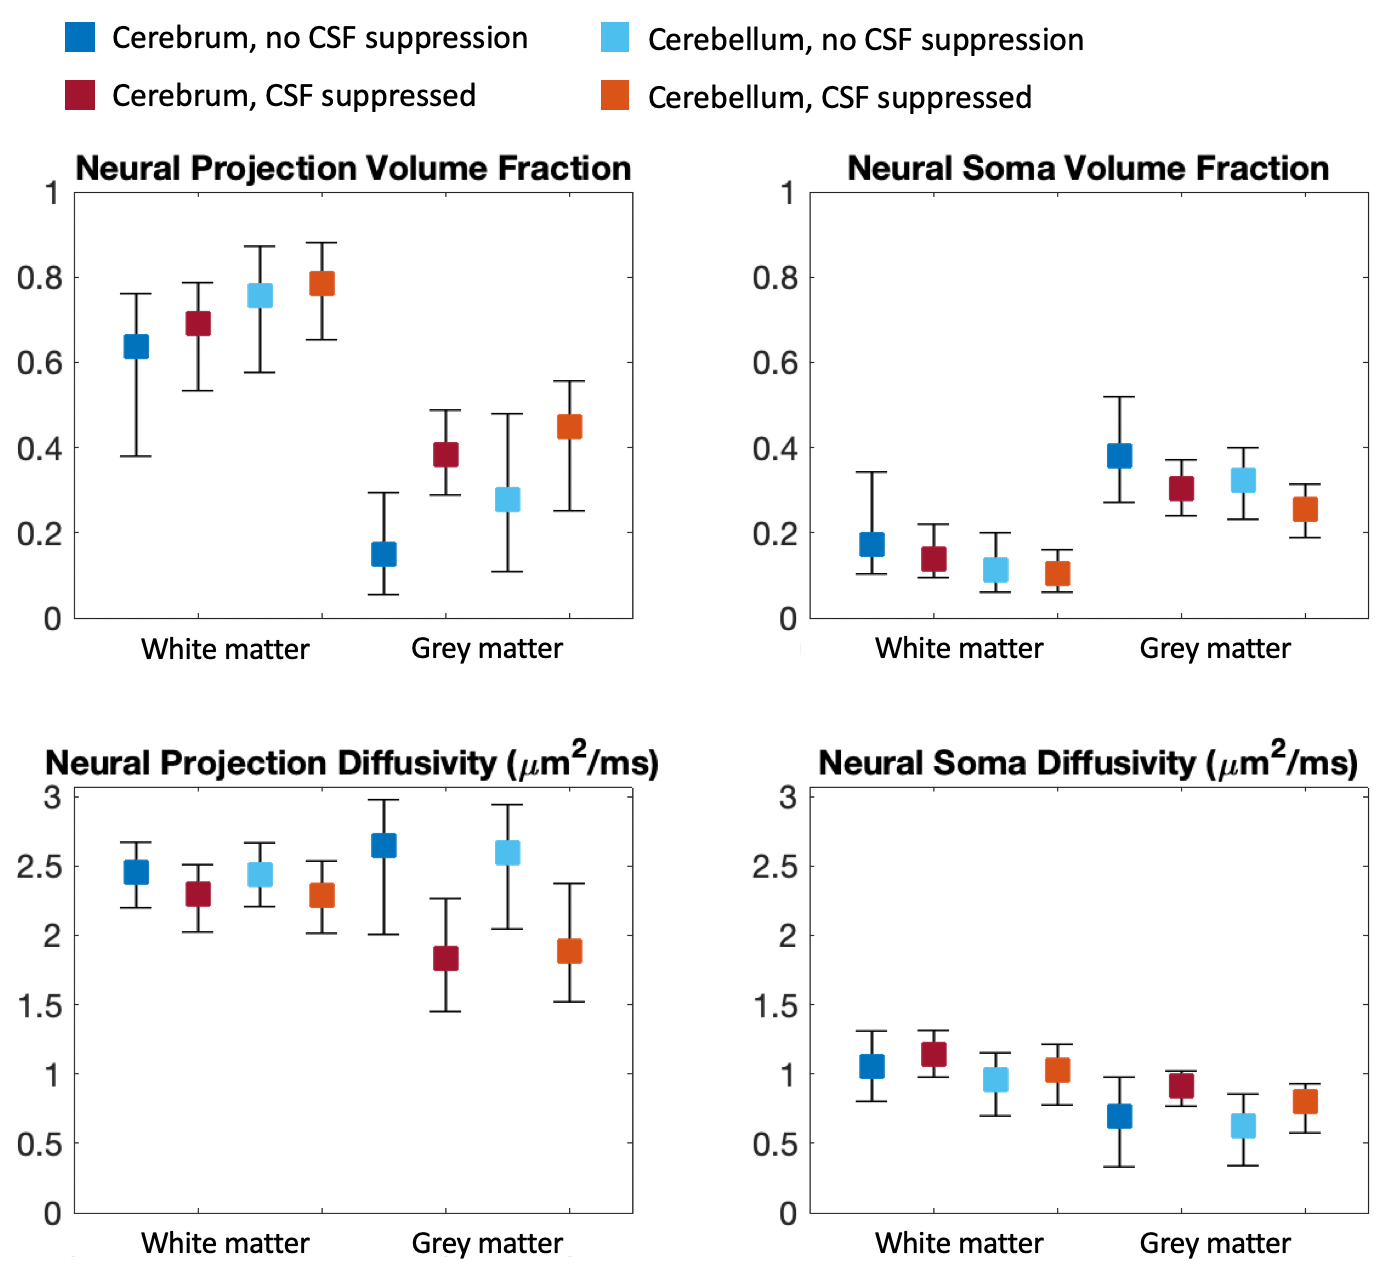
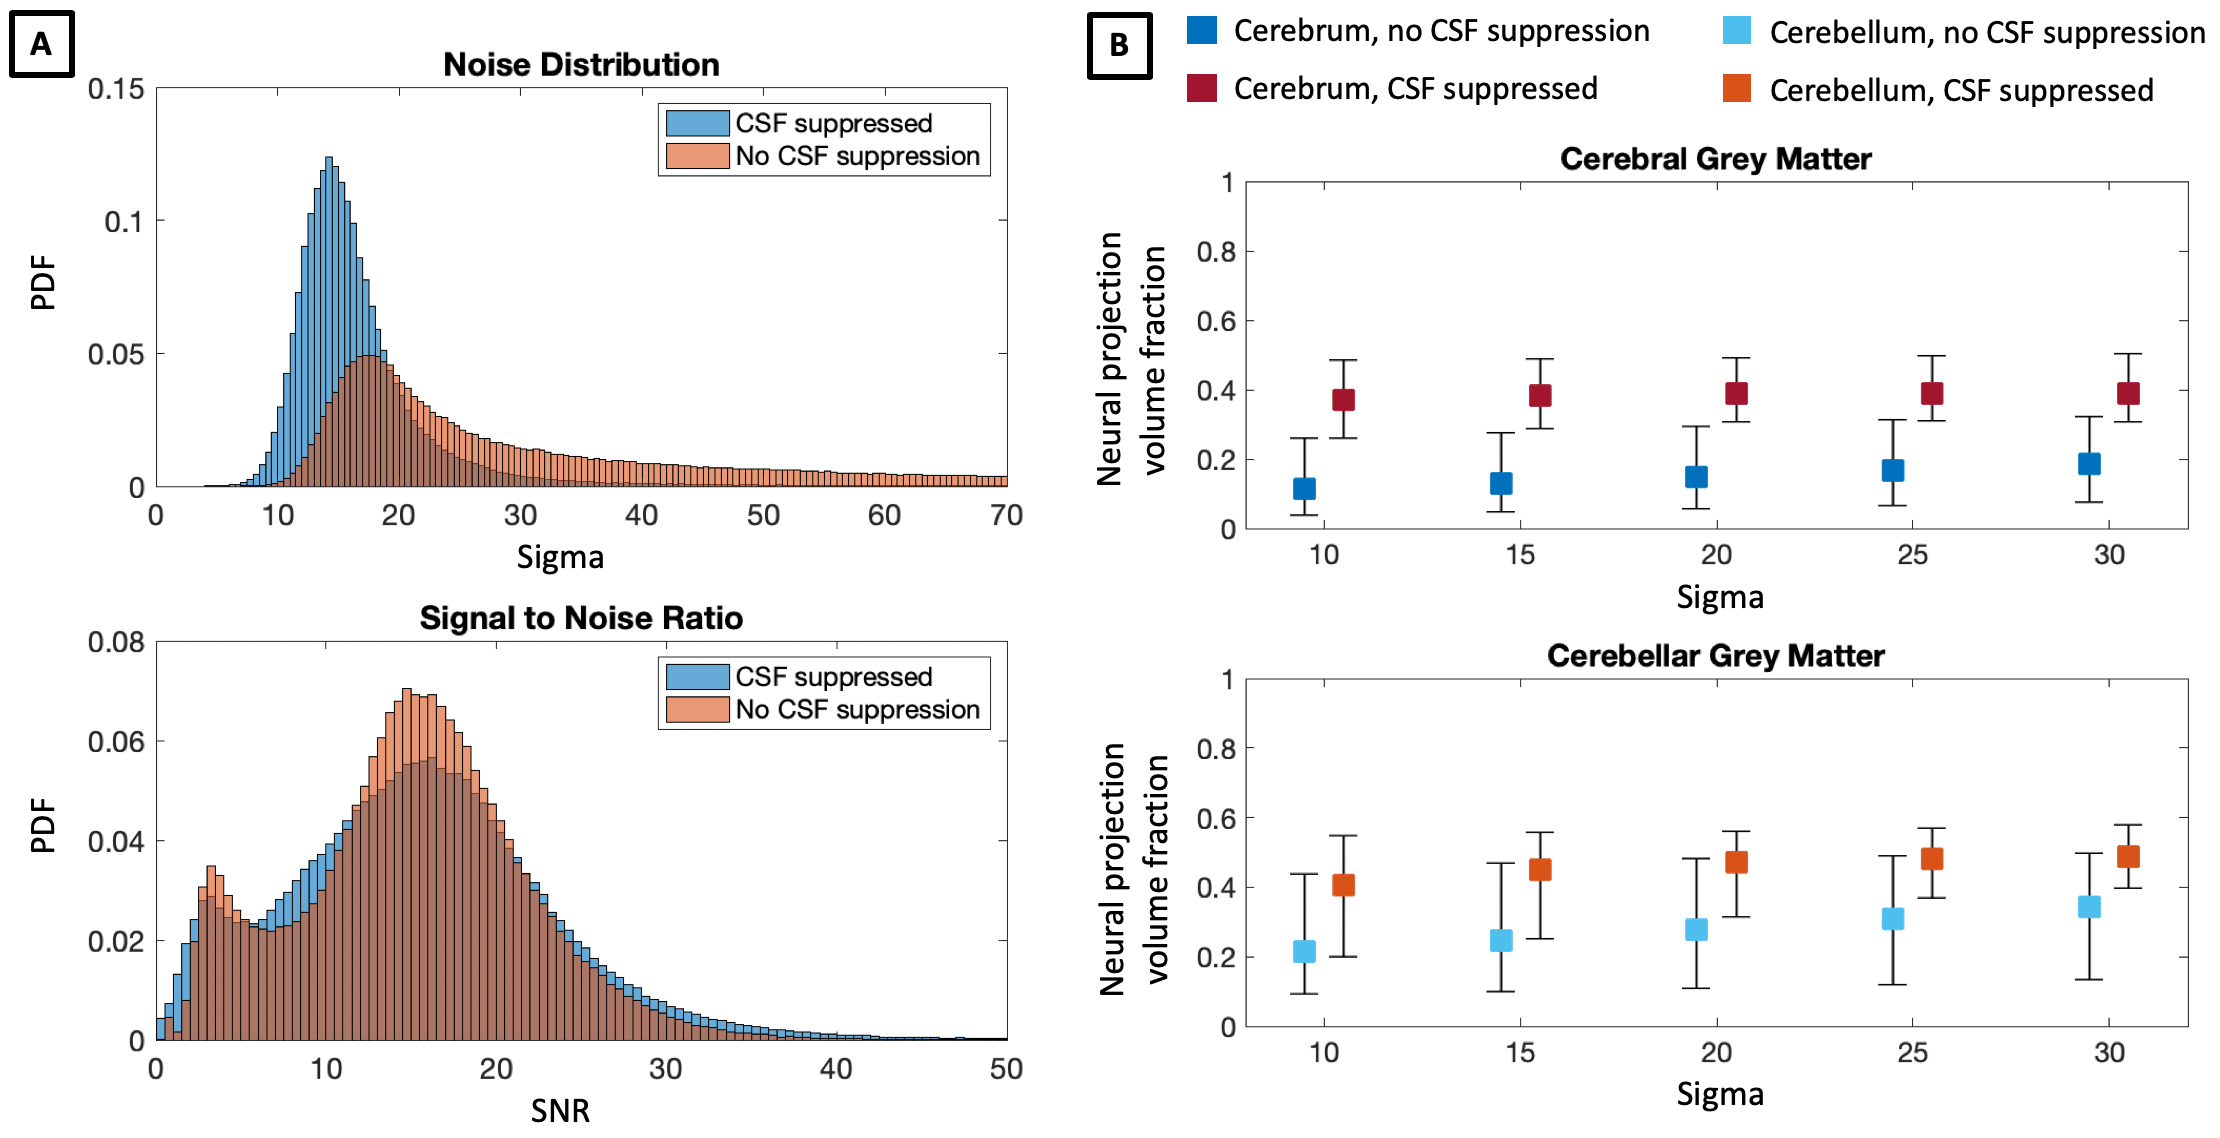
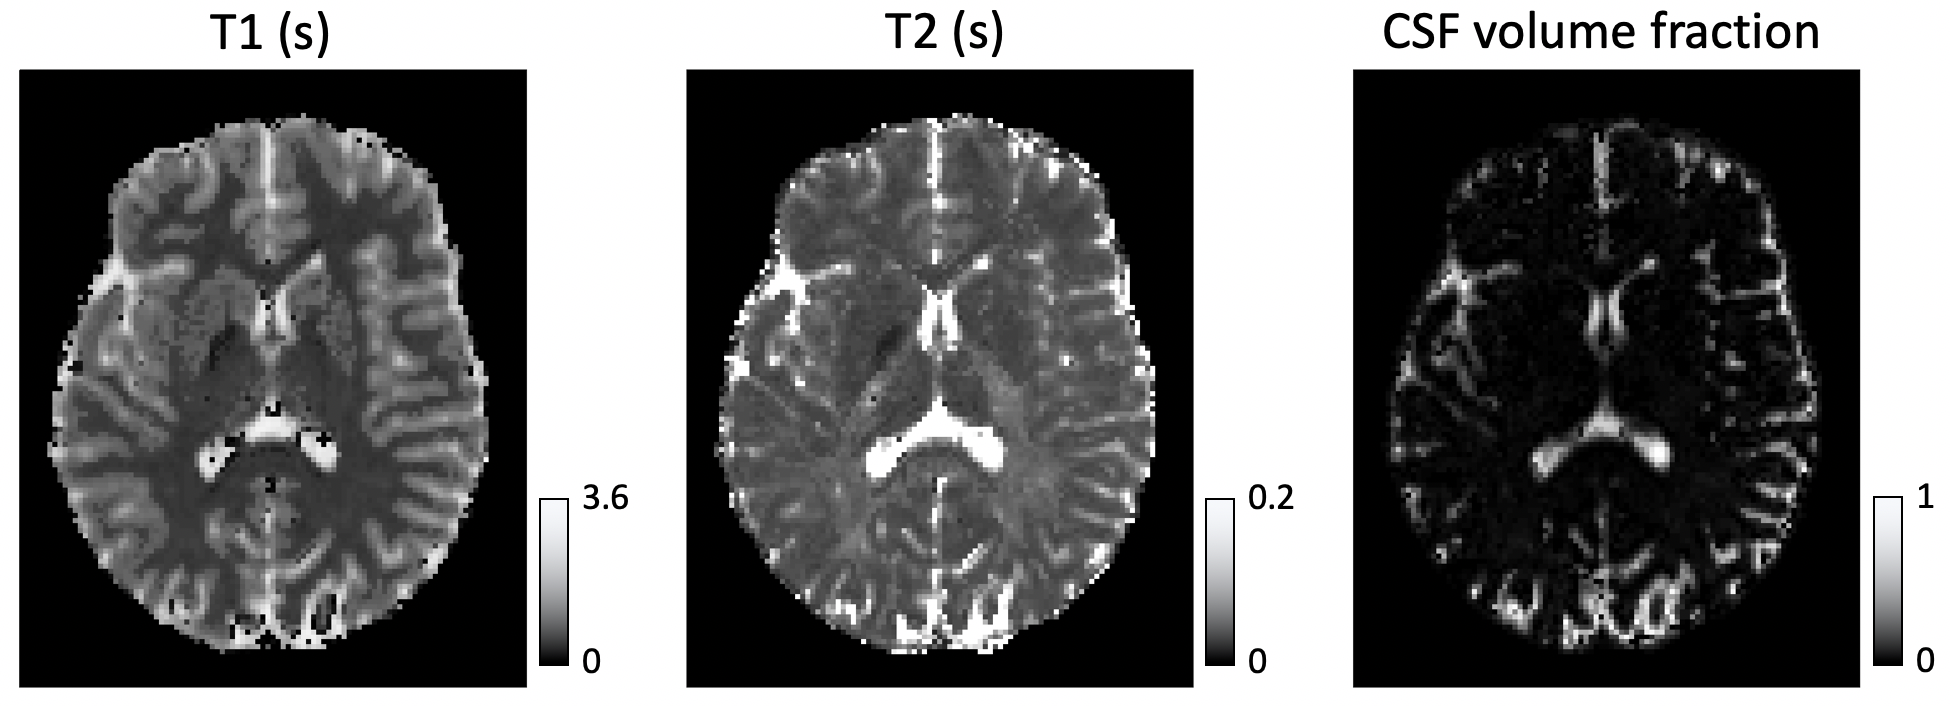
In Figure 1, we compare diffusion-weighted data with and without FLAIR, and show that fractional anisotropy (FA) estimates are higher in grey matter when CSF is suppressed. We then use Neural Soma Imaging to map markers of neural projections, neural soma, and extra-cellular space independently for the two data sets. Maps in Figure 2 and regional averages in Figure 3 show that estimates of neural projection volume fractions are markedly higher in grey matter when the CSF signal is eliminated. We demonstrate that this result is not due to different noise distributions in the two acquisitions in Figure 4. As neural projection volume fraction is typically underestimated in the cortex1, our results suggest that there may be significant advantage in using FLAIR for grey matter imaging. Finally, in Figure 5 we use b0 images with variable inversion and echo times to recover T1 and T2 estimates as well as the CSF volume fraction for the same subject.Conclusion
In this work we highlight the necessity of CSF suppression for microstructure imaging in the brain. We demonstrate that neural projection volume fraction estimates are significantly higher in cortical grey matter when CSF is suppressed compared to measurements without FLAIR, due to long T1- and T2-relaxation in free water. Our results are in closer agreement with high neurite density estimates obtained in histological measurements12, and hence we propose that eliminating CSF is essential for accurate estimation of cellular content in neural tissue. FLAIR microstructure imaging may be particularly integral for neurological disorders that disrupt cell morphology in cortical grey matter, such as in focal cortical dysplasia13. With the addition of multiband EPI acceleration, this high-resolution technique could be used in clinical settings with scan times of approximately 20 minutes.Acknowledgements
NGG thanks the London Interdisciplinary Bioscience PhD Consortium. This research was funded by UK BBSRC BB/M009513/1, EPSRC EP/M020533/1, EP/N018702/1 and EU H2020 634541-2, and was supported by the NIHR Great Ormond Street Hospital Biomedical Research Centre and the NIHR UCLH Biomedical Research Centre.References
[1] Jespersen, S. N., Bjarkam, C. R., Nyengaard, J. R., Chakravarty, M. M., Hansen, B., Vosegaard, T., Ostergaard, L., Yablonskiy, D., Nielsen, N. C., Vestergaard-Poulsen, P. (2010) Neurite density from magnetic resonance diffusion measurements at ultrahigh field: comparison with light microscopy and electron microscopy”. Neuroimage 49.1, pp. 205–216.
[2] Eriksson, S., Lasic, S., Topgaard, D. (2013) Isotropic diffusion weighting in PGSE NMR by magic-angle spinning of the q-vector. Journal of Magnetic Resonance 226, pp. 13–18.
[3] Lasic, S, Szczepankiewicz, F., Eriksson, S., Nilsson, M., Topgaard, D. (2014) Microanisotropy imaging: quantification of microscopic diffusion anisotropy and orientational order parameter by diffusion MRI with magic-angle spinning of the q-vector. Frontiers in Physics 2.11, pp. 1–14.
[4] Eriksson, S., Lasic, S., Nilsson, M., Westin, C.-F., Topgaard, D. (2015) NMR diffusion encoding with axial symmetry and variable anisotropy: distinguishing between prolate and oblate microscopic diffusion tensors with unknown orientation distribution. The Journal of Chemical Physics 142.10, p. 104201.
[5] Westin, C.-F., Knutsson, H., Pasternak, O., Szczepankiewicz, F., Ozarslan, E., van Westen, D., Mattisson, C., Bogren, M., O’Donnell, L. J., Kubicki, M., Topgaard, D., Nilsson, M. (2016) Q-space trajectory imaging for multidimensional diffusion MRI of the human brain. Neuroimage 135, pp. 342–362.
[6] Topgaard, D. (2017) Multidimensional diffusion MRI. Journal of Magnetic Resonance 275, pp. 98–113.
[7] Gyori, N. G., Clark, C. A., Dragonu, I., Alexander, D. C., Kaden, E. (2019) In-vivo neural soma imaging using B-tensor encoding and deep learning. In Proceedings of the ISMRM, #0059.
[8] Sjolund, J., Szczepankiewicz, F., Nilsson, M., Topgaard, D., Westin, C.-F., Knutsson, H. (2015) Constrained optimization of gradient waveforms for generalized diffusion encoding. Journal of Magnetic Resonance 261, pp. 157–168.
[9] Szczepankiewicz, F., Westin, C.-F., Nilsson, M. (2019) Maxwell-compensated designof asymmetric gradient waveforms for tensor-valued diffusion encoding. MagneticResonance in Medicine 82.4, pp. 1424–1437.
[10] Fischl, B. (2012) FreeSurfer. Neuroimage 62.2, pp. 774–781.
[11] Palombo, M., Ianus, A., Nunes, D., Guerreri, M., Alexander, D. C., Shemesh, N., Zhang, H. (2019) SANDI: a compartment-based model for non-invasive apparent soma and neurite imaging by diffusion MRI. ArXiv: 1907.02832.
[12] Braitenberg, V., Schuz A. (2013) Cortex: Statistics and Geometry of Neuronal Connectivity. Berlin: Springer-Verlag.
[13] Adler, S., Lorio, S., Jacques, T. S., Benova, B., Gunny, R., Cross, J. H., Baldeweg, T., Carmichael, D. W. (2017) Towards in vivo focal cortical dysplasia phenotyping using quantitative MRI. Neuroimage: Clinical 15, pp. 95–105.
[14] Whittall, K. P., MacKay, A. L., Graeb, D. A., Nugent, R. A., Li, D. K. B., Paty, D. W. (1997) In vivo measurements of T2 distributions and water contents in normal human brain. Magnetic Resonance in Medicine 37.1, pp. 34–43.
Figures