0721
Accuracy and precision of microscopy anisotropy estimation using q-space trajectory encoding - a model comparison study1UCL Great Ormond Street Institute of Child Health, University College London, London, United Kingdom, 2Centre for Medical Image Computing, University College London, London, United Kingdom, 3Bioxydyn Limited, Manchester, United Kingdom, 4CRUK and EPSRC Cancer Imaging Centre in Cambridge and Manchester, Manchester, United Kingdom, 5Department of Radiology, Brigham and Women’s Hospital, Boston, MA, United States, 6Harvard Medical School, Boston, MA, United States, 7Medical Radiation Physics, Clinical Sciences Lund, Lund University, Lund, Sweden, 8National Physical Laboratory, Teddington, United Kingdom
Synopsis
Estimation of microscopic fractional anisotropy (μFA) using multidimensional diffusion MRI is a promising novel method for characterising clinically relevant microstructural properties of neural tissue. In this study, three commonly used methods for calculating μFA were compared by imaging a fibre phantom and healthy volunteers. Statistically significant differences were observed in accuracy and precision of the μFA estimates calculated using the covariance tensor model, the gamma distributed diffusivities model, and the direct regression approach. The differences between the methods have to be carefully considered when this promising new metric is applied in characterising microstructural properties of tissue or pathologies.
Introduction
Recently, multidimensional diffusion encoding (MDE) methods1–3 have become increasingly popular and several methods for calculating microscopic fractional anisotropy (μFA) from MDE data have been proposed4–6. However, to our knowledge, the differences between the methods have not been exhaustively studied. In this study, we imaged a fibre phantom and volunteers to compare three commonly used methods for calculating μFA: direct regression5, gamma model5, and covariance tensor model7.Methods
μFA estimation1) Direct regression approach explicitly represents μFA's dependence on the powder-averaged data acquired with linear and spherical b-tensors5:
$$\mu FA=\sqrt{\frac{3}{2}}\left(1+\frac{2}{5}\frac{1}{\Delta \tilde{\mu}_2}\right )^{-\frac{1}{2}}(Eq.1)$$
where $$$\Delta \tilde{\mu}_2$$$ was obtained by regressing
$$\Delta \tilde{\mu}_2=\text{ln}\left(\frac{S_{LTE}}{S_{STE}}\right)2(\text{MD})^{-2} b^{-2}(Eq.2)$$
with a non-linear least squares fit over powder-averaged data acquired with linear and spherical b-tensors ($$$S_{LTE}$$$,$$$S_{STE}$$$) with b as the regressor. Mean diffusivity (MD) was derived from a DTI fit to LTE data using DiPy8.
2) The gamma model assumes the distribution of microscopic diffusivities to follow a gamma distribution5. The model was fit to data acquired with linear and spherical b-tensors:
$$S=S_0\left(1+b\frac{\mu_2}{\text{MD}}\right )^{\frac{(\text{MD})^2}{\mu_2}}(Eq.3)$$
μFA was calculated according to equation 1 as specified in Lasič et al.3 using the MD-dMRI toolbox9.
3) In the covariance tensor model, tissue is represented by a distribution of Gaussian diffusion tensors $$$\textbf{D}$$$ and the second cumulant of the diffusion-weighted signal is represented by a fourth order covariance tensor. μFA was calculated as:
$$\mu FA=\sqrt{\frac{3}{2}\frac{<\langle\textbf{D}^{\otimes 2}\rangle,\mathbb{E}_{\text{shear}}>}{<\langle\textbf{D}^{\otimes2}\rangle,\mathbb{E}_{\text{iso}} >}}(Eq.4)$$
where $$$\langle\mathbf{D}^{\otimes 2}\rangle$$$ was estimated and $$$\mathbb{E}_{\text{shear}}$$$, $$$\mathbb{E}_{\text{iso}}$$$ defined as in Westin et al.6 using the MD-dMRI toolbox9.
With all the methods, μFA values greater than $$$(3/2)^{1/2}$$$ or less than $$$0$$$ were mapped to $$$(3/2)^{1/2}$$$ or $$$0$$$, respectively.
Volunteer experiments
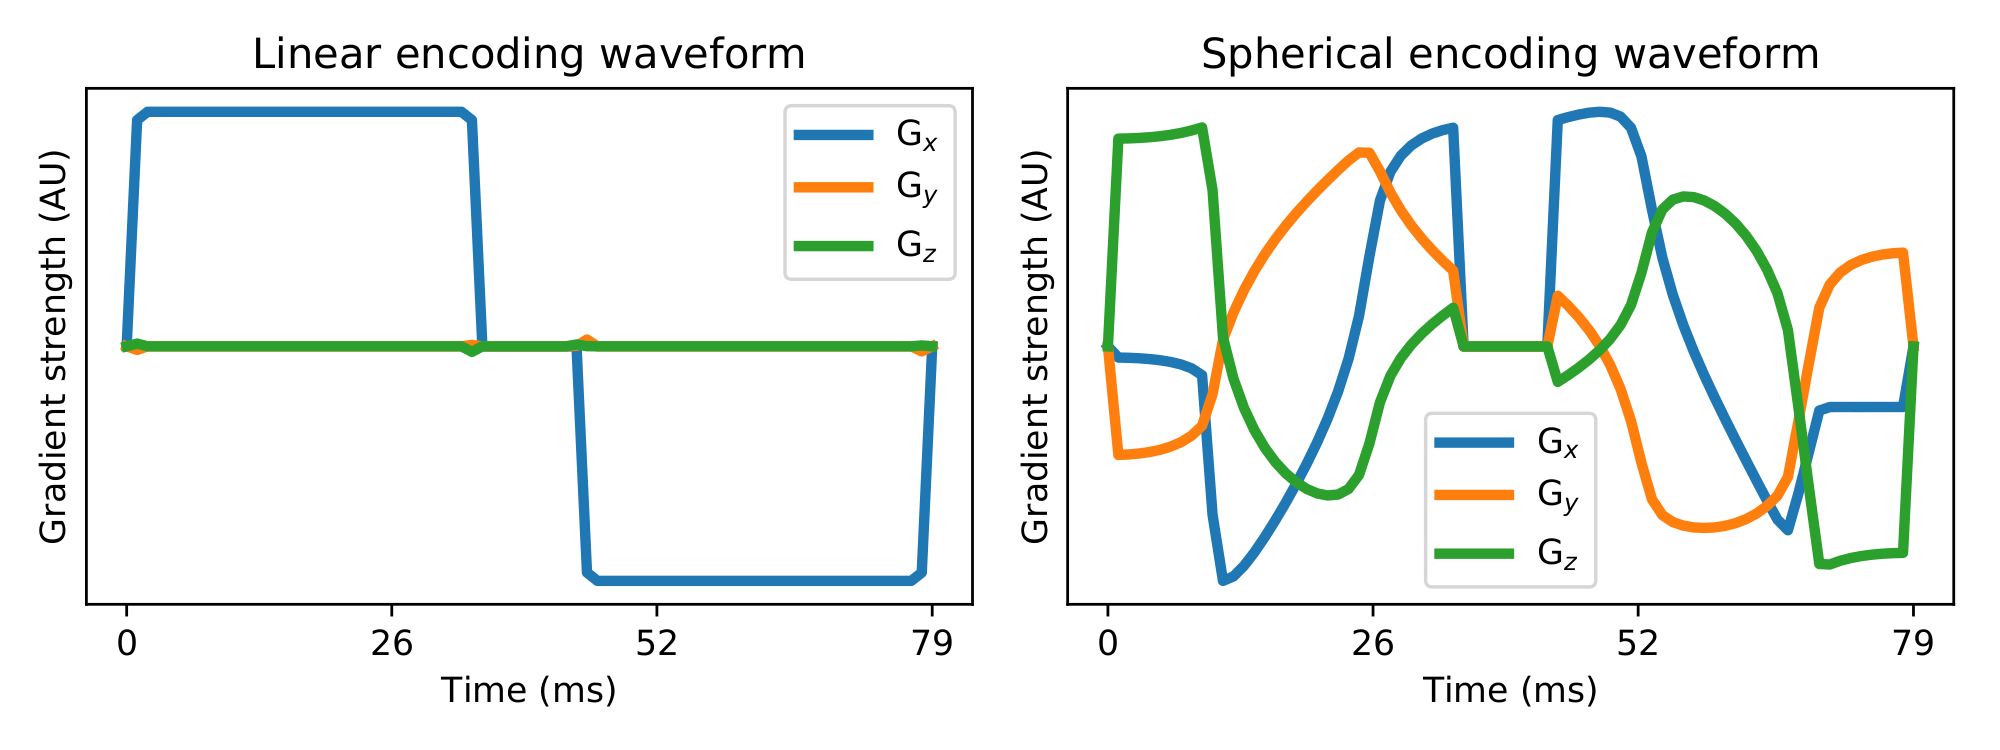
The brains of three healthy adult volunteers were imaged with optimised10 and Maxwell-compensated11 waveforms encoding linear and spherical b-tensors (Figure 1). 12 directions were used for b-values 100, 500, and 1000 s/mm2, and 32 directions were used for b-values 1500 and 2000 s/mm2. 11 b=0 images were acquired, TE=103 ms, voxel size=2x2x2 mm3, TR=10 s, FOV=256 x 256 mm2, 60 slices. Data pre-processing consisted of Marchenko-Pastur denoising12, Gibbs ringing reduction13, and susceptibility distortion correction14.
Phantom experiments
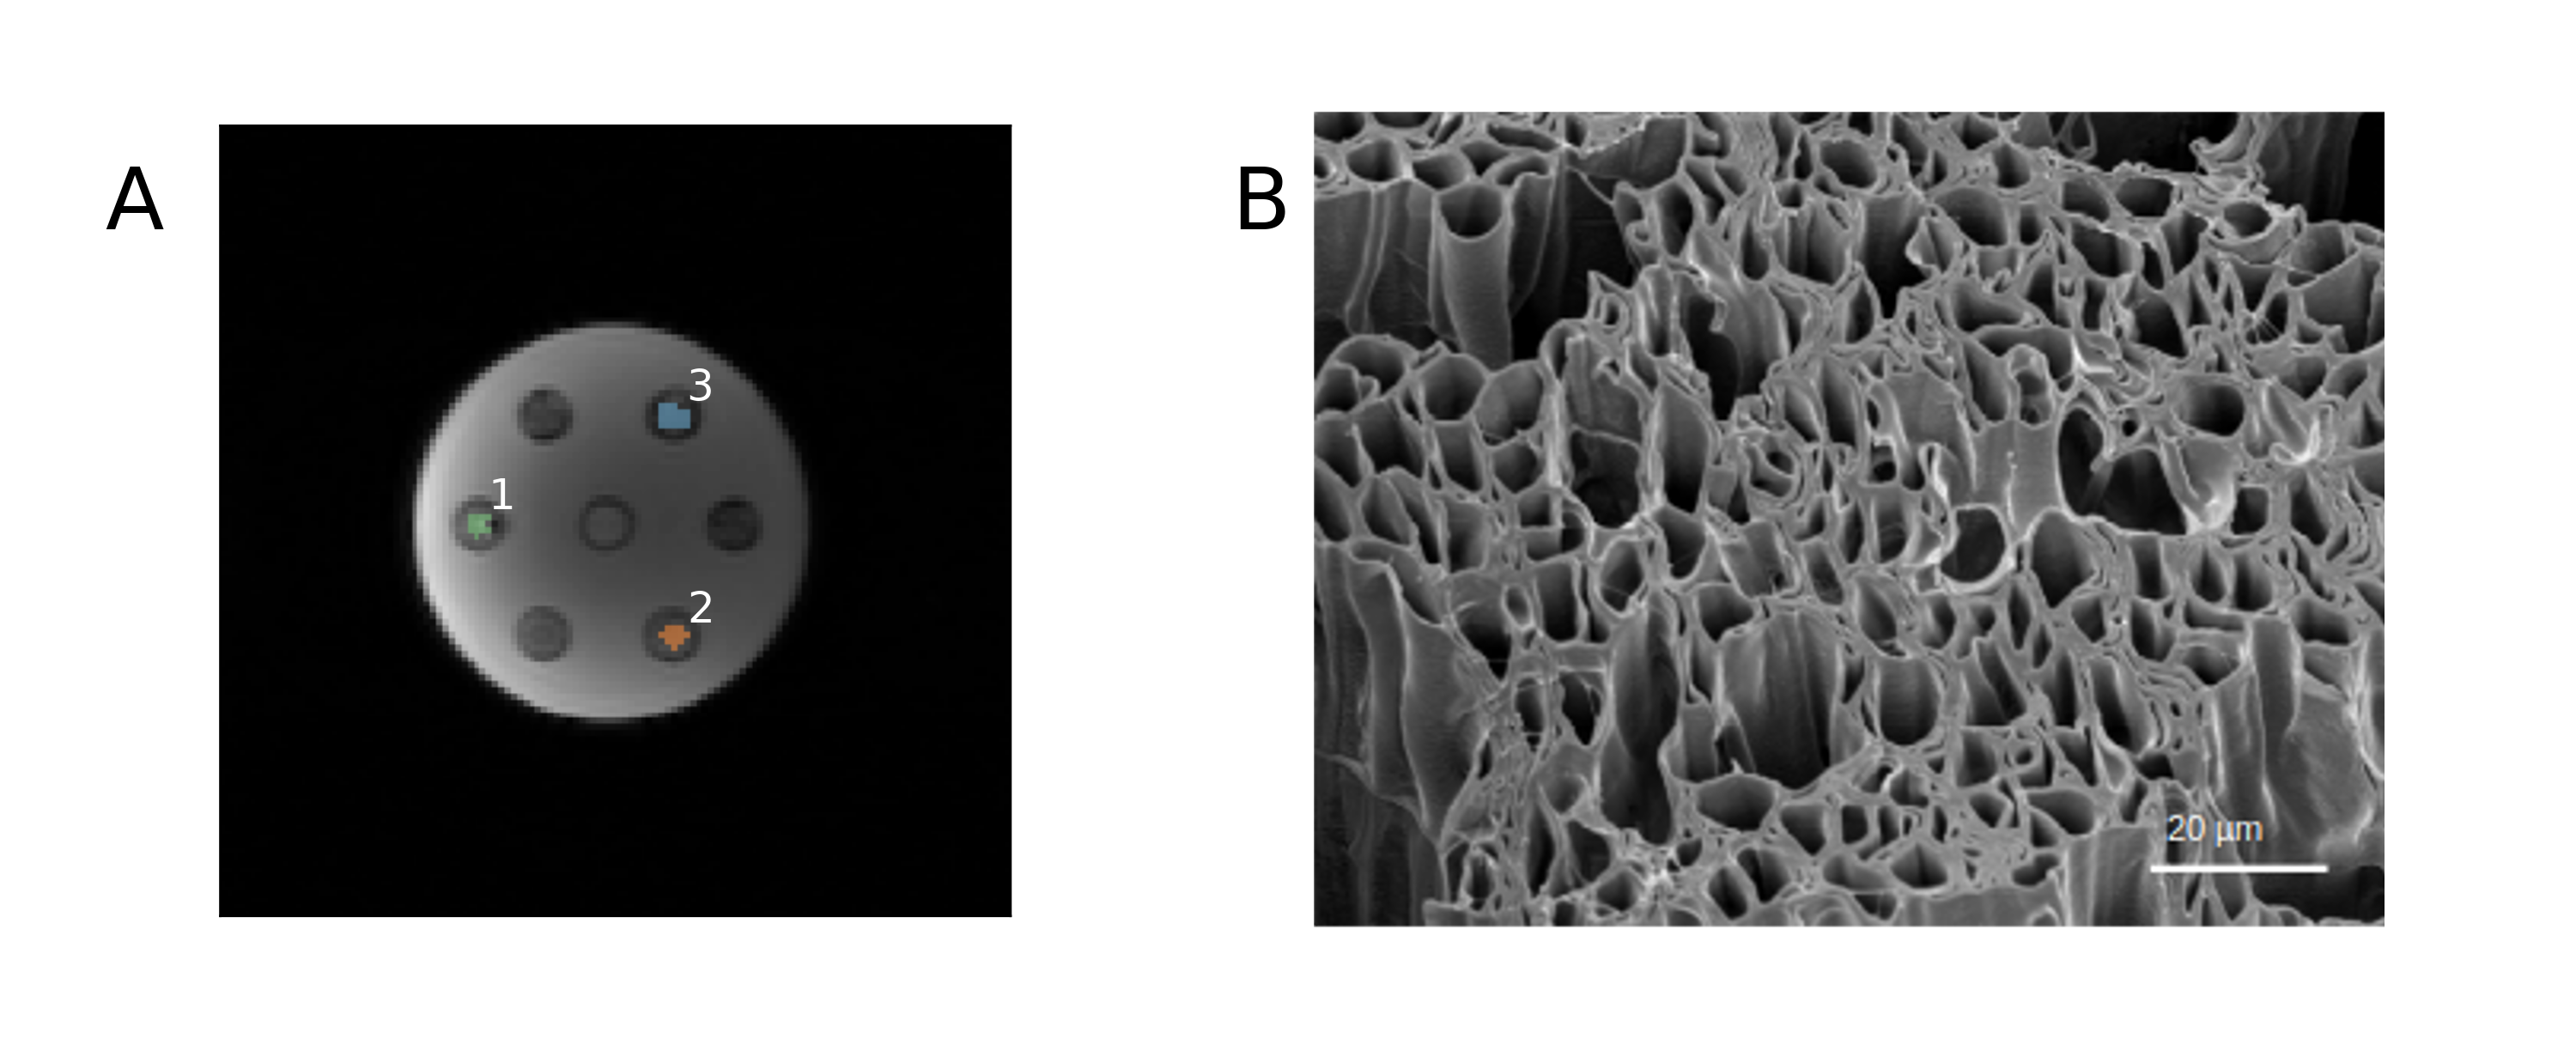
A phantom consisting of highly hydrophilic hollow polycaprolactone microfibres15 (r =10.0±0.2 μm) (Figure 2) was imaged with the same protocol as the volunteers except: 10 slices, TR=3 s, 11 repetitions. The phantom contained samples of parallel, perpendicularly crossing, and randomly oriented (in 2D) fibres. Rician noise was added to the data to artificially lower SNR. 100 repetitions of noise addition were performed and the effect of noise was quantified as the standard deviation of noisy μFA estimates in each voxel. Voxel-specific SNR was quantified as the mean signal divided by the standard deviation of the signal over the b=0 images.
All data was acquired using a prototype spin-echo sequence16 on a Siemens Magnetom Prisma 3.0 T with a maximum gradient strength of 80 mT/m, maximum slew rate of 200 T/m/s and a 64-channel quadrature head coil (Siemens Healthcare, Erlangen, Germany) at Great Ormond Street Hospital.
Results
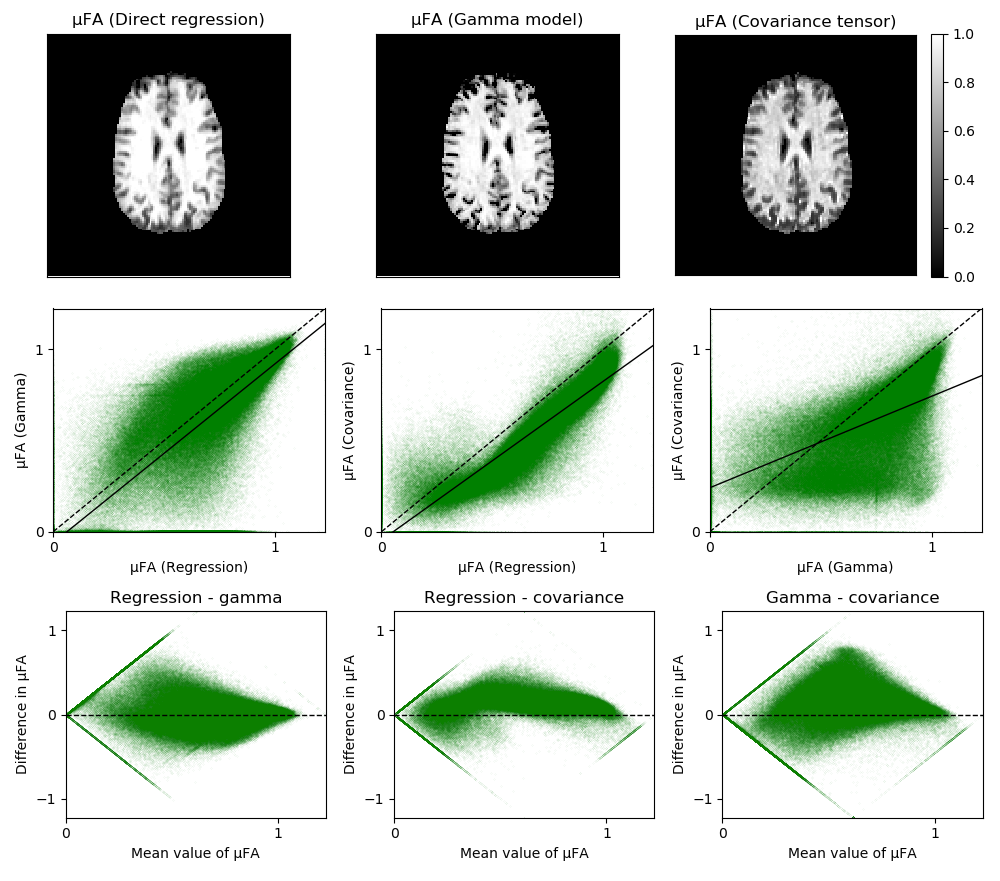
Volunteer experimentsThe results are illustrated in Figure 3. The maps reveal that the covariance tensor model results in lower values of μFA than the two other methods and that the gamma model results in numerous zeros near the cortical sulci that are not present in the other maps. The low precision of μFA can be observed in the large variance of μFA, which also exhibits heteroscedasticity. The scatter plots reveal that some noisy voxels map to biophysically meaningless values of μFA using one model but not necessarily another (Figure 3, bottom row).
Phantom experiments
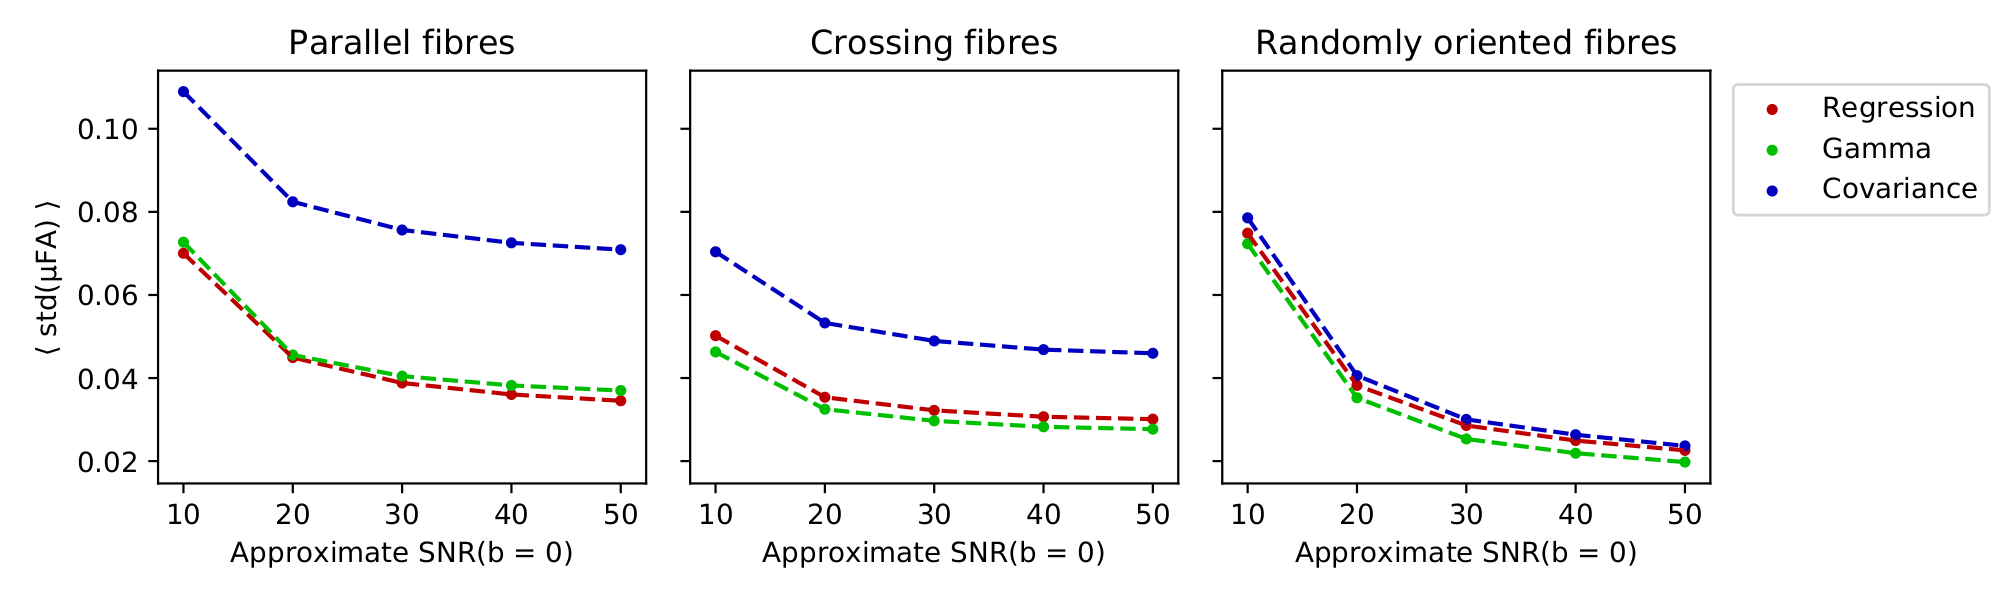
The μFA estimates were 0.93±0.03, 0.91±0.04, and 0.84±0.07 for parallel fibres, 0.92±0.02, 0.85±0.03, and 0.74±0.05 for crossing fibres, and 0.87±0.02, 0.78±0.02, and 0.62±0.02 for randomly oriented fibres using regression, gamma, and covariance methods, respectively. When comparing the distributions of μFA estimates pair-wise in each ROI using the Welch's t-test, the null hypothesis of identical means was rejected with p < 10-2 for every pair. The results of the noise addition experiments are shown in Figure 4. SNR of the non-diffusion-weighted data was approximately 80. Every methods’ noise robustness increases with orientation dispersion at SNR⩾30. The variance of noisy μFA estimates acquired with the covariance tensor model is higher than with the other two methods.
Discussion
This study highlights the large variance in μFA and illustrates how different models yield significantly different values of μFA when calculated from the same data. Thus, the differences between methods must be considered when applying this promising novel metric in a research or clinical context or when interpreting μFA values reported in literature. A limitation is that the fibre phantom used in the study exhibited only high microscopic anisotropy. This is important, as it has previously been reported that especially the precision of μFA is highly dependent on the underlying value of μFA5,16–18. In future work, a comprehensive comparison of methods over a wider range of μFA values and orientation dispersions should be performed in order to guide the use of μFA as a biomarker.Conclusion
Both accuracy and precision of μFA depend on the model used to calculate it. The differences between the models must be carefully considered when this promising method is applied in characterising tissue properties.Acknowledgements
This work is funded by the NIHR GOSH BRC. The views expressed are those of the authors and not necessarily those of the NHS, the NIHR or the Department of Health. This work was also supported by the National Institute for Health Research University College London Hospitals Biomedical Research Centre.References
1. Cory, D. G., Garroway, A. N. & Miller, J. B. Applications of spin transport as a probe of localgeometry. in American Chemical Society, Polymer Preprints, Division of Polymer Chemistry(μFA) using multidimensional diffusion MRI is a1990).
2. Topgaard, D. Multidimensional diffusion MRI. J. Magn. Reson. (μFA) using multidimensional diffusion MRI is a2017)doi:10.1016/j.jmr.2016.12.007.
3. Shemesh, N. et al. Conventions and nomenclature for double diffusion encoding NMR andMRI. Magnetic Resonance in Medicine (μFA) using multidimensional diffusion MRI is a2016) doi:10.1002/mrm.25901.
4. Lawrenz, M., Koch, M. A. & Finsterbusch, J. A tensor model and measures of microscopicanisotropy for double-wave-vector diffusion-weighting experiments with long mixing times.J. Magn. Reson. (μFA) using multidimensional diffusion MRI is a2010) doi:10.1016/j.jmr.2009.09.015.
5. Lasič, S., Szczepankiewicz, F., Eriksson, S., Nilsson, M. & Topgaard, D. Microanisotropyimaging: quantification of microscopic diffusion anisotropy and orientational orderparameter by diffusion MRI with magic-angle spinning of the q-vector. Front. Phys. 2, 11(μFA) using multidimensional diffusion MRI is a2014).
6. Jespersen, S. N., Lundell, H., Sønderby, C. K. & Dyrby, T. B. Orientationally invariantmetrics of apparent compartment eccentricity from double pulsed field gradient diffusionexperiments. NMR Biomed. (μFA) using multidimensional diffusion MRI is a2013) doi:10.1002/nbm.2999.
7. Westin, C. F. et al. Q-space trajectory imaging for multidimensional diffusion MRI of thehuman brain. Neuroimage (μFA) using multidimensional diffusion MRI is a2016) doi:10.1016/j.neuroimage.2016.02.039.
8. Garyfallidis, E. et al. Dipy, a library for the analysis of diffusion MRI data. Front.Neuroinform. (μFA) using multidimensional diffusion MRI is a2014) doi:10.3389/fninf.2014.00008.
9. Nilsson, M. et al. An open-source framework for analysis of multidimensional diffusion MRIdata implemented in MATLAB. in Intl. Soc. Mag. Reson. Med vol. 26 16–19 (μFA) using multidimensional diffusion MRI is a2018). https://github.com/markus-nilsson/md-dmri
10. Sjölund, J. et al. Constrained optimization of gradient waveforms for generalized diffusionencoding. J. Magn. Reson. 261, 157–168 (μFA) using multidimensional diffusion MRI is a2015).
11. Szczepankiewicz, F., Westin, C. F. & Nilsson, M. Maxwell-compensated design ofasymmetric gradient waveforms for tensor-valued diffusion encoding. Magn. Reson. Med.(μFA) using multidimensional diffusion MRI is a2019) doi:10.1002/mrm.27828.
12. Veraart, J. et al. Denoising of diffusion MRI using random matrix theory. Neuroimage (μFA) using multidimensional diffusion MRI is a2016) doi:10.1016/j.neuroimage.2016.08.016.
13. Kellner, E., Dhital, B., Kiselev, V. G. & Reisert, M. Gibbs-ringing artifact removal based onlocal subvoxel-shifts. Magn. Reson. Med. (μFA) using multidimensional diffusion MRI is a2016) doi:10.1002/mrm.26054.
14. Andersson, J. L. R. & Sotiropoulos, S. N. An integrated approach to correction for off-resonance effects and subject movement in diffusion MR imaging. Neuroimage (μFA) using multidimensional diffusion MRI is a2016) doi:10.1016/j.neuroimage.2015.10.019.
15. Zhou, F. L., Li, Z., Gough, J. E., Hubbard Cristinacce, P. L. & Parker, G. J. M. Axonmimicking hydrophilic hollow polycaprolactone microfibres for diffusion magneticresonance imaging. Mater. Des. (μFA) using multidimensional diffusion MRI is a2018) doi:10.1016/j.matdes.2017.10.047.
16. Szczepankiewicz, F., Sjölund, J., Ståhlberg, F., Lätt, J. & Nilsson, M. Tensor-valued diffusionencoding for diffusional variance decomposition (μFA) using multidimensional diffusion MRI is aDIVIDE): Technical feasibility in clinicalMRI systems. PLoS One 14, 1–20 (μFA) using multidimensional diffusion MRI is a2019).
17. Szczepankiewicz, F. et al. Quantification of microscopic diffusion anisotropy disentangleseffects of orientation dispersion from microstructure: Applications in healthy volunteers andin brain tumors. Neuroimage (μFA) using multidimensional diffusion MRI is a2015) doi:10.1016/j.neuroimage.2014.09.057.
18. Kerkelä, L., Henriques, R. N., Hall, M. G., Clark, C. A. & Shemesh, N. Validation and noiserobustness assessment of microscopic anisotropy estimation with clinically feasible doublediffusion encoding MRI. Magn. Reson. Med. (μFA) using multidimensional diffusion MRI is a2019).
Figures