0720
Evidence for Short Range Disorder in the in vivo Human Brain using OGSE Diffusion MRI1Robarts Research Institute, University of Western Ontario, London, ON, Canada
Synopsis
Oscillating gradient spin-echo (OGSE) diffusion MRI enables probing of the frequency content of the apparent diffusion coefficient (ADC). A square root dependence of ADC on frequency has been demonstrated in both healthy and globally ischemic rodent brain tissue, which is consistent with short range structural disorder along neurites. In this work, OGSE data was acquired at multiple frequencies to explore the power law scaling of the ADC in the human brain in vivo, where evidence of a square root dependence of ADC on frequency was obtained for the first time in the in vivo human brain.
Introduction
Oscillating gradient spin-echo (OGSE) diffusion MRI enables probing of the frequency (ω) content of the apparent diffusion coefficient (ADC),1,2 which provides an extra dimension for probing tissue microstructure.3,4 A dependence of the ADC has been predicted both in the short ($$$\omega\rightarrow\infty$$$) and long ($$$\omega\rightarrow 0$$$) diffusion time regimes 3, and ω = 1/2 has been demonstrated in both healthy 5 and globally ischemic4,6 rodent brain tissue in the long diffusion time regime. A trend towards ω < 1 can be observed in data acquired in the in vivo human brain,7 but the power law dependence of ADC was not explored. Accordingly, in this work OGSE data was acquired at multiple frequencies to explore the power law scaling of the ADC in the human brain in vivo.Methods
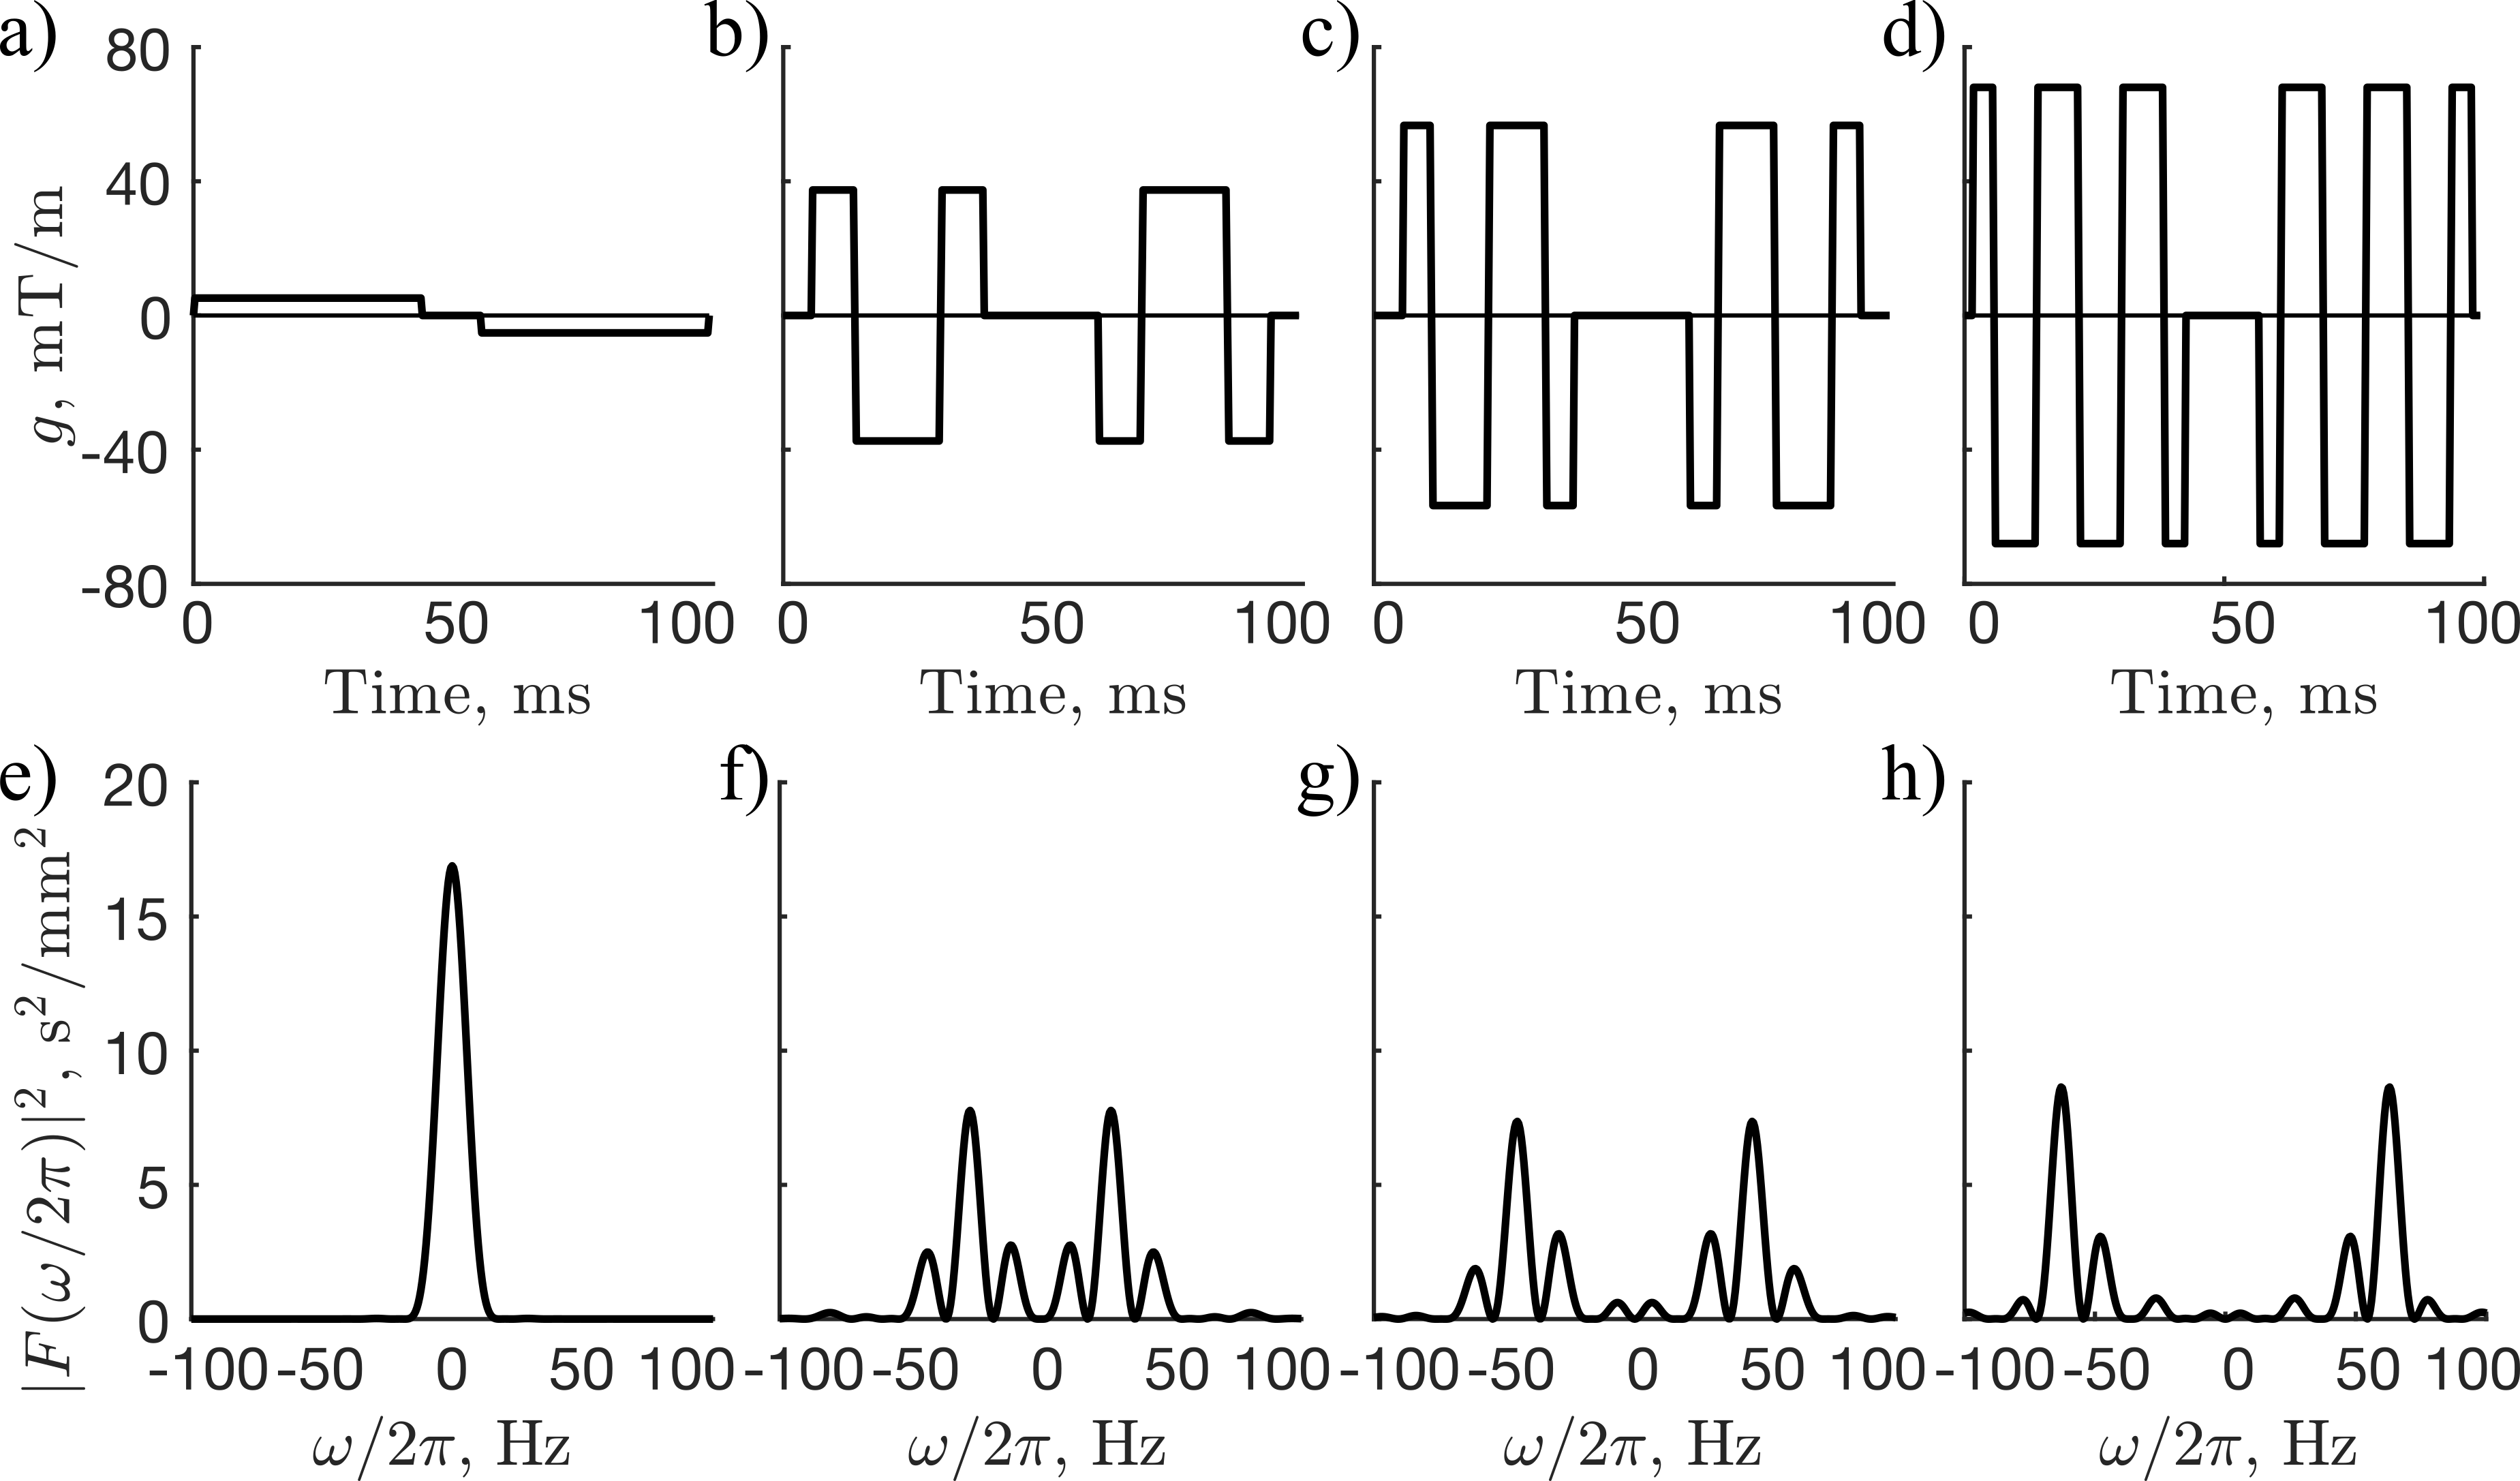
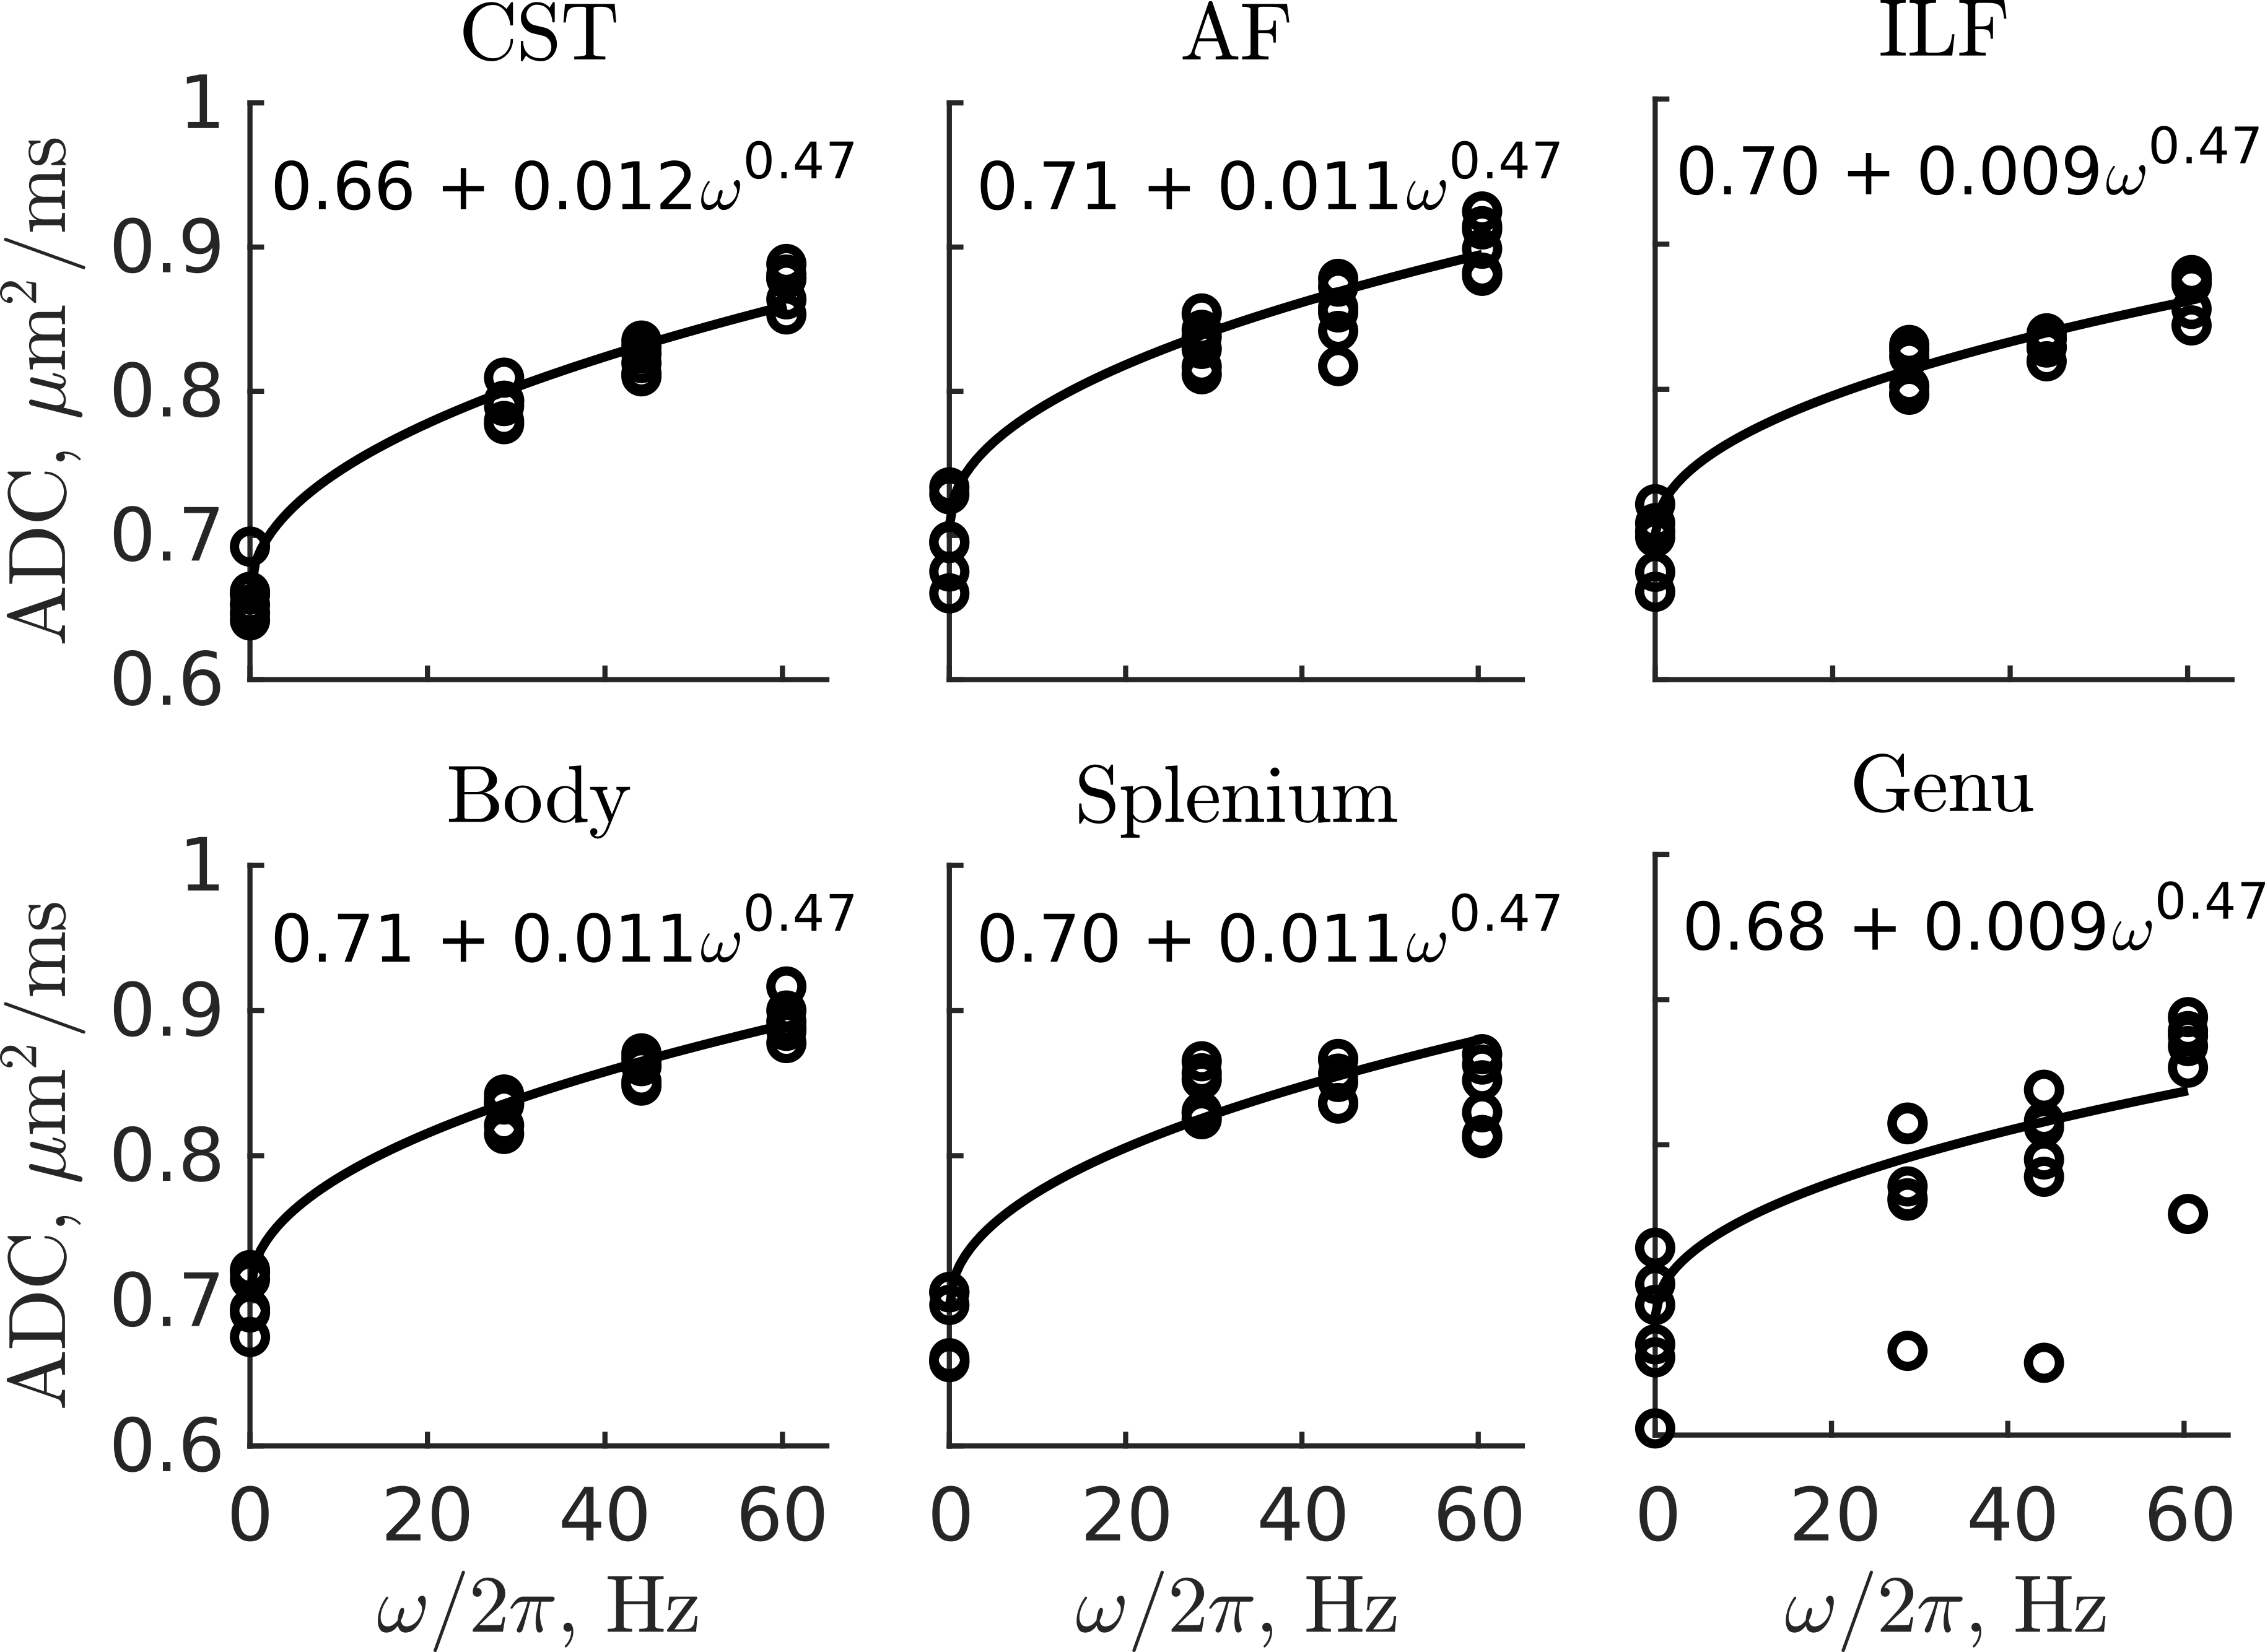
OGSE diffusion encoding with single shot EPI was implemented in 6 healthy volunteers using a 7T head-only system (80 mT/m strength and 350 T/m/s slew rate). Pulsed gradient spin-echo (PGSE; 0 Hz; diffusion time 41 ms) and cosine-modulated trapezoidal OGSE waveforms7 with frequencies of 30Hz, 45 Hz, and 60Hz were implemented in a single integrated scan (Figure 1) (b=450 s/mm2, 4 direction tetrahedral encoding8 with 10 averages each and 10 b=0 acquisitions, TE/TR=111/5500 ms, FOV=200x200 mm2, 2.5 mm isotropic in-plane resolution, 32 slices (3 mm), scan time 18 min). Standard PGSE diffusion tensor imaging (DTI) was also acquired (b = 1000 s/mm2, 30 directions, TE/TR = 53/8200 ms, 2 mm isotropic resolution). The DTI scan was registered to the OGSE scan, which was followed by probabilistic whole-brain tractography using MRTrix.9,10 Tract bundles were extracted using an in-house automated tract clustering pipeline.11,12 To mitigate partial volume errors from cerebrospinal fluid that can exhibit negative $$$\Lambda$$$ due to flow,6,7 voxels with PGSE mean ADC > 0.8 x 10⁻³ mm2/s were omitted from the tract-based mean ADC estimates at all frequencies.The tract-based ADC measurements were fitted to a power law: $$D_\omega=\Lambda\omega^\theta+D_{\omega 0} \qquad\qquad [1]$$ where $$$\Lambda$$$ is the “diffusion dispersion rate”, $$$D_\omega$$$ is the OGSE ADC at a frequency $$$\omega$$$ and $$$D_{\omega 0}$$$ is the ADC at ω=0. Because $$$\theta$$$ describes a general property of structural organization, it is not expected to vary across different white matter regions in the healthy brain. Accordingly, to improve robustness against motion, partial volume effects, and Gibbs ringing, a common $$$\theta$$$ was assumed over all tracts. $$$\Lambda$$$ and $$$D_{\omega 0}$$$ were assigned separately to each tract, and all parameters were estimated together using a maximum likelihood estimation of Eq. 1 over the largest 50 tracts in all the subjects, by volume (i.e., 50 tracts per subject).
Results
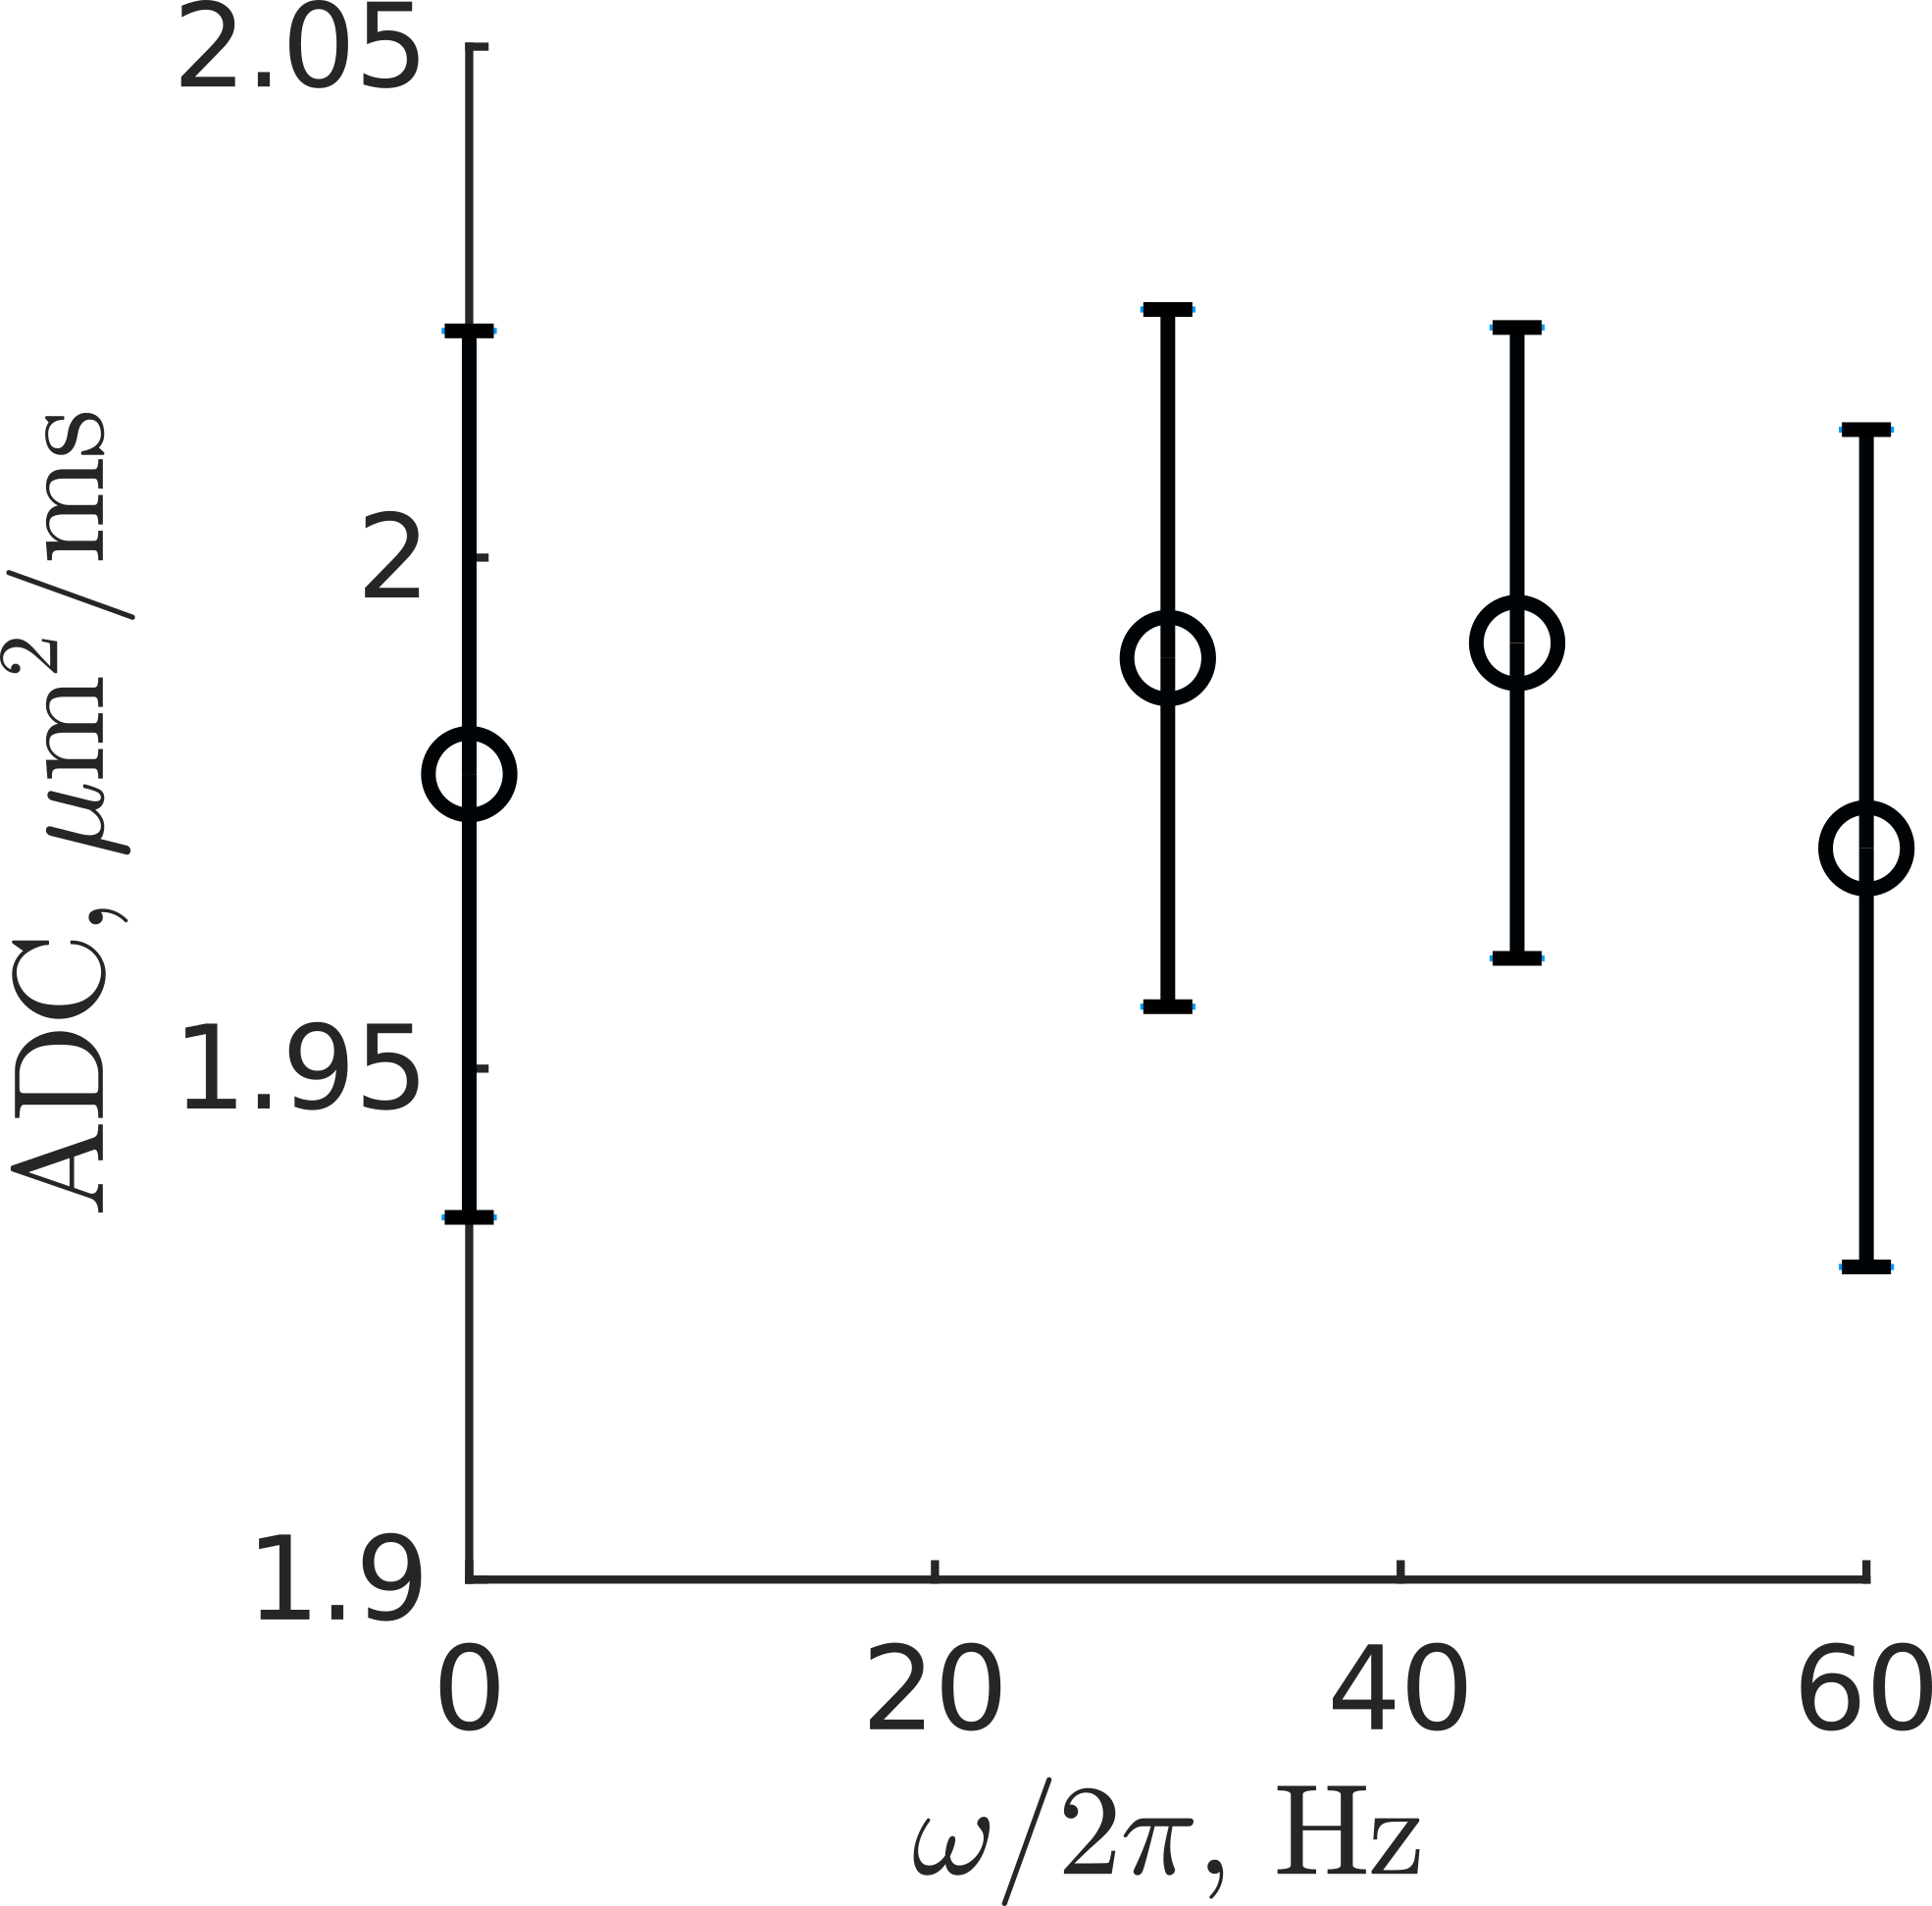
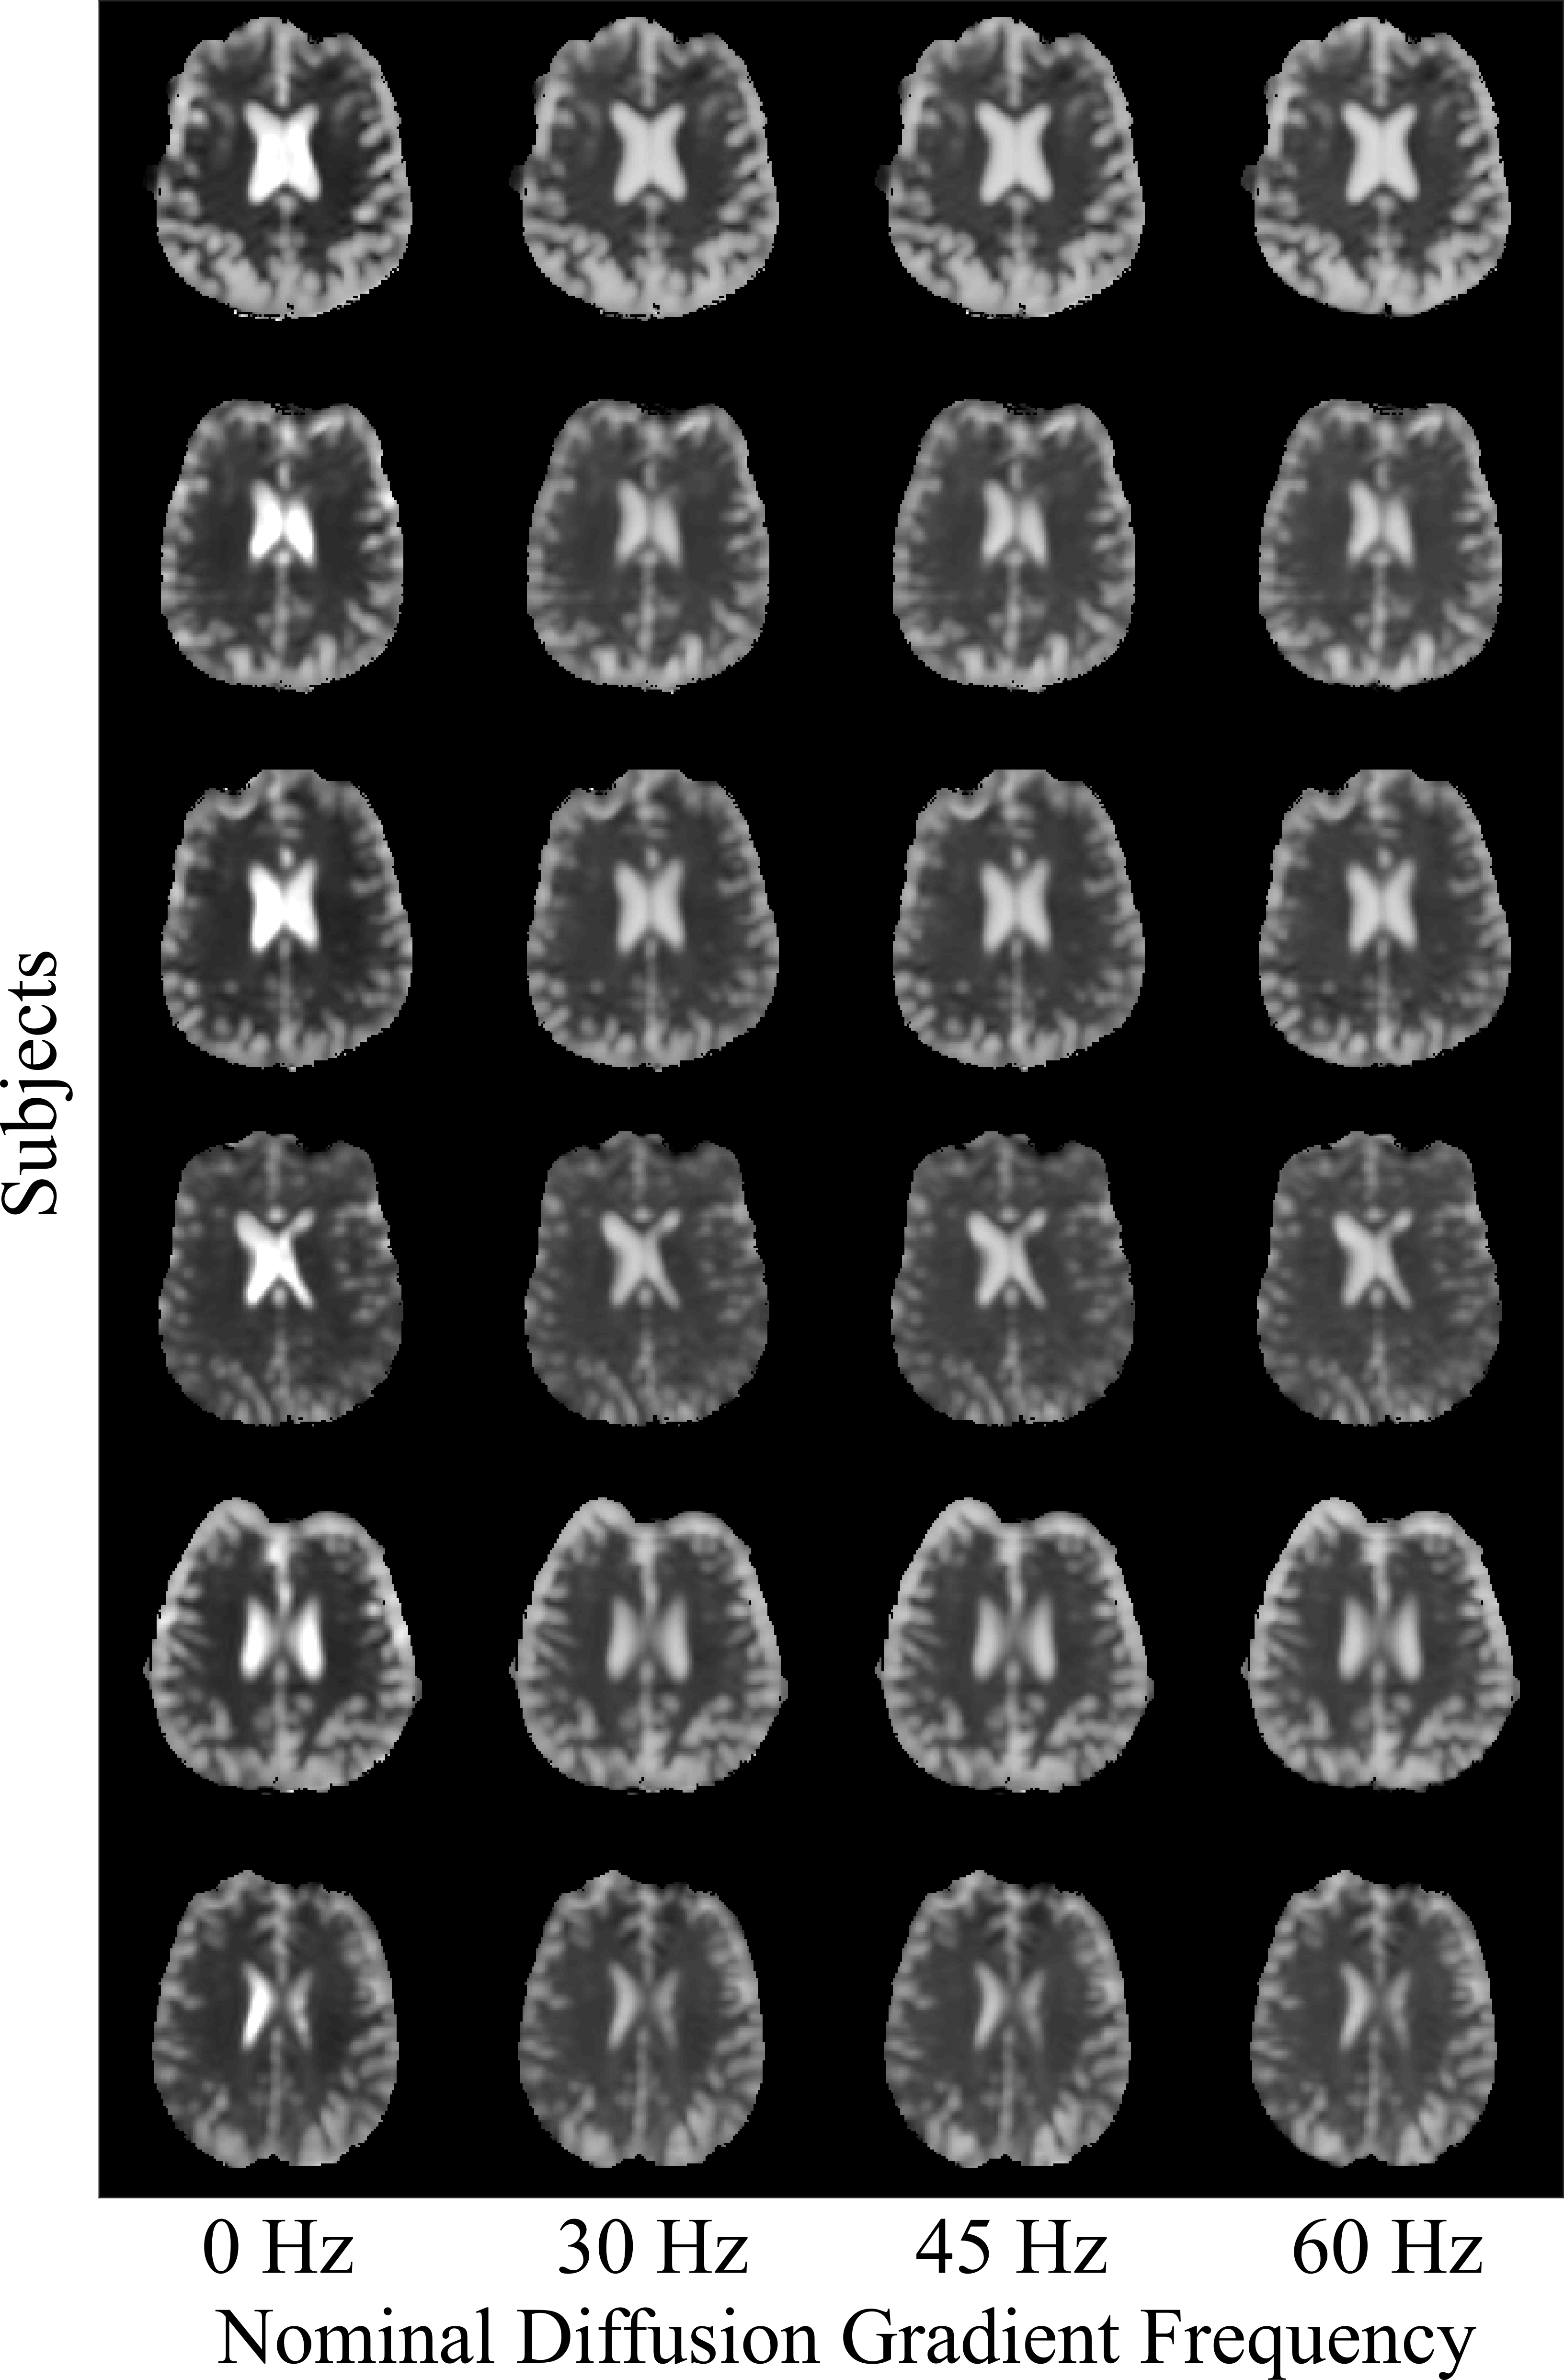
In the water phantom, ADC values were within 1% of the PGSE value at all OGSE frequencies (Figure 2). Mean ADC maps computed from the multiple-frequency scan were of comparable quality over all frequencies and subjects (Figure 3). Over all subjects, the maximum likelihood estimation of $$$\theta$$$ was 0.47±0.05, and $$$\Lambda$$$ ranged from 8±4 µm2/s0.53 to 13±2 µm2/s0.53, depending on the tract (Figure 4). Over all tracts, the mean apparent diffusion dispersion rate was $$$\Lambda$$$=11±1 µm2/s0.53.Discussion and Conclusion
In this work, evidence for a ω1/2 dependence of mean ADC was reported in the in vivo human brain. This trend is similar to recent reports in both healthy5 and globally ischemic4,6 rodent brains. In addition, our finding of $$$\Lambda$$$ values ~ 10 µm2/s1/2 agrees with ADC results reported at a field strength of 4.7 T 7; for example, $$$\Lambda$$$ computed from the corticospinal tract using their reported ADC’s is approximately 10 µm2/s1/2 when $$$\theta$$$ = 1/2.The primary limitation of this study is that only 4 frequencies were used. Acquiring more frequencies is difficult for in vivo human scans due to scan time constraints and because high frequencies drastically reduce the b-value. High performance gradient systems with high slew rates and maximum gradient strengths would enable more robust estimation of and as they would allow access to higher OGSE frequencies.
These acquisitions were likely in the long diffusion time regime given that preclinical studies have estimated that frequencies larger than 90 Hz are required to enter the short diffusion time regime for cancer cells that have dimensions > 10 μm 13. In this regime, the observation of $$$\theta$$$=1/2 in white matter is consistent with either highly correlated structural disorder or short-range disorder along one dimension.4 Given that the permeability of myelinated axons is expected to be negligible at these diffusion times3 and that the intracellular signal is expected to dominate the frequency dependence over extracellular,4 the latter explanation is favoured. In conclusion, this work provides evidence of short range disorder for the first time in the in vivo human brain.
Acknowledgements
The authors thank the Canada first research excellence fund to BrainsCAN, Western Strategic Support Program, and the Natural Sciences and Engineering Research Council of Canada.References
1. Stepišnik, J. Analysis of NMR self-diffusion measurements by a density matrix calculation. Physica B+C 104, 350–364 (1981).
2. Stepišnik, J. Measuring and imaging of flow by NMR. Prog. Nucl. Magn. Reson. Spectrosc. 17, 187–209 (1985).
3. Reynaud, O. Time-Dependent Diffusion MRI in Cancer: Tissue Modeling and Applications. Frontiers in Physics 5, 58 (2017).
4. Novikov, D. S., Jensen, J. H., Helpern, J. A. & Fieremans, E. Revealing mesoscopic structural universality with diffusion. Proc. Natl. Acad. Sci. U. S. A. 111, 5088–5093 (2014).
5. Wu, D. & Zhang, J. The Effect of Microcirculatory Flow on Oscillating Gradient Diffusion MRI and Diffusion Encoding with Dual-Frequency Orthogonal Gradients (DEFOG). Magn. Reson. Med. 77, 1583–1592 (2017).
6. Does, M. D., Parsons, E. C. & Gore, J. C. Oscillating gradient measurements of water diffusion in normal and globally ischemic rat brain. Magn. Reson. Med. 49, 206–215 (2003).
7. Baron, C. A. & Beaulieu, C. Oscillating gradient spin-echo (OGSE) diffusion tensor imaging of the human brain. Magn. Reson. Med. 72, 726–736 (2014).
8. Van, A. T., Holdsworth, S. J. & Bammer, R. In vivo investigation of restricted diffusion in the human brain with optimized oscillating diffusion gradient encoding. Magn. Reson. Med. 71, 83–94 (2014).
9. Raffelt, D., Tournier, J.-D., Crozier, S., Connelly, A. & Salvado, O. Reorientation of fiber orientation distributions using apodized point spread functions. Magn. Reson. Med. 67, 844–855 (2012).
10. Jones, D. K. Tractography gone wild: probabilistic fibre tracking using the wild bootstrap with diffusion tensor MRI. IEEE Trans. Med. Imaging 27, 1268–1274 (2008).
11. Kai, J., Kasa, L. W., Peters, T. M. & Khan, A. Investigating U-Shape Fibers from Data-Driven Clustering of White Matter Tractography. in Joint Annual Meeting ISMRM-ESMRMB 2018
12. Kai, J. & Khan, A. R. NeuroBundle Extraction and Evaluation Resource. (2019). doi:10.5281/zenodo.3350903
13. Reynaud, O. et al. Surface-to-volume ratio mapping of tumor microstructure using oscillating gradient diffusion weighted imaging. Magn. Reson. Med. 76, 237–247 (2016).
Figures