0719
Oscillating Gradient Diffusion-Encoding In Human Brain Shows Linear Frequency Correlation in High Amplitude and Slew Rate Head Gradient System1GE Research, Niskayuna, NY, United States, 2Radiology and Imaging, Hospital for Special Surgery, New York, NY, United States, 3Walter Reed National Military Medical Center, Bethesda, MD, United States, 4GE Healthcare, Stockholm, Sweden, 5Stanford University, Stanford, CA, United States, 6Radiology, Mayo Clinic, Rochester, MN, United States
Synopsis
High gradient amplitude, high gradient slew rate, and high peripheral nerve stimulation thresholds are required for oscillating gradient spin-echo (OGSE) diffusion imaging on human MRI systems. With 200 mT/m amplitude and 500 T/m/s slew rate, the MAGNUS head gradient coil was used to evaluate OGSE imaging in six healthy subjects at frequencies up to 100 Hz and b=450 s/mm2. Comparisons were made against standard pulsed gradient spin-echo (PGSE) diffusion in-vivo, which show up to 27% increased OGSE diffusivity, excellent linear correlation with frequency, and correlation length scales of 0.8µm in white matter. Diffusivity changes were negligible in an isotropic phantom.
Introduction
OGSE diffusion-encoding(1) provides length-scale selectivity as compared to standard PGSE diffusion. However, conventional human MRI is limited in gradient amplitude, maximum slew rates, and peripheral nerve stimulation; OGSE requires both high amplitude and the highest possible slew rates due to the rapidly switching OGSE waveforms. Consequently, it has been feasible to obtain in preclinical (animal) MRI systems frequencies of 300 Hz at b=500-1000 s/mm2 (2,3), whereas clinical MRI systems provide at best 62.5 Hz at b=100 s/mm2.(4,5) While gradient coil prototypes with either high amplitude (6) or high slew rate (7) have been demonstrated, whole-body peripheral nerve stimulation (PNS) further limits the attainable OGSE frequencies. This work evaluates OGSE feasibility and frequency-dependence in white matter using the microstructure anatomy gradient for neuroimaging with ultrafast scanning (MAGNUS) head-gradient (8) with simultaneously achievable 200 mT/m amplitude and 500 T/m/s slew rate, which has substantially higher PNS thresholds than in clinical whole-body MRI systems(9).Methods
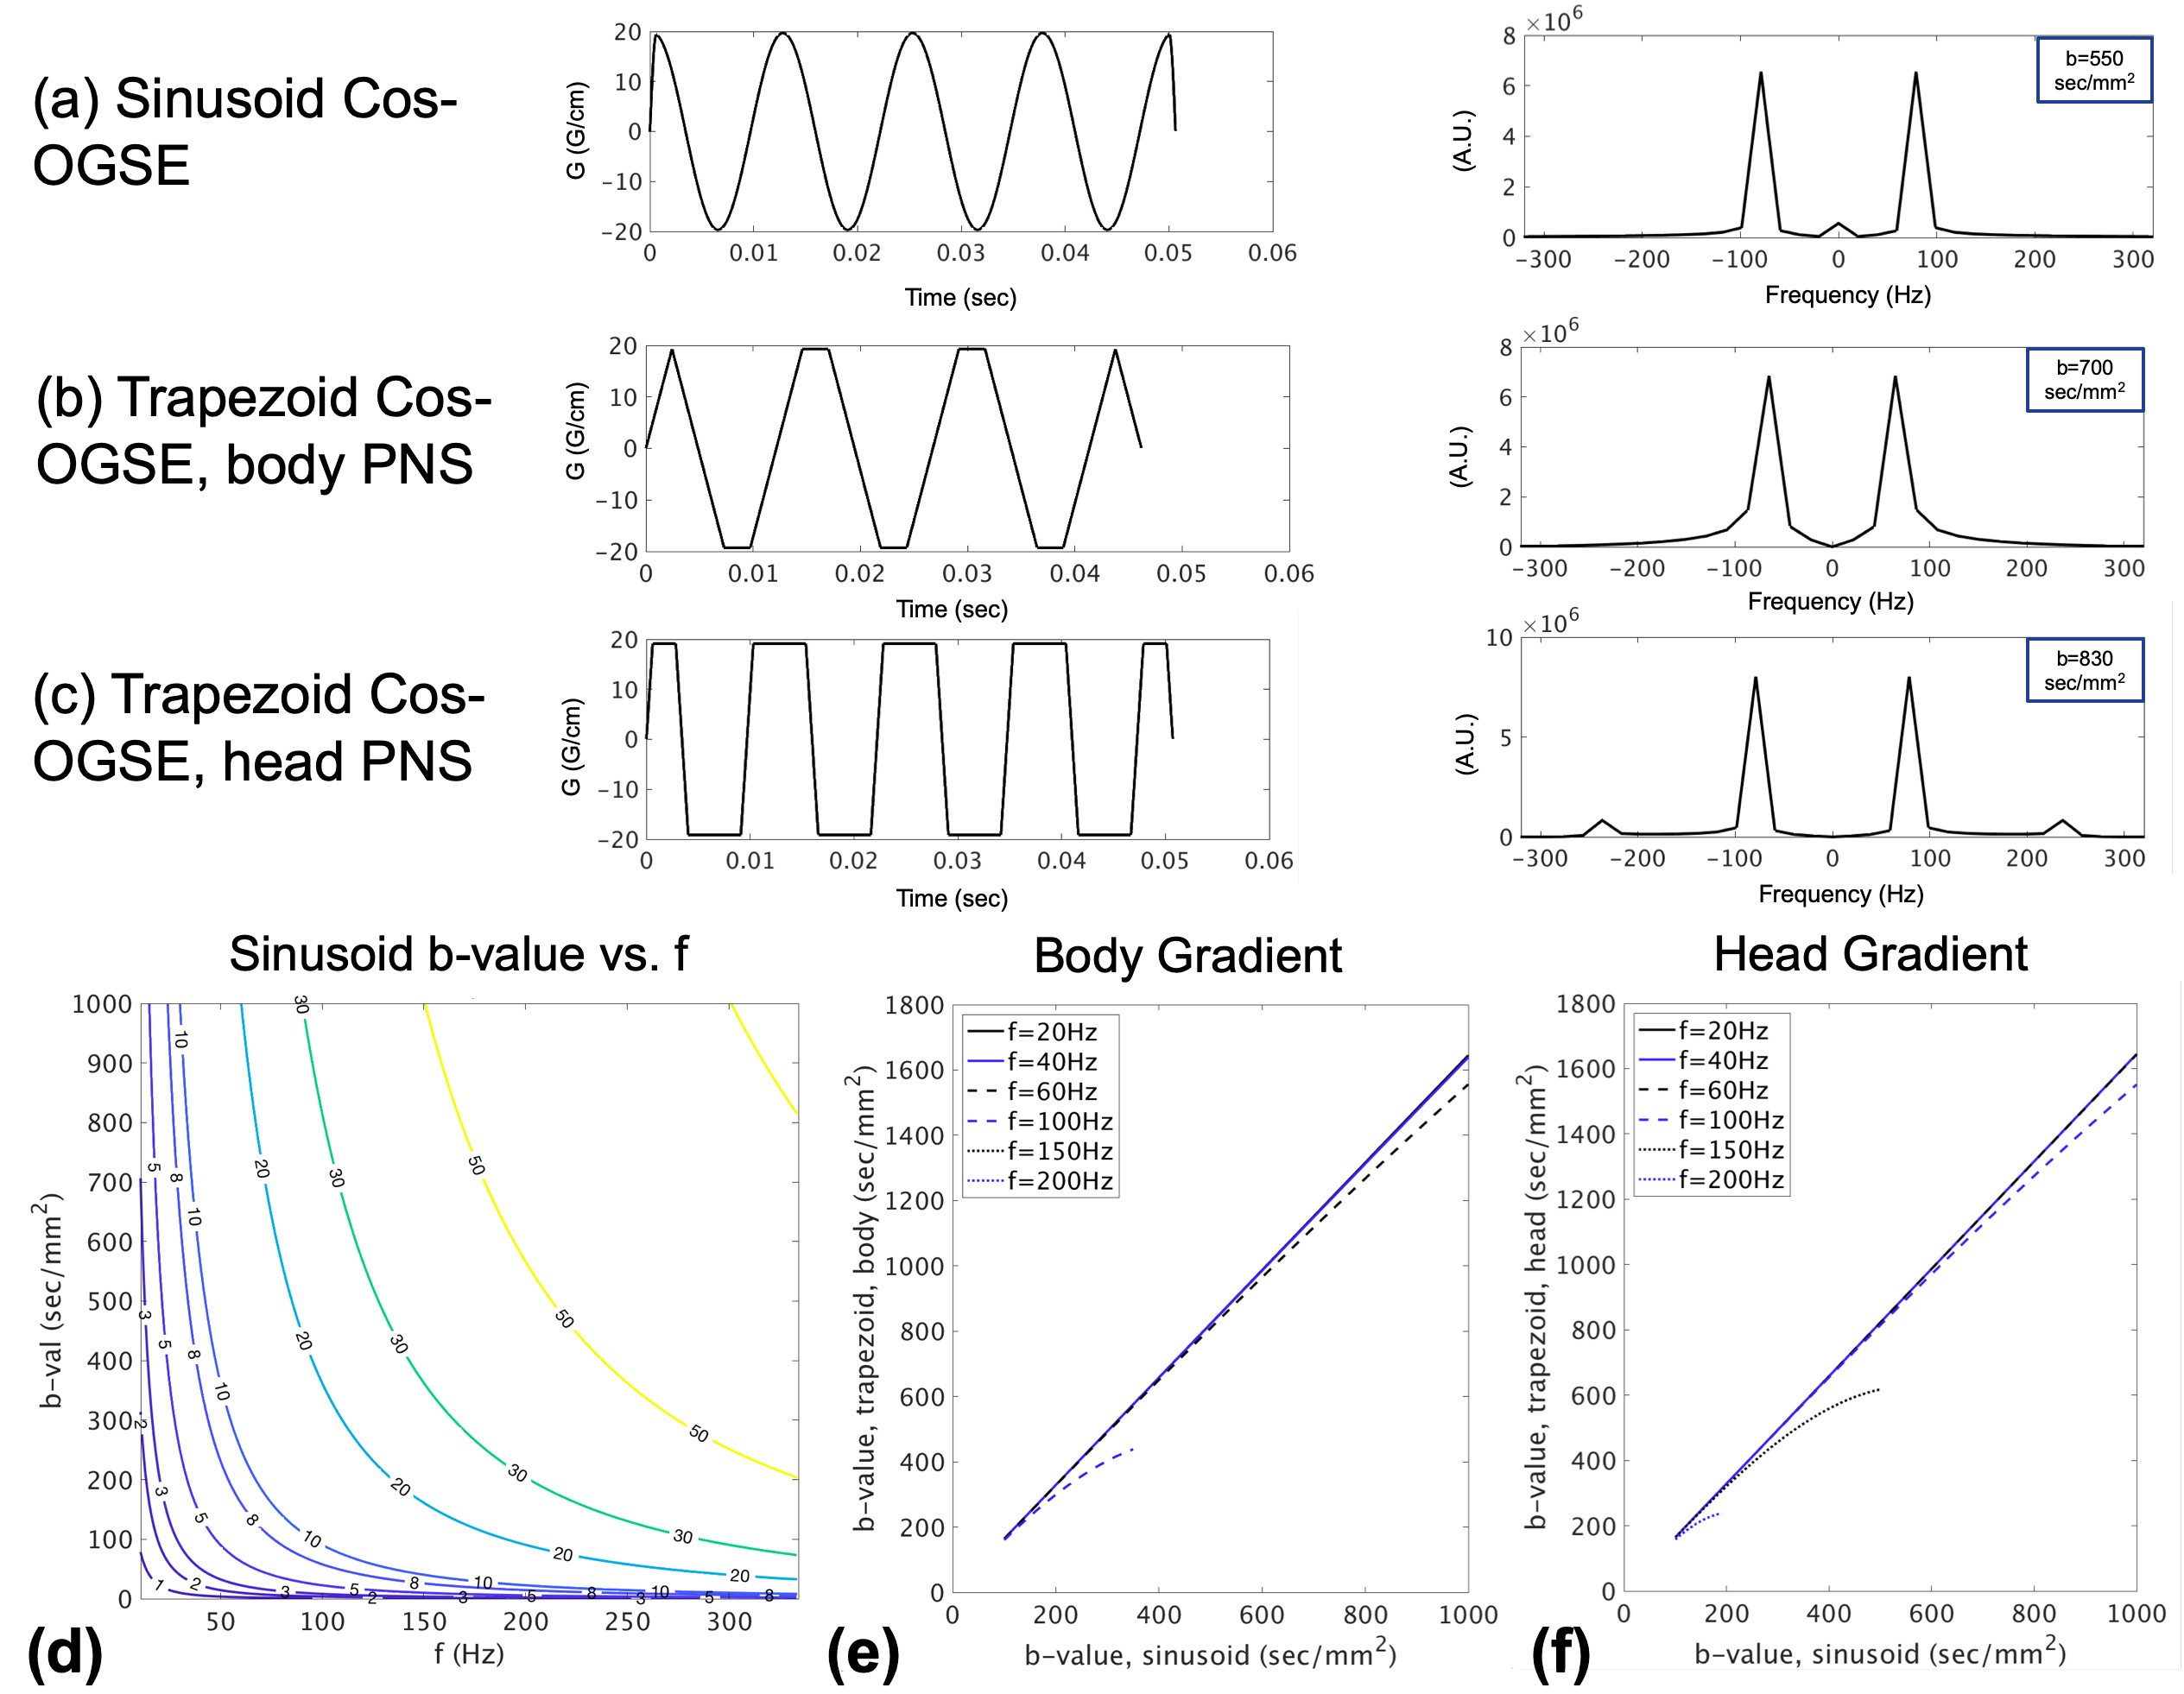
To determine maximum achievable OGSE frequencies and b-values, waveforms of sinusoidal-cosine and trapezoidal-cosine waveforms were analyzed over a range of hardware gradient amplitudes and slew rates. The PNS parameters used for conventional whole-body gradient were $$$\triangle G_{min,body}=23.5mT/m$$$, $$$\triangle SR_{min,body}=70.3 T/m/s$$$, and for MAGNUS head-gradient were $$$\triangle G_{min,head}=111mT/m$$$, $$$\triangle SR_{min,head}=145 T/m/s$$$ (9).Six healthy subjects (4M, 2F, age=32-59 years) were recruited under an IRB-approved protocol and imaged on the MAGNUS gradient installed on a 3T MRI scanner (MR750, GE Healthcare) with its whole-body gradient and RF coil removed. A custom-built 37-cm inner-diameter RF transmit/receiver coil was used, along with a 32-channel phased-array brain coil receiver (Nova Medical). The standard PGSE sequence was modified to enable OGSE with a nominal pulse width of 50ms. Standard PGSE DTI and OGSE DTI were acquired with one b=0s/mm2 and twenty b=450s/mm2 directions per frequency at five frequencies (20-100Hz) with 20 directions per frequency (TR/TE=7000/122ms, FOV=25.6cm, 128x128 matrix, slice thickness=3mm, echo spacing=428µs). A spherical 20% PVP phantom (11-cm diameter) was also imaged. The Johns Hopkins white matter atlas and deformable registration (10,11) were utilized for automated analysis. Wilcoxon signed rank-test was used for paired comparisons of DTI metrics from each parcel (p<0.05 indicates statistical significance).
To determine linear correlation of diffusivity with OGSE frequency, a disordered model for extra-axonal water was adopted (12,13), whereby diffusivity D was related to long-term diffusivity $$$D_\infty$$$ and frequency f by $$$D(f)=D_\infty+A\frac{\pi}{2}|2\pi f|$$$, and $$$A\approx0.2l_c^2$$$ where $$$l_c$$$ s the correlation length of a two-dimensional, disordered packing geometry.
Results
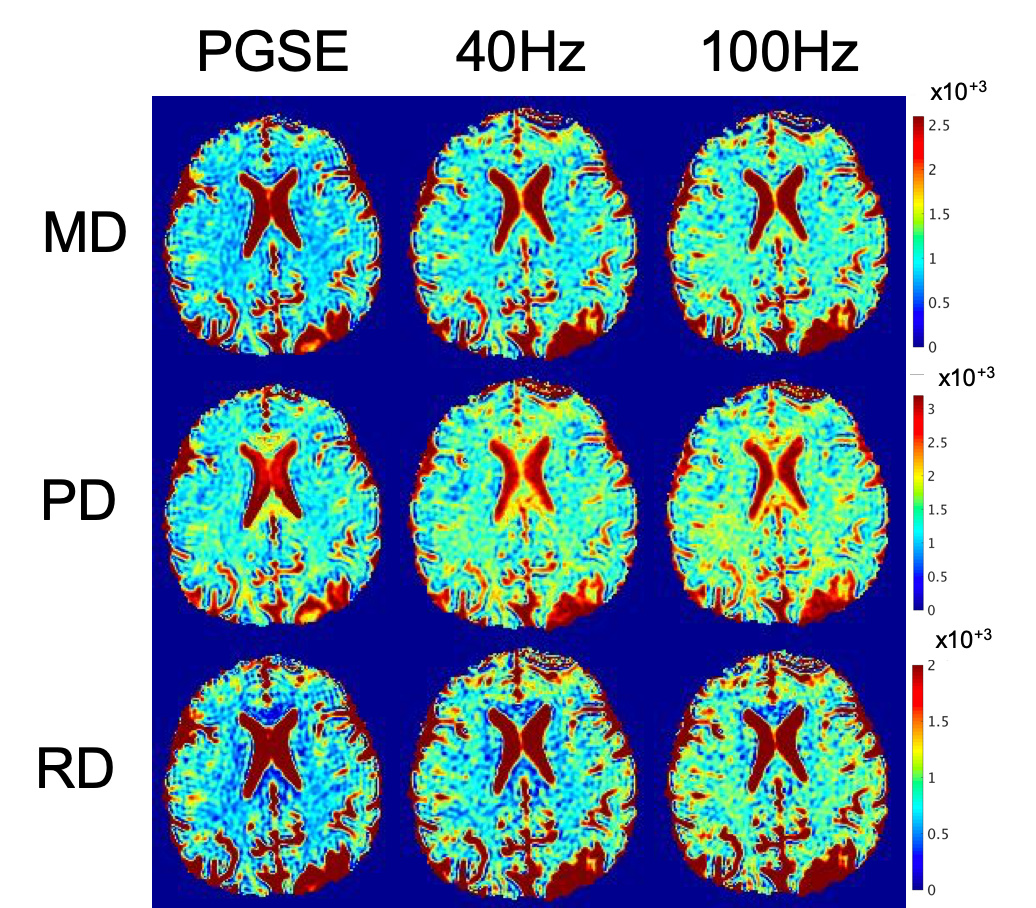
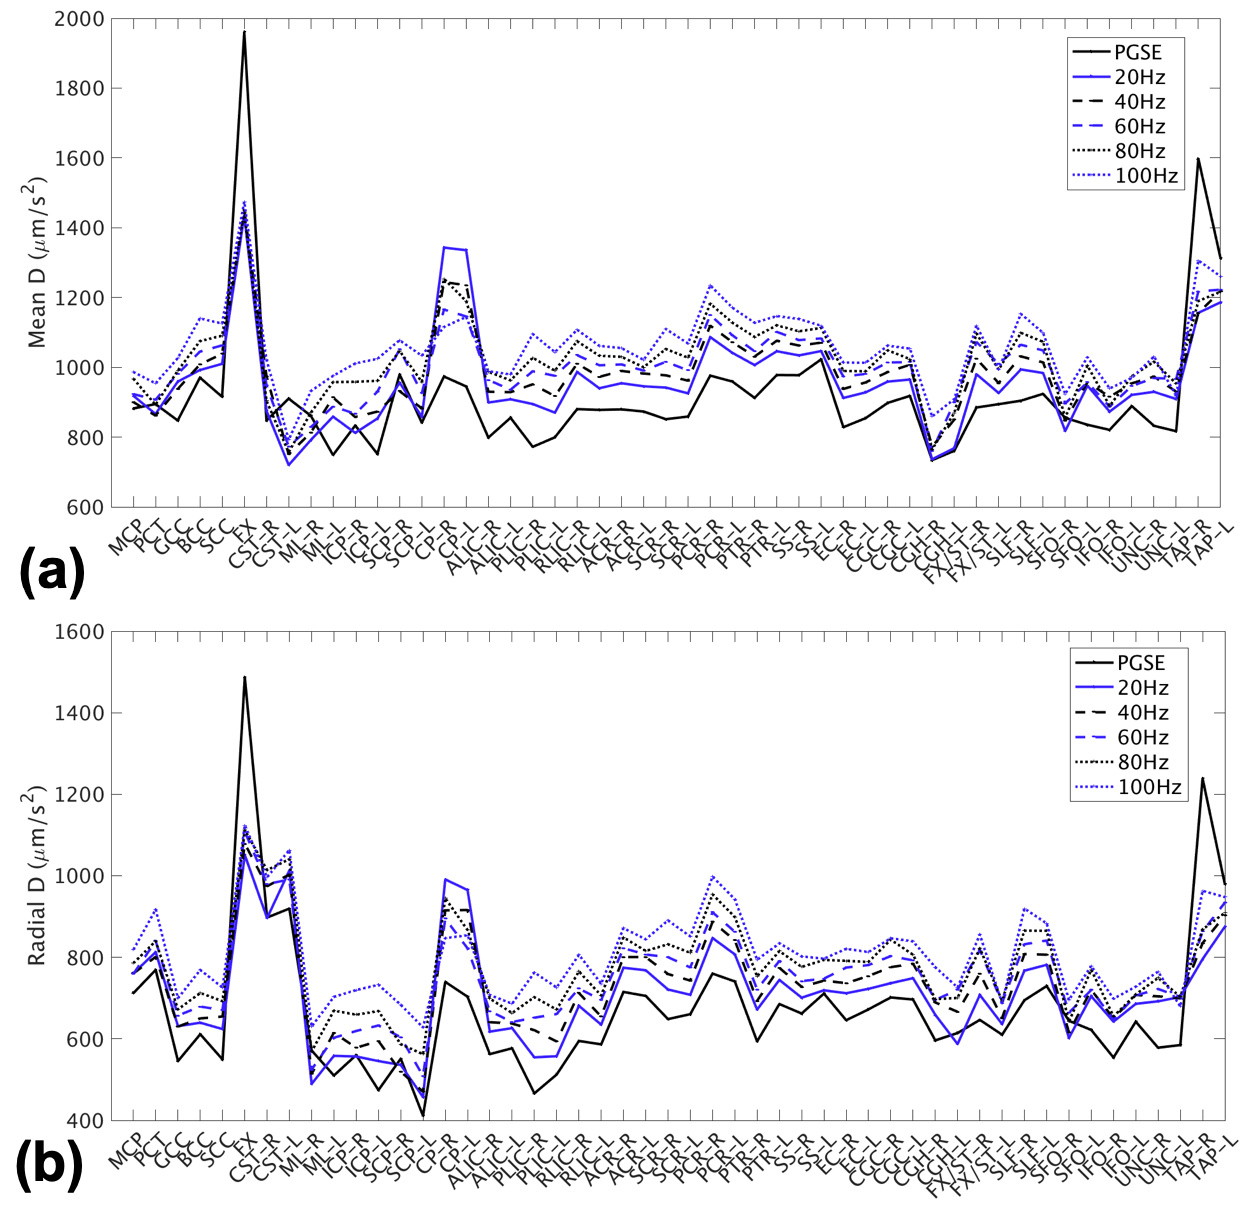
Fig.1(a-d) shows trapezoidal cosine-OGSE provides higher b-values than sinusoidal cosine-OGSE with similar frequency spectra selectivity. Additionally, Fig.1e-f shows head-PNS limited trapezoidal-cosine-OGSE provides even higher b-values than body-PNS limited trapezoidal-cosine-OGSE because of faster ramps (0.9ms vs 2.5ms). Fig.2 shows increased OGSE diffusivity vs. PGSE that also increased with frequency. These patterns of increased diffusivity were observed in almost every white matter parcel (Fig.3). Table 1 summarizes results from all 50 parcels. Overall, OGSE diffusivity measures were higher than standard PGSE’s, and the increase was approximately linear with frequency; at 100Hz OGSE, the increase over PGSE were +15% to +27%. The number of parcels with statistically significant differences increased with frequency. In comparison, these effects were negligible in the static phantom (<3%).Linear fitting to the disordered model on a per-parcel basis resulted in good linear correlation (R2>0.85) and positive $$$l_c$$$ in most parcels (41/50 in MD, 30/50 in PD and 43/50 in RD). The mean (± standard deviation) values for long-term diffusivity were $$$D_{\infty,\tt MD}$$$=911±72µm2/s, $$$D_{\infty,\tt PD}$$$=1519±164µm2/s, and $$$D_{\infty,\tt RD}$$$=640±111µm /s. The values for correlation length were $$$l_{c,\tt MD}$$$=0.802±156µm, $$$l_{c,\tt PD}$$$=0.837±0.172µm, and $$$l_{c,\tt RD}$$$=0.780±0.174µm. Fig. 4 shows $$$D_{\infty}$$$ and $$$l_{c}$$$ maps, whereby fitting on a per-voxel basis; fitting was mostly reliable, except in the $$$l_{c,\tt PD}$$$ maps due to noise.
Discussion
The significant linear increase in diffusivity with OGSE frequency allowed for fitting to the disordered extra-axonal model. The $$$l_{c,\tt RD}$$$ in the genu, body and splenium of the corpus callosum were 0.69, 0.98 and 0.76µm respectively, not dissimilar to the results of Burcaw et al(13) from rhesus monkey corpus callosum (0.65, 1.01, and 0.94µm). However, these were 3-5 times lower than in vivo human results of Fieremans, et al (14) acquired using STEAM preparation rather than OGSE. These differences could be due to longer mixing times in STEAM, or from the empirical $$$A\approx0.2l_c^2$$$ assumption.Linear fitting was excellent in RD but less so in PD, which would support the notion of short-range disorder (linear relationship frequency) for RD and long-range disorder (quadratic relationship with frequency) for PD. Future work would focus on quadratic fitting with more frequency datapoints.
Conclusion
A strong linear trend for diffusivity increase with OGSE frequency was observed in human subjects. These preliminary results with b-value of 450s/mm2 and 100Hz were made feasible by the 200mT/m, 500T/m/s MAGNUS head-gradient. The higher head-PNS thresholds of MAGNUS allowed for higher b-values and higher OGSE frequencies.Frequencies up to 200Hz with b=1000s/mm2 may be feasible by equipping MAGNUS with stronger gradient drivers. Ultra-strong gradients may enable clinical applications for probing human tissue microstructure at smaller diffusion times or length scales than previously possible, such as studying the axonal microstructure in normal appearing white matter of neurocognitive or neurodegenerative disease, and differentiating tissue cellularity in neuro-oncology.
Acknowledgements
This work was supported in part by CDMRP W81XWH-16-2-005 and NIH U01-EB024450. The views expressed in this manuscript are those of the authors and do not necessarily reflect the official policy or position of the Uniformed Services University of the Health Sciences, Walter Reed National Military Medical Center, the Department of Defense or the U.S. Government.The authors will like to thank Grant Yang, Flavio Dell’ Acqua, Steve Kecskemecti, Andy Alexander, Luca Marinelli, and John Schenck for useful discussions on brain microstructure modeling. We also thank Eric Fiveland, Joseph Piel and Keith Park for performing systems integration of the MAGNUS gradient.
References
1. Schachter, Does, Anderson A, Gore J. Measurements of Restricted Diffusion Using an Oscillating Gradient Spin-Echo Sequence. J Magn Reson 2000;147:232 doi: 10.1006/jmre.2000.2203 .
2. Xu J, Does MD, Gore JC. Sensitivity of MR diffusion measurements to variations in intracellular structure: Effects of nuclear size. Magnet Reson Med 2009;61:828 833 doi: 10.1002/mrm.21793 .
3. Aggarwal M, Jones MV, Calabresi PA, Mori S, Zhang J. Probing Mouse Brain Microstructure Using Oscillating Gradient Diffusion MRI. Magnet Reson Med 2011;67:98 doi: 10.1002/mrm.22981 .
4. Andica C, Hori M, Kamiya K, et al. Spatial Restriction within Intracranial Epidermoid Cysts Observed Using Short Diffusion-time Diffusion-weighted Imaging. Magn Reson Med Sci 2018;17:269 272 doi: 10.2463/mrms.cr.2017-0111 .
5. Van AT, Holdsworth SJ, Bammer R. In vivo investigation of restricted diffusion in the human brain with optimized oscillating diffusion gradient encoding. Magnet Reson Med 2013;71:83 94 doi: 10.1002/mrm.24632 .
6. Setsompop K, Kimmlingen R, Eberlein E, et al. Pushing the limits of in vivo diffusion MRI for the Human Connectome Project. Neuroimage 2013;80:220 233 doi: 10.1016/j.neuroimage.2013.05.078 .
7. Foo T, Laskaris E, Vermilyea M, et al. Lightweight, compact, and high-performance 3T MR system for imaging the brain and extremities. Magnet Reson Med 2018;80:2232 2245 doi: 10.1002/mrm.27175 .
8. Foo T, Tan E, Vermilyea M. Highly efficient head-only magnetic field insert gradient coil for achieving simultaneous high gradient amplitude and slew rate at 3.0T (MAGNUS) for brain microstructure imaging. doi: DOI:10.1002/mrm.28087 (in press).
9. Tan ET, Hua Y, Fiveland EW, et al. Peripheral nerve stimulation limits of a high amplitude and slew rate magnetic field gradient coil for neuroimaging. Magnet Reson Med 2019 doi: 10.1002/mrm.27909 .
10. Avants BB, Epstein CL, Grossman M, Gee JC. Symmetric diffeomorphic image registration with cross-correlation: Evaluating automated labeling of elderly and neurodegenerative brain. Med Image Anal 2008;12:26–41 doi: 10.1016/j.media.2007.06.004 .
11. Bhushan C, Haldar JP, Choi S, Joshi AA, Shattuck DW, Leahy RM. Co-registration and distortion correction of diffusion and anatomical images based on inverse contrast normalization. Neuroimage 2015;115:269–280 doi: 10.1016/j.neuroimage.2015.03.050 .
12. Novikov D, Jensen J, Helpern J, Fieremans E. Revealing mesoscopic structural universality with diffusion. Proc National Acad Sci 2014;111:5088 5093 doi: 10.1073/pnas.1316944111 .
13. Burcaw LM, Fieremans E, Novikov DS. Mesoscopic structure of neuronal tracts from time-dependent diffusion. Neuroimage 2015;114:18 37 doi: 10.1016/j.neuroimage.2015.03.061 .
14. Fieremans E, Burcaw LM, Lee H-H, Lemberskiy G, Veraart J, Novikov DS. In vivo observation and biophysical interpretation of time-dependent diffusion in human white matter. Neuroimage 2016;129:414 427 doi: 10.1016/j.neuroimage.2016.01.018 .
Figures