0717
Correlation Tensor Imaging - resolving non-Gaussian diffusion sources of in vivo tissues1Champalimaud Research, Champalimaud Centre for the Unknown, Lisbon, Portugal, 2Center of Functionally Integrative Neuroscience (CFIN) and MINDLab, Clinical Institute, Aarhus University, Aarhus, Denmark, 3Department of Physics and Astronomy, Aarhus University, Aarhus, Denmark
Synopsis
Resolving the different sources of diffusional kurtosis can increase DKI’s specificity towards different microstructural features. Such sources can be resolved using the correlation tensor imaging (CTI) – a novel double diffusion encoding technique that does not rely on common assumptions of time-independent diffusion. Here, a minimal acquisition protocol for CTI is designed and used to characterize the diffusional kurtosis of living rat brains for the first time. We here develop an approach to acquire CTI data in vivo and show that it can robustly decouple inter-compartmental kurtosis sources (anisotropic and isotropic diffusivity variances) from intra-compartmental kurtosis sources.
Introduction
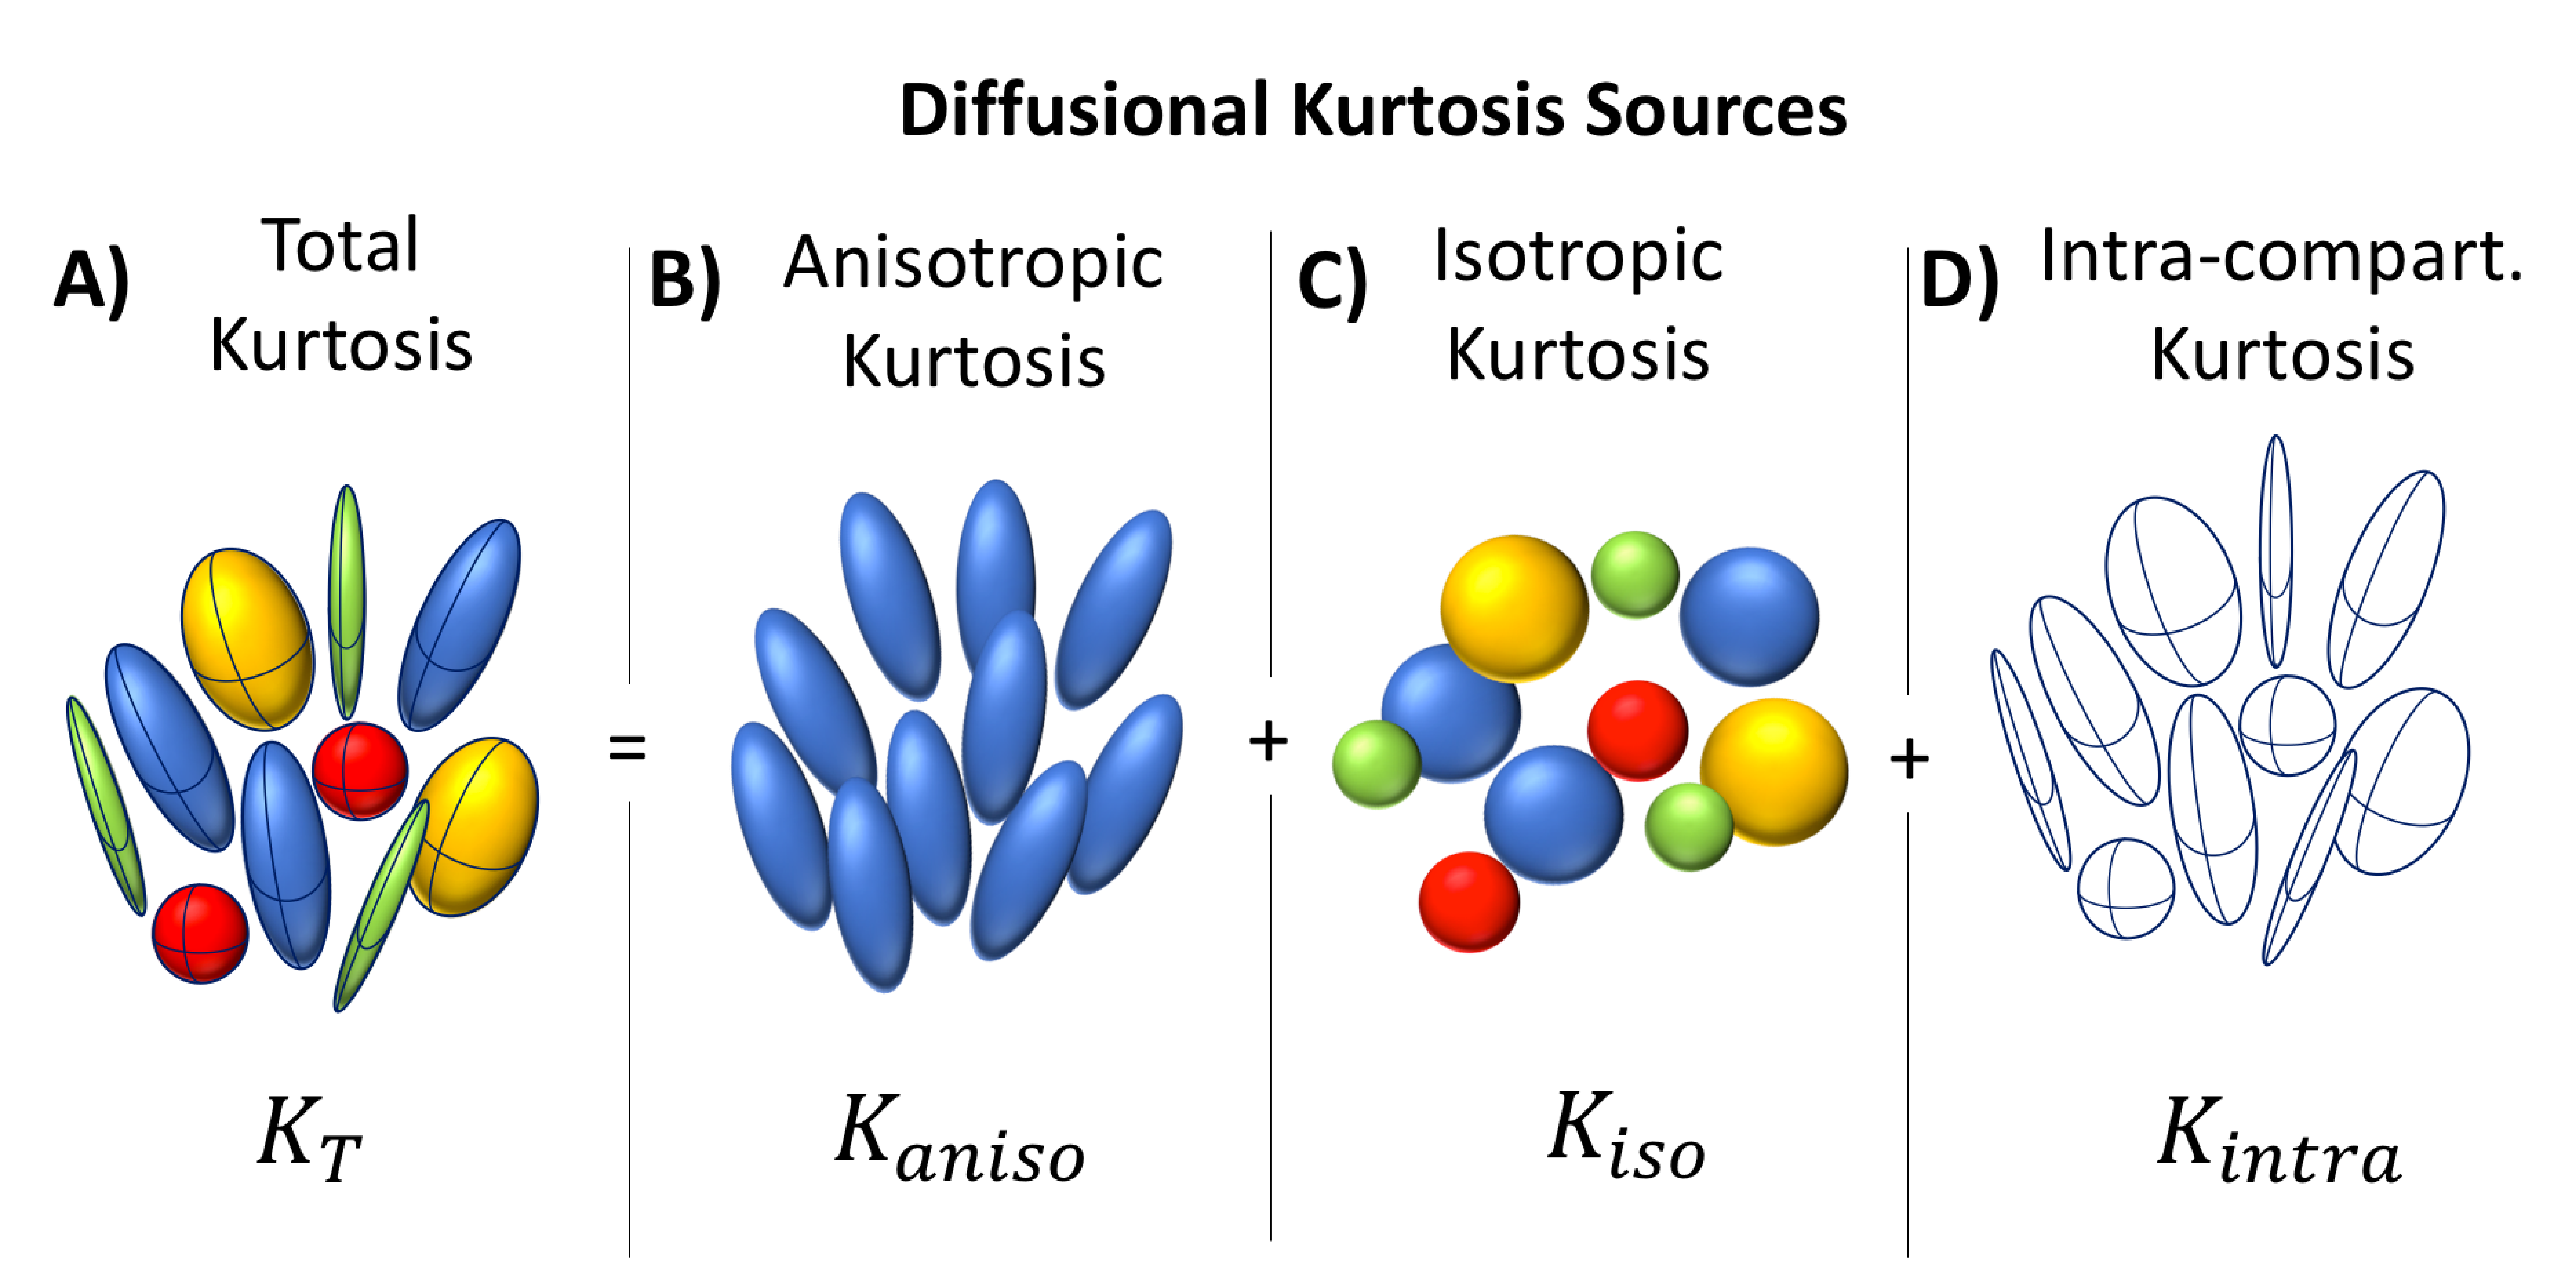
Diffusion Kurtosis Imaging (DKI)1is a sensitive biomarker of microstructural alterations in health and disease2,3. However, several sources of non-Gaussian diffusion contribute to DKI’s contrast (Fig.1A), thereby diminishing its specificity. Techniques based on q-space trajectory encoding (QTE) schemes can currently resolve two inter-compartmental kurtosis sources: microscopic anisotropic (anisotropic kurtosis, Fig.1B) and the variance of compartment’s mean diffusivities (isotropic kurtosis, Fig. 1C)4,5, which has been shown to be useful for distinguishing different tumour types6-8. However, QTE assumes vanishing intra-compartmental kurtosis and diffusion time independence (Fig. 1D) – which may be a strong assumption in some biological tissues9-10. Recently, different kurtosis contributions were resolved in an assumption-free fashion using correlation tensor imaging (CTI)11– a novel approach based on the correlations tensors of double diffusion encoding (DDE) signals12-20. However, CTI acquisitions were very long and incompatible with in vivo conditions. Here, we designed a minimal protocol for CTI, which can faithfully report on all its metrics, and performed the first CTI experiments in vivo aiming to characterize different intra- and inter-compartment kurtosis sources.Methods
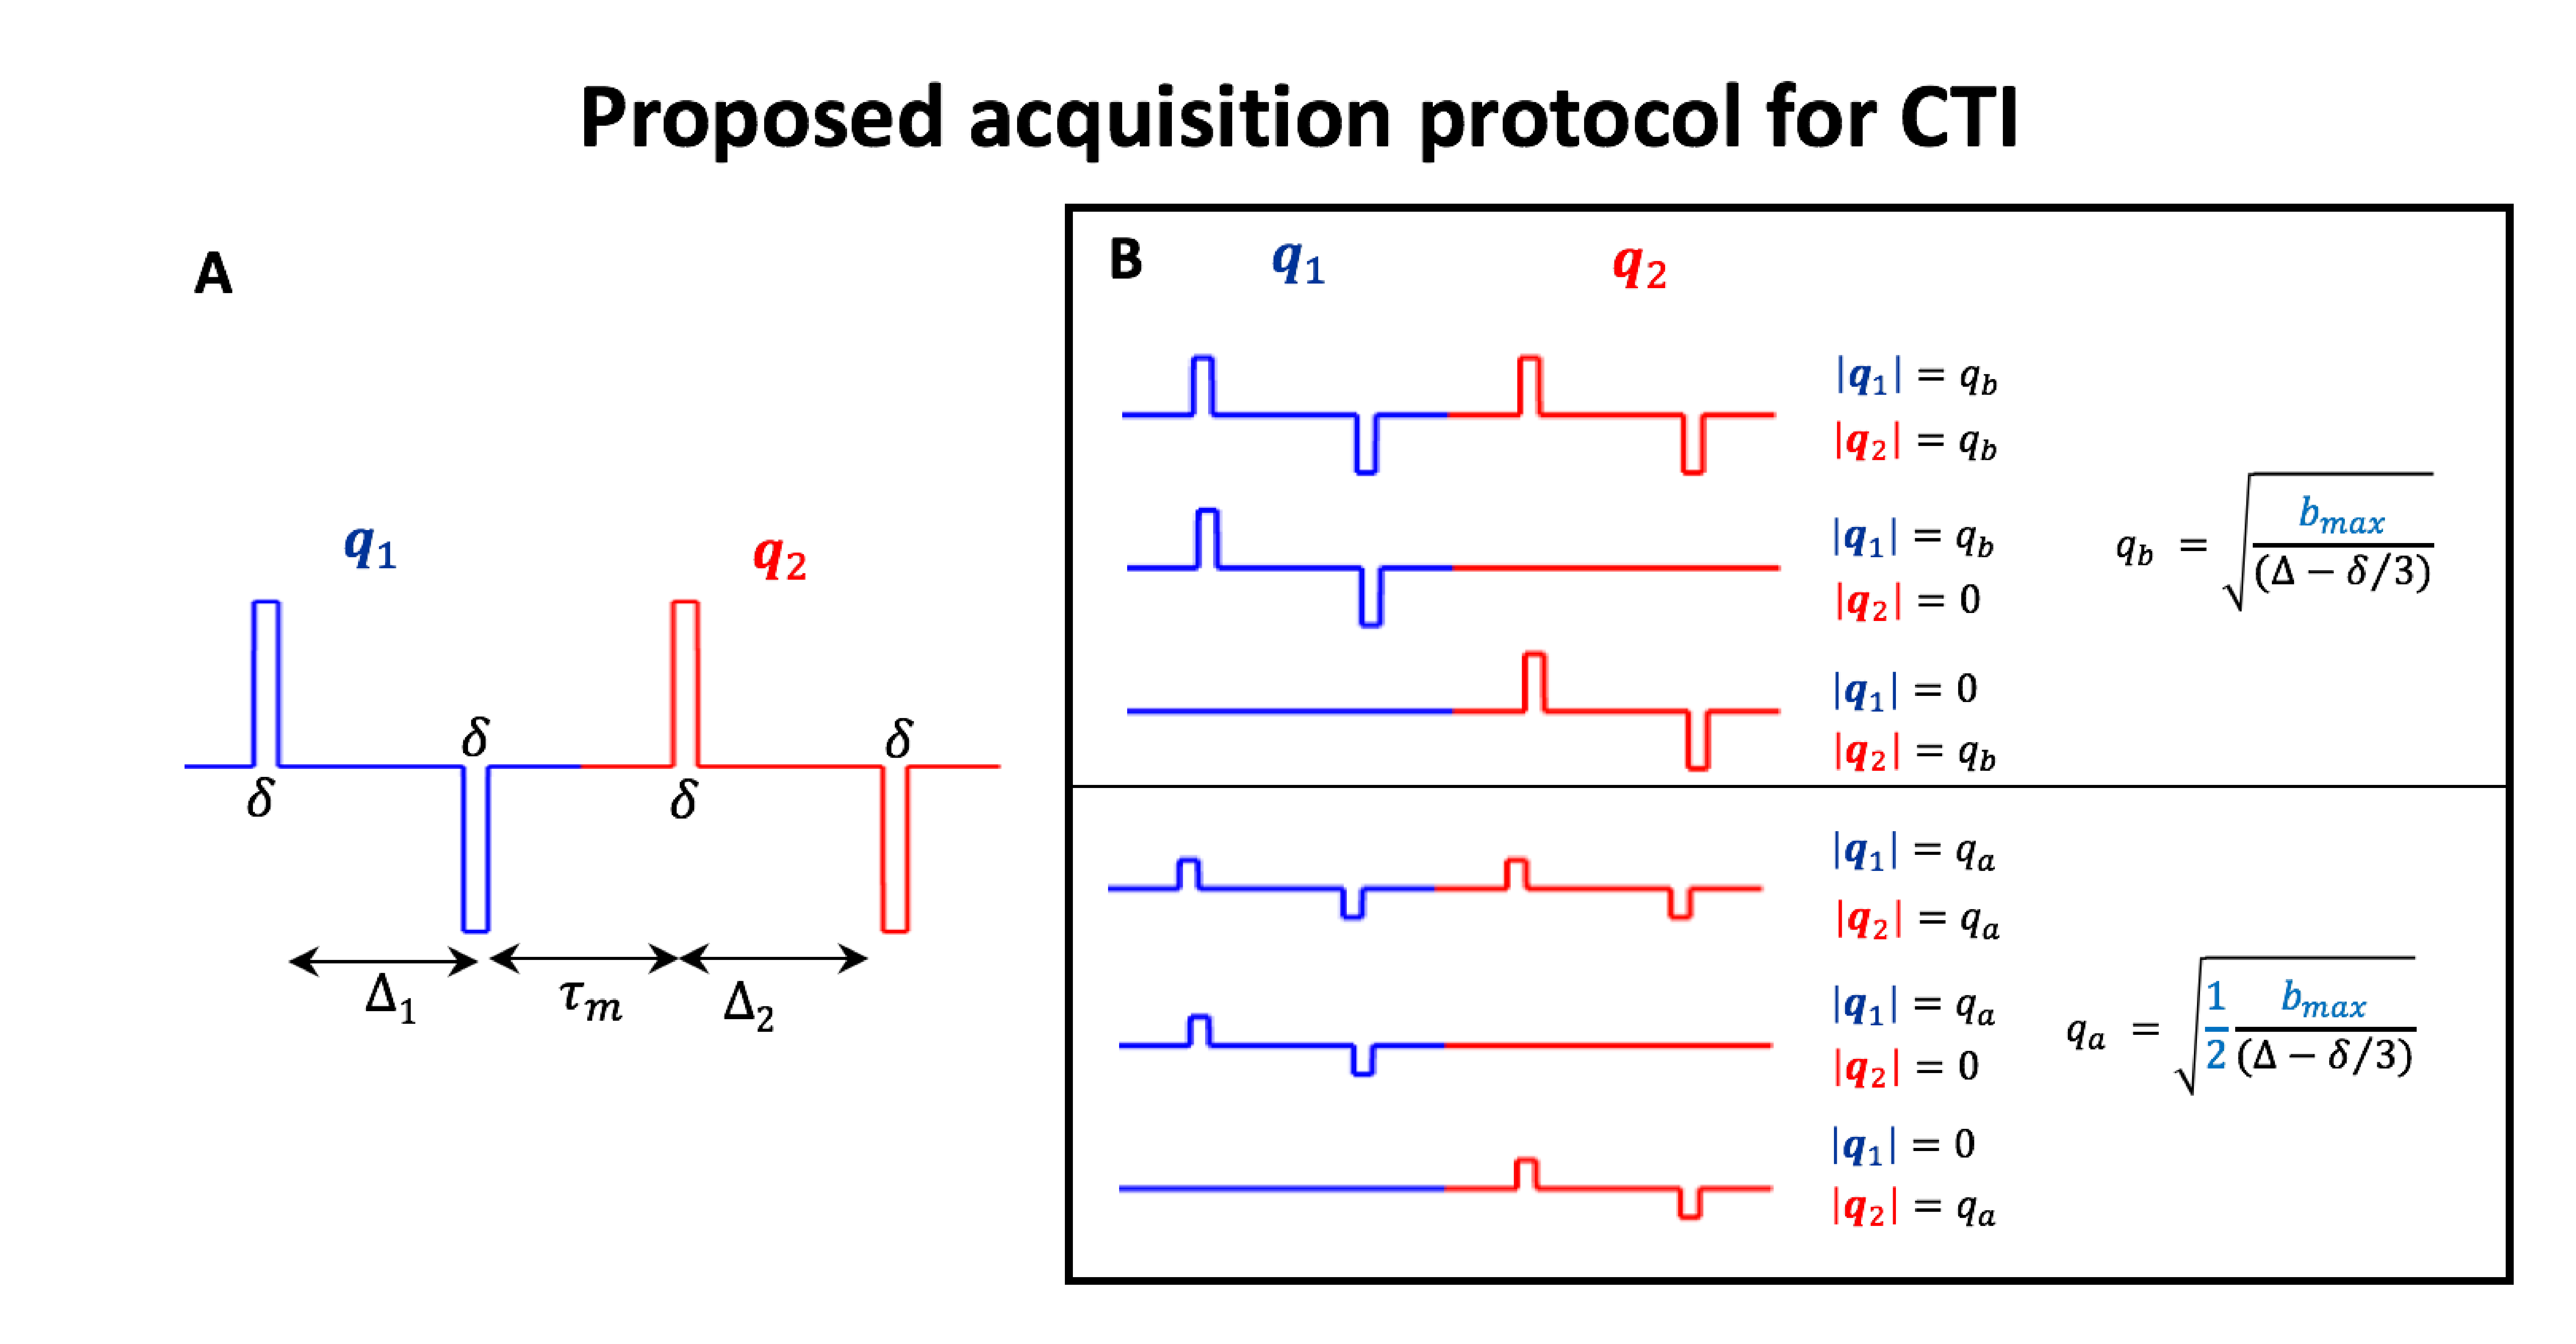
- Theory: CTI relies on the cumulant expansion of the DDE signal14-20. DDE imparts two independent q-vectors ($$$\mathbf{q}_1$$$, $$$\mathbf{q}_2$$$), spanning diffusion times $$$\Delta_{1}=\Delta_{2}=\Delta$$$ separated by a mixing time $$$\tau_{m}$$$ (Fig.2A). At long $$$\tau_{m}$$$, the fourth order cumulant expansion of these signals in multiple compartment non-Gaussian systems is given by11,14-16:
$$\log{E(\mathbf{q}_1,\mathbf{q}_2)}=-\left(q_{1i}q_{1j}+q_{2i}q_{2j}\right )\Delta D_{ij}+\frac{1}{6}\left(q_{1i}q_{1j}q_{1k}q_{1l}+q_{2i}q_{2j}q_{2k}q_{2l}\right )\Delta^2\overline{D}^2W_{ijkl} +\left(q_{1i}q_{1j}q_{2k}q_{2l}\right )\Delta^2C_{ijkl}$$
(Eq.1)
where $$$E(\mathbf{q}_1,\mathbf{q}_2)$$$ is the normalized signal attetuation, $$$D_{ij}$$$ is the diffusion tensor, $$$W_{ijkl}$$$ is the kurtosis tensor, $$$C_{ijkl}$$$ is the covariance tensor, and $$$\overline{D}$$$ is the mean diffusivity. From Eq.1, the sources of kurtosis can be extracted as follows11:
- the total kurtosis $$$K_{T}$$$ can be computed from $$$W_{ijkl}$$$;
- the two inter-compartmental kurtosis sources ($$$K_{aniso}$$$ and $$$K_{iso}$$$) can be extracted from $$$C_{ijkl}$$$;
- an intra-compartmental kurtosis source ($$$K_{intra}$$$) can be estimated as $$$K_{T}-K_{aniso}-K_{iso}$$$, since $$$W_{ijkl}$$$ inclides all sources of kurtosis, while $$$C_{ijkl}$$$ includes only $$$K_{aniso}$$$ and $$$K_{iso}$$$.
- Proposed protocol for CTI: Analogously to DKI, CTI requires at least three measurements with different diffusion-gradient intensities. To decouple $$$W_{ijkl}$$$from $$$C_{ijkl}$$$ CTI also requires acquisitions with unequal wave vectors (i.e., $$$|\mathbf{q}_2|\neq|\mathbf{q}_2|$$$). The combination of q-vector magnitude pairs used herein is summarized in Fig.2B. To resolve the individual elements of $$$C_{ijkl}$$$, , each gradient intensity combination has to be repeated for different directions of $$$\mathbf{q}_1$$$ and$$$\mathbf{q}_2$$$. Here, we used the directions of the 5-design (12 parallel + 60 perpendicular $$$\mathbf{q}_1$$$-$$$\mathbf{q}_2$$$ direction combinations)15 in addition to 45 parallel $$$\mathbf{q}_1$$$-$$$\mathbf{q}_2$$$ directions.
- MRI experiments: Animal experiments were preapproved by the competent institutional and national authorities (European Directive 2010/63).Data was acquired from N=2 female long Evans rats (14/15 weeks old) under anaesthesia (~2.5% Isoflurane, 28% oxygen) on a 9.4 T Bruker Biospec scanner equipped with an 86 mm quadrature transmission coil and a 4-element array reception cryocoil (Bruker).
DDE experiments were performed using the following diffusion parameters: bmax=2ms/μm2 (corresponding to a maximum total b-value of 4ms/μm2, $$$\Delta=\tau_m=$$$=12ms, and $$$\delta$$$=3ms). Additionally, anti-parallel DDE signal $$$E(\mathbf{q}_1,-\mathbf{q}_1)$$$ were acquired for checking the long mixing time approximation16-18.
Other acquisition parameters included: TR/TE=3000/48.5 ms, in-plane resolution = 200×200 μm2, slice thickness = 1mm, 2 averages, partial fourier acceleration = 1.40, total acquisition time ~2h.
Results
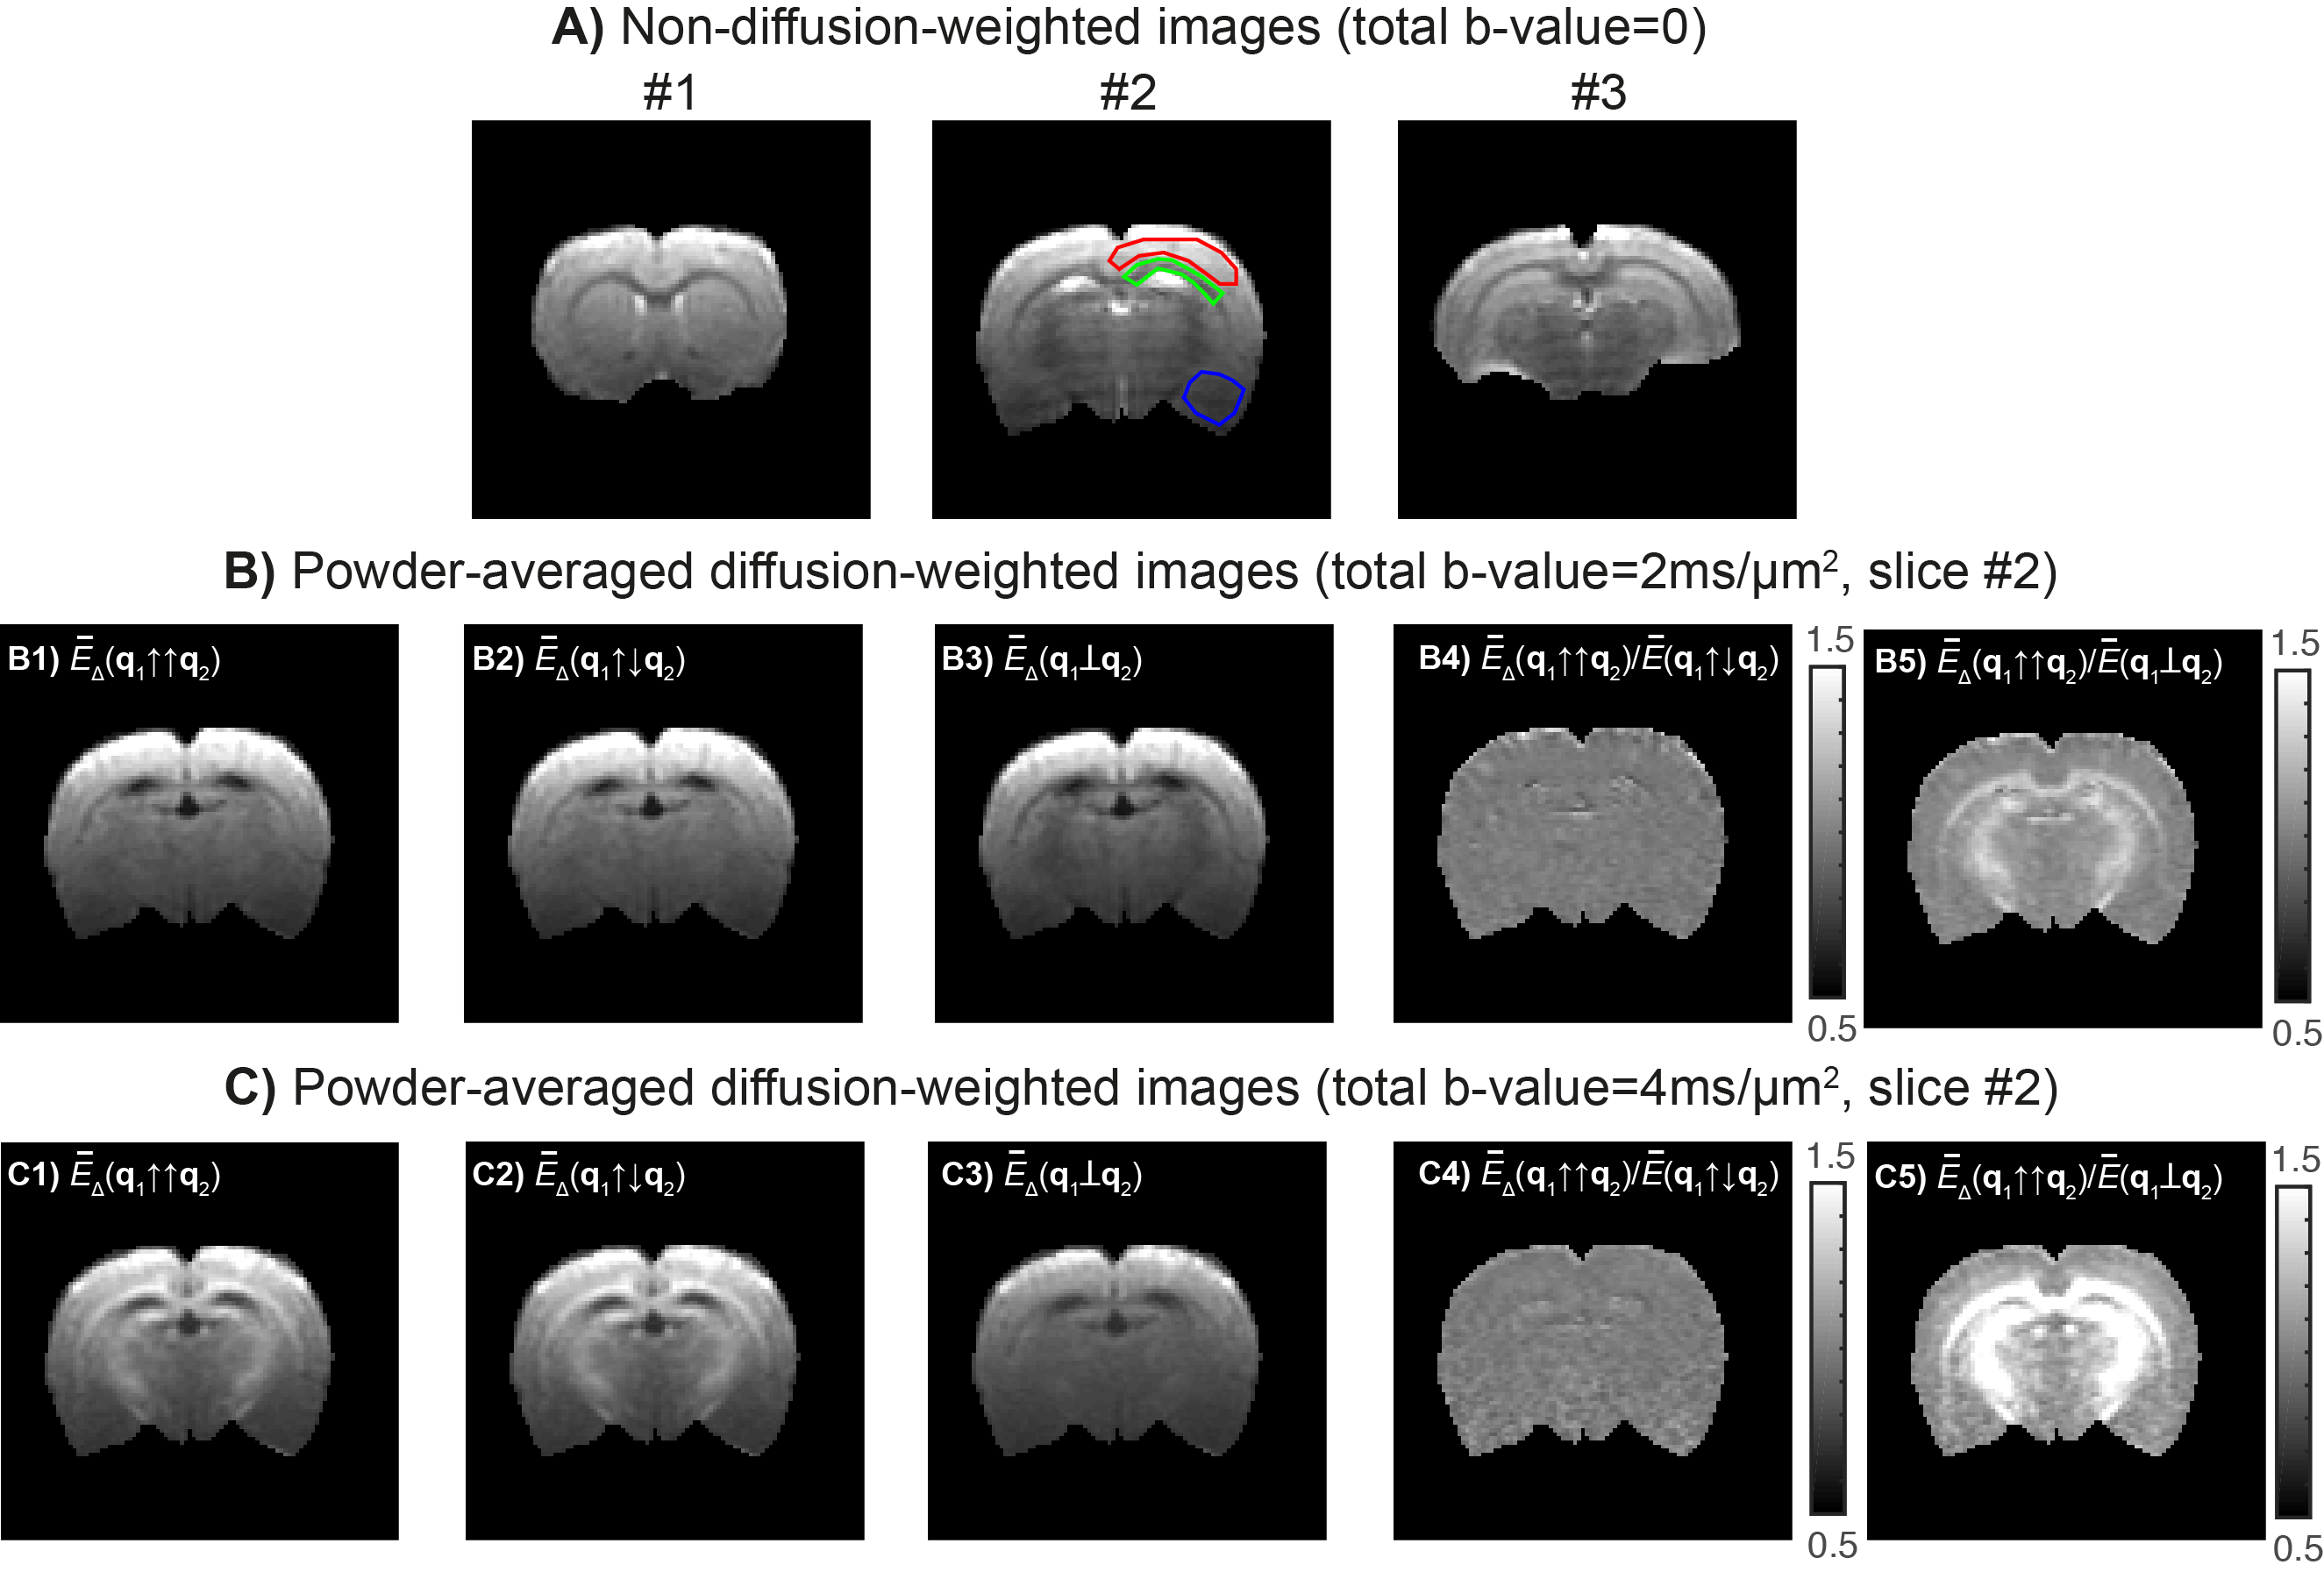
- Raw data is shown in Fig.3. ROIs placed in superior white matter (WM) and grey matter (GM) presented SNRb=0 of 41±.5 and 41±4, respectively (green and red ROIs, Fig.3A). Inferior brain regions had lower SNRb=0 (26.5±0.5 for the blue ROI) due to the cryocoil profile. Powder-averaged signal decays for different total b-values of 2 and 4ms/mm2 and for parallel, anti-parallel and perpendicular DDE experiments are displayed in Fig.3B and Fig.3C.
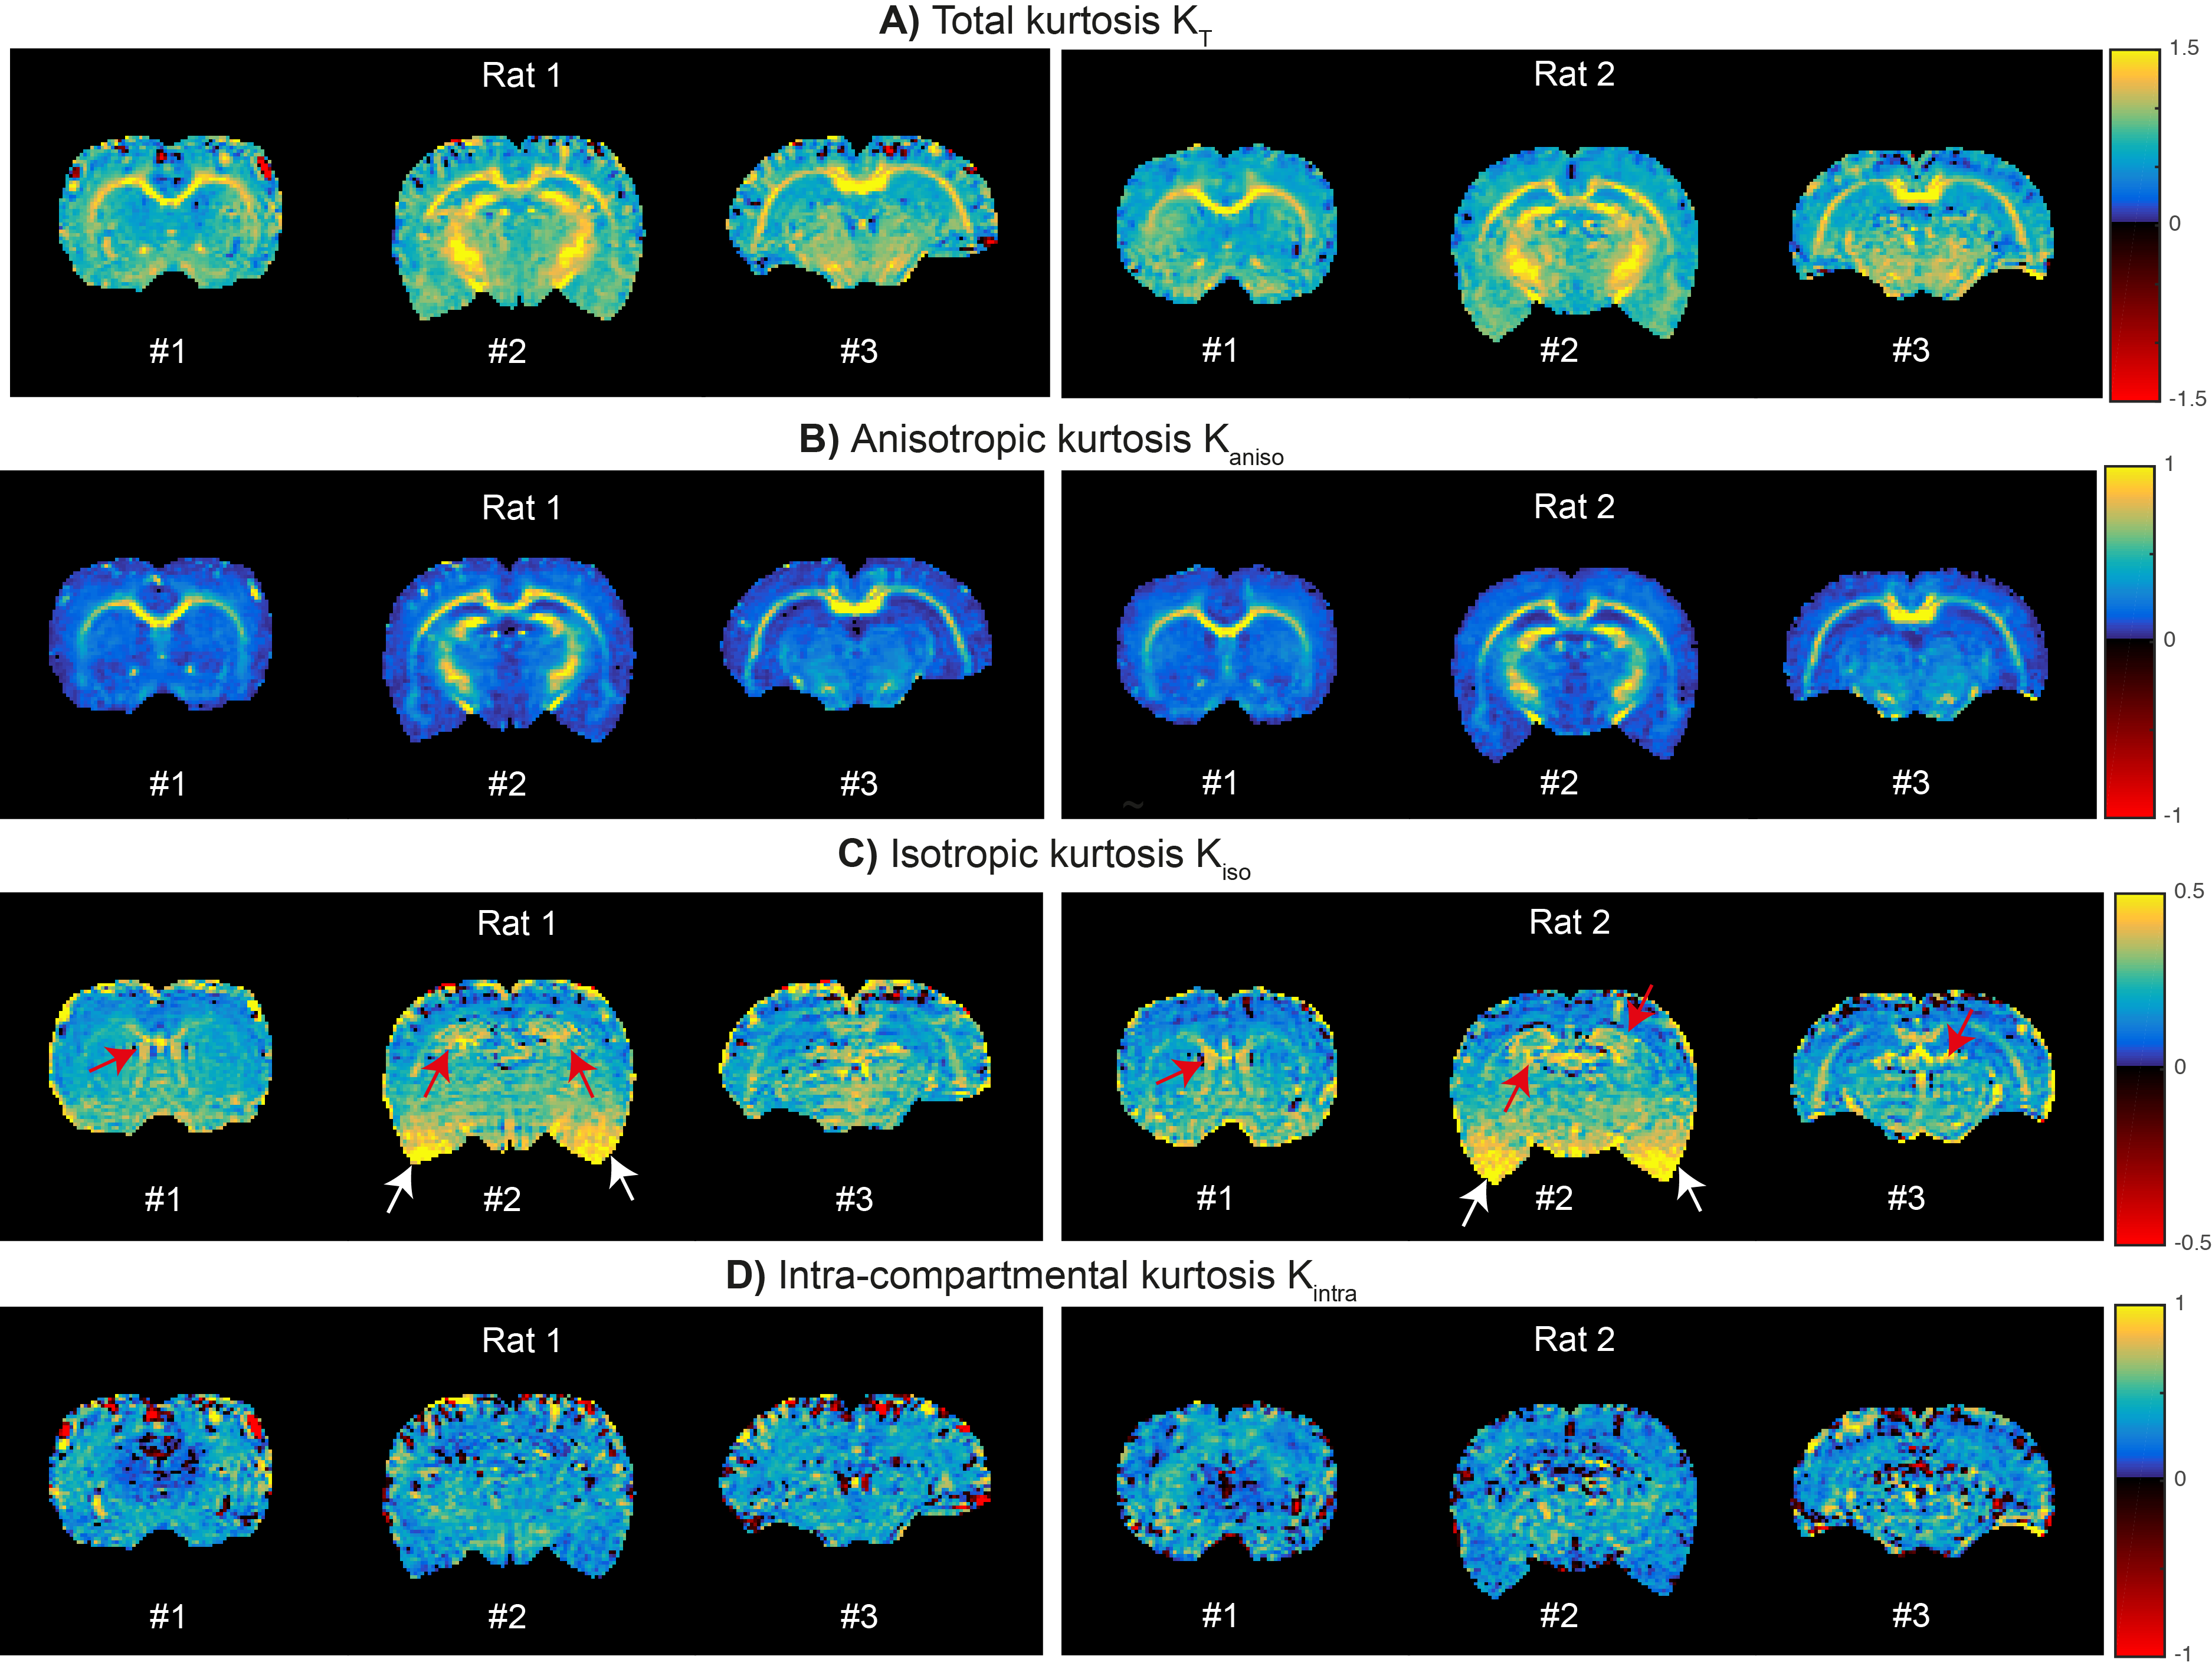
- Maps resolving different kurtosis sources using CTI are displayed in Fig. 4 for all slices of both animals scanned. As expected, $$$K_T$$$ is higher than any of its sources (Fig.4A). $$$K_{aniso}$$$dominates in white matter (Fig.4B), while $$$K_{iso}$$$ is high in regions near the ventricle (Fig.4C, red arrows). Higher $$$K_{iso}$$$ in inferior brain regions are due to noise biases (Fig.4C, white arrows). $$$K_{intra}$$$ is consistently positive for both animals (Fig. 4D).
Discussion
CTI can resolve different kurtosis sources in a model-free fashion and without relying on the Gaussian regime approximation. The long mixing time requirement was experimentally verified by a near unity ratio of parallel and anti-parallel DDE signals (Fig.3B4 and Fig.3C4). In this regime, CTI’s $$$K_{aniso}$$$estimates are sensitive to the high microscopic anisotropy in WM. These measures can be used to study WM without confounding fiber dispersion effects. Interestingly, $$$K_{iso}$$$ highlights regions with increased free water partial volume effects, suggesting that $$$K_{iso}$$$ may be useful for detecting edema. We also presented the first in vivo CTI’s $$$K_{intra}$$$ estimates, whose positive values might reflect extra-cellular non-Gaussian diffusion effect or axial intra-cellular short-range disorder21. Future studies accelerating CTI further and investigating the effects of higher-order terms and parameters noise robustness can increase CTI’s potential value even further.Conclusion
CTI is compatible with in vivo acquisitions, and its contrasts reflect the different kurtosis sources, including intra-compartmental kurtosis, thereby offering a more complete characterization of kurtosis in vivo. Moreover, the more general CTI framework might be used to validate and calibrate faster q-trajectory encoding acquisitions.Acknowledgements
This study was funded by the European Research Council (ERC) (agreement No. 679058).References
1. Jensen JH, Helpern JA, Ramani A, et al. Diffusional Kurtosis Imaging: The Quantification of Non-Gaussian Water Diffusion by Means of Magnetic Resonance Imaging, Magn. Reson. Med. 2005; 53: 1432–1440.
2. Cheung JS, Wang E, Lo EH, Sun PZ. Stratification of heterogeneous diffusion MRI ischemic lesion with kurtosis imaging: evaluation of mean diffusion and kurtosis MRI mismatch in an animal model of transient focal ischemia. Stroke 2012; 43: 2252–4. doi: 10.1161/STROKEAHA.112.661926
3. Falangola MF, Jensen JH, Babb JS, et al. Age-related non-Gaussian diffusion patterns in the prefrontal brain. J. Magn. Reson. Imaging 2008; 28: 1345–1350. doi:10.1002/jmri.21604
4. Lasič S, Szczepankiewicz F, Eriksson S, et al. Microanisotropy imaging: quantification of microscopic diffusion anisotropy and orientational order parameter by diffusion MRI with magic-angle spinning of the q-vector. Front. Phys. 2014; 2: 11. doi:10.3389/fphy.2014.00011
5. Westin CF, Knutsson H, Pasternak O, et al. Q-space trajectory imaging for multidimensional diffusion MRI of the human brain. NeuroImage 2016; 135: 345-362 doi:10.1016/j.neuroimage.2016.02.039
6. Szczepankiewicz F, Lasič S, van Westen D, et al. Quantification of microscopic diffusion anisotropy disentangles effects of orientation dispersion from microstructure: applications in healthy volunteers and in brain tumors. Neuroimage 2015; 104: 241–52. doi:10.1016/j.neuroimage.2014.09.057
7. Szczepankiewicz F, van Westen D, Englund E, et al. The link between diffusion MRI and tumor heterogeneity: Mapping cell eccentricity and density by diffusional variance decomposition (DIVIDE). Neuroimage 2016; 142: 522–532. doi: 10.1016/J.NEUROIMAGE.2016.07.038
8. Nilsson M, Szczepankiewicz F, Brabec J, et al. Tensor-valued diffusion MRI in under 3 minutes: An initial survey of microscopic anisotropy and tissue heterogeneity in intracranial tumors. Magn Reson Med 2019; 83(2): 608-620. doi: 10.1002/mrm.27959.
9. Jespersen SN, Olesen JL, Hansen B, Shemesh N. Diffusion time dependence of microstructural parameters in fixed spinal cord. Neuroimage 2018; 182: 329–342. doi:10.1016/J.NEUROIMAGE.2017.08.039
10. Jespersen SN, Olesen JL, Ianuş A, Shemesh N. Effects of nongaussian diffusion on “isotropic diffusion” measurements: An ex-vivo microimaging and simulation study. J. Magn. Reson. 2019; 300: 84–94. doi: 10.1016/J.JMR.2019.01.007
11. Henriques RN, Jespersen S, Shemesh N. Correlation Tensor Imaging (CTI): resolving diffusion sources of non-Gaussian diffusion. In ISMRM 2019.
12. Mitra PP. Multiple wave-vector extensions of the NMR pulsed-field-gradient spin-echo diffusion measurement. Phys. Rev. B 1995; 51: 15074–15078. doi: 10.1103/PhysRevB.51.15074
13. Shemesh N, Jespersen SN, Alexander DC, et al. Conventions and nomenclature for double diffusion encoding NMR and MRI. Magn. Reson. Med. 2016: 75: 82–87. doi:10.1002/mrm.25901
14. Jespersen SN. Equivalence of double and single wave vector diffusion contrast at low diffusion weighting. NMR in Biomed. 2011; 25(6): 813-818. doi: 10.1002/nbm.1808.
15. Jespersen SN, Lundell H, Sønderby CK, Dyrby TB. Orientationally invariant metrics of apparent compartment eccentricity from double pulsed field gradient diffusion experiments. NMR Biomed. 2013; 26(12):1647-62. doi: 10.1002/nbm.2999.
16. Jespersen SN, Buhl N. The displacement correlation tensor: Microstructure, ensemble anisotropy and curving fibers. J. Magn. Reson. 2011; 208: 34–43.doi: 10.1016/j.jmr.2010.10.003.
17. Koch MA, Finsterbush J. Compartment size estimation with double wave vector diffusion-weighted imaging. Magn. Reson. Med. 2008; 60(1); 90-101. doi:10.1002/mrm.21514
18. Özarslan E. Compartment shape anisotropy (CSA) revealed by double pulsed field gradient MR. J Magn Reson. 2009;199: 56–67.
19. Paulsen JL, Özarslan E, Komlosh ME et al. Detecting compartmental non-Gaussian diffusion with symmetrized double-PFG MRI. NMR Biomed. 2015; 28: 1550-6. doi: 10.1002/nbm.3363
20. Jensen JH, Hui ES, Helpern JA. Double-pulsed diffusional kurtosis imaging. NMR Biomed. 2014; 27:363-370. doi: 10.1002/nbm.3094
21. Dhital B, Kellner E, Kiselev VG, Reisert M. The absence of restricted water pool in brain white matter. Neuroimage 2018; 182: 398-406. doi:10.1016/j.neuroimage.2017.10.051
Figures