0716
Stick power law scaling in neurons withstands realistic curvature and branching1Center of Functionally Integrative Neuroscience (CFIN) and MINDLab, Department of Clinical Medicine, Aarhus University, Aarhus, Denmark, 2Department of physics and Astronomy, Aarhus University, Aarhus, Denmark
Synopsis
A main idea contained in the standard model of diffusion is to model neurons with zero-width sticks. A resulting signature is the prediction that in the large b limit, the isotropically averaged signal scales as $$$1/\sqrt{b}$$$ which has been verified in white matter but not gray matter. This has multiple proposed causes including dendrite curvature and branching. Here, we report on Monte Carlo simulations in 3D reconstructed neurons and find that branching and curvature do not break the power law scaling. On the other hand,the soma is found to limit the regime in which stick scaling is observed.
Introduction
The widely used ”standard model” of diffusion in the brain is a multicompartment Gaussian view of tissue as consisting of intra-neurite and extra-neurite water, with the intra-neuritic part behaving as cylinders with effectively zero diameter1-4. This gives rise to the prediction of $$$1/\sqrt{b}$$$ scaling of the isotropically averaged signal at large b-values, which has been verified in human brain white matter5-6. In contrast, this power law was not observed in gray matter6, which has been suggested to be caused by effects such as water exchange across dendrites, cell soma contributions, or dendrite curvature and branching6-7. Here, we use Monte Carlo simulations of diffusion in 3D reconstructed neurons from NeuroMorpho.Org to investigate whether power law scaling can be observed even in the presence of cell bodies and dendrite deviations from sticks, such as e.g. curvature and branching.Methods
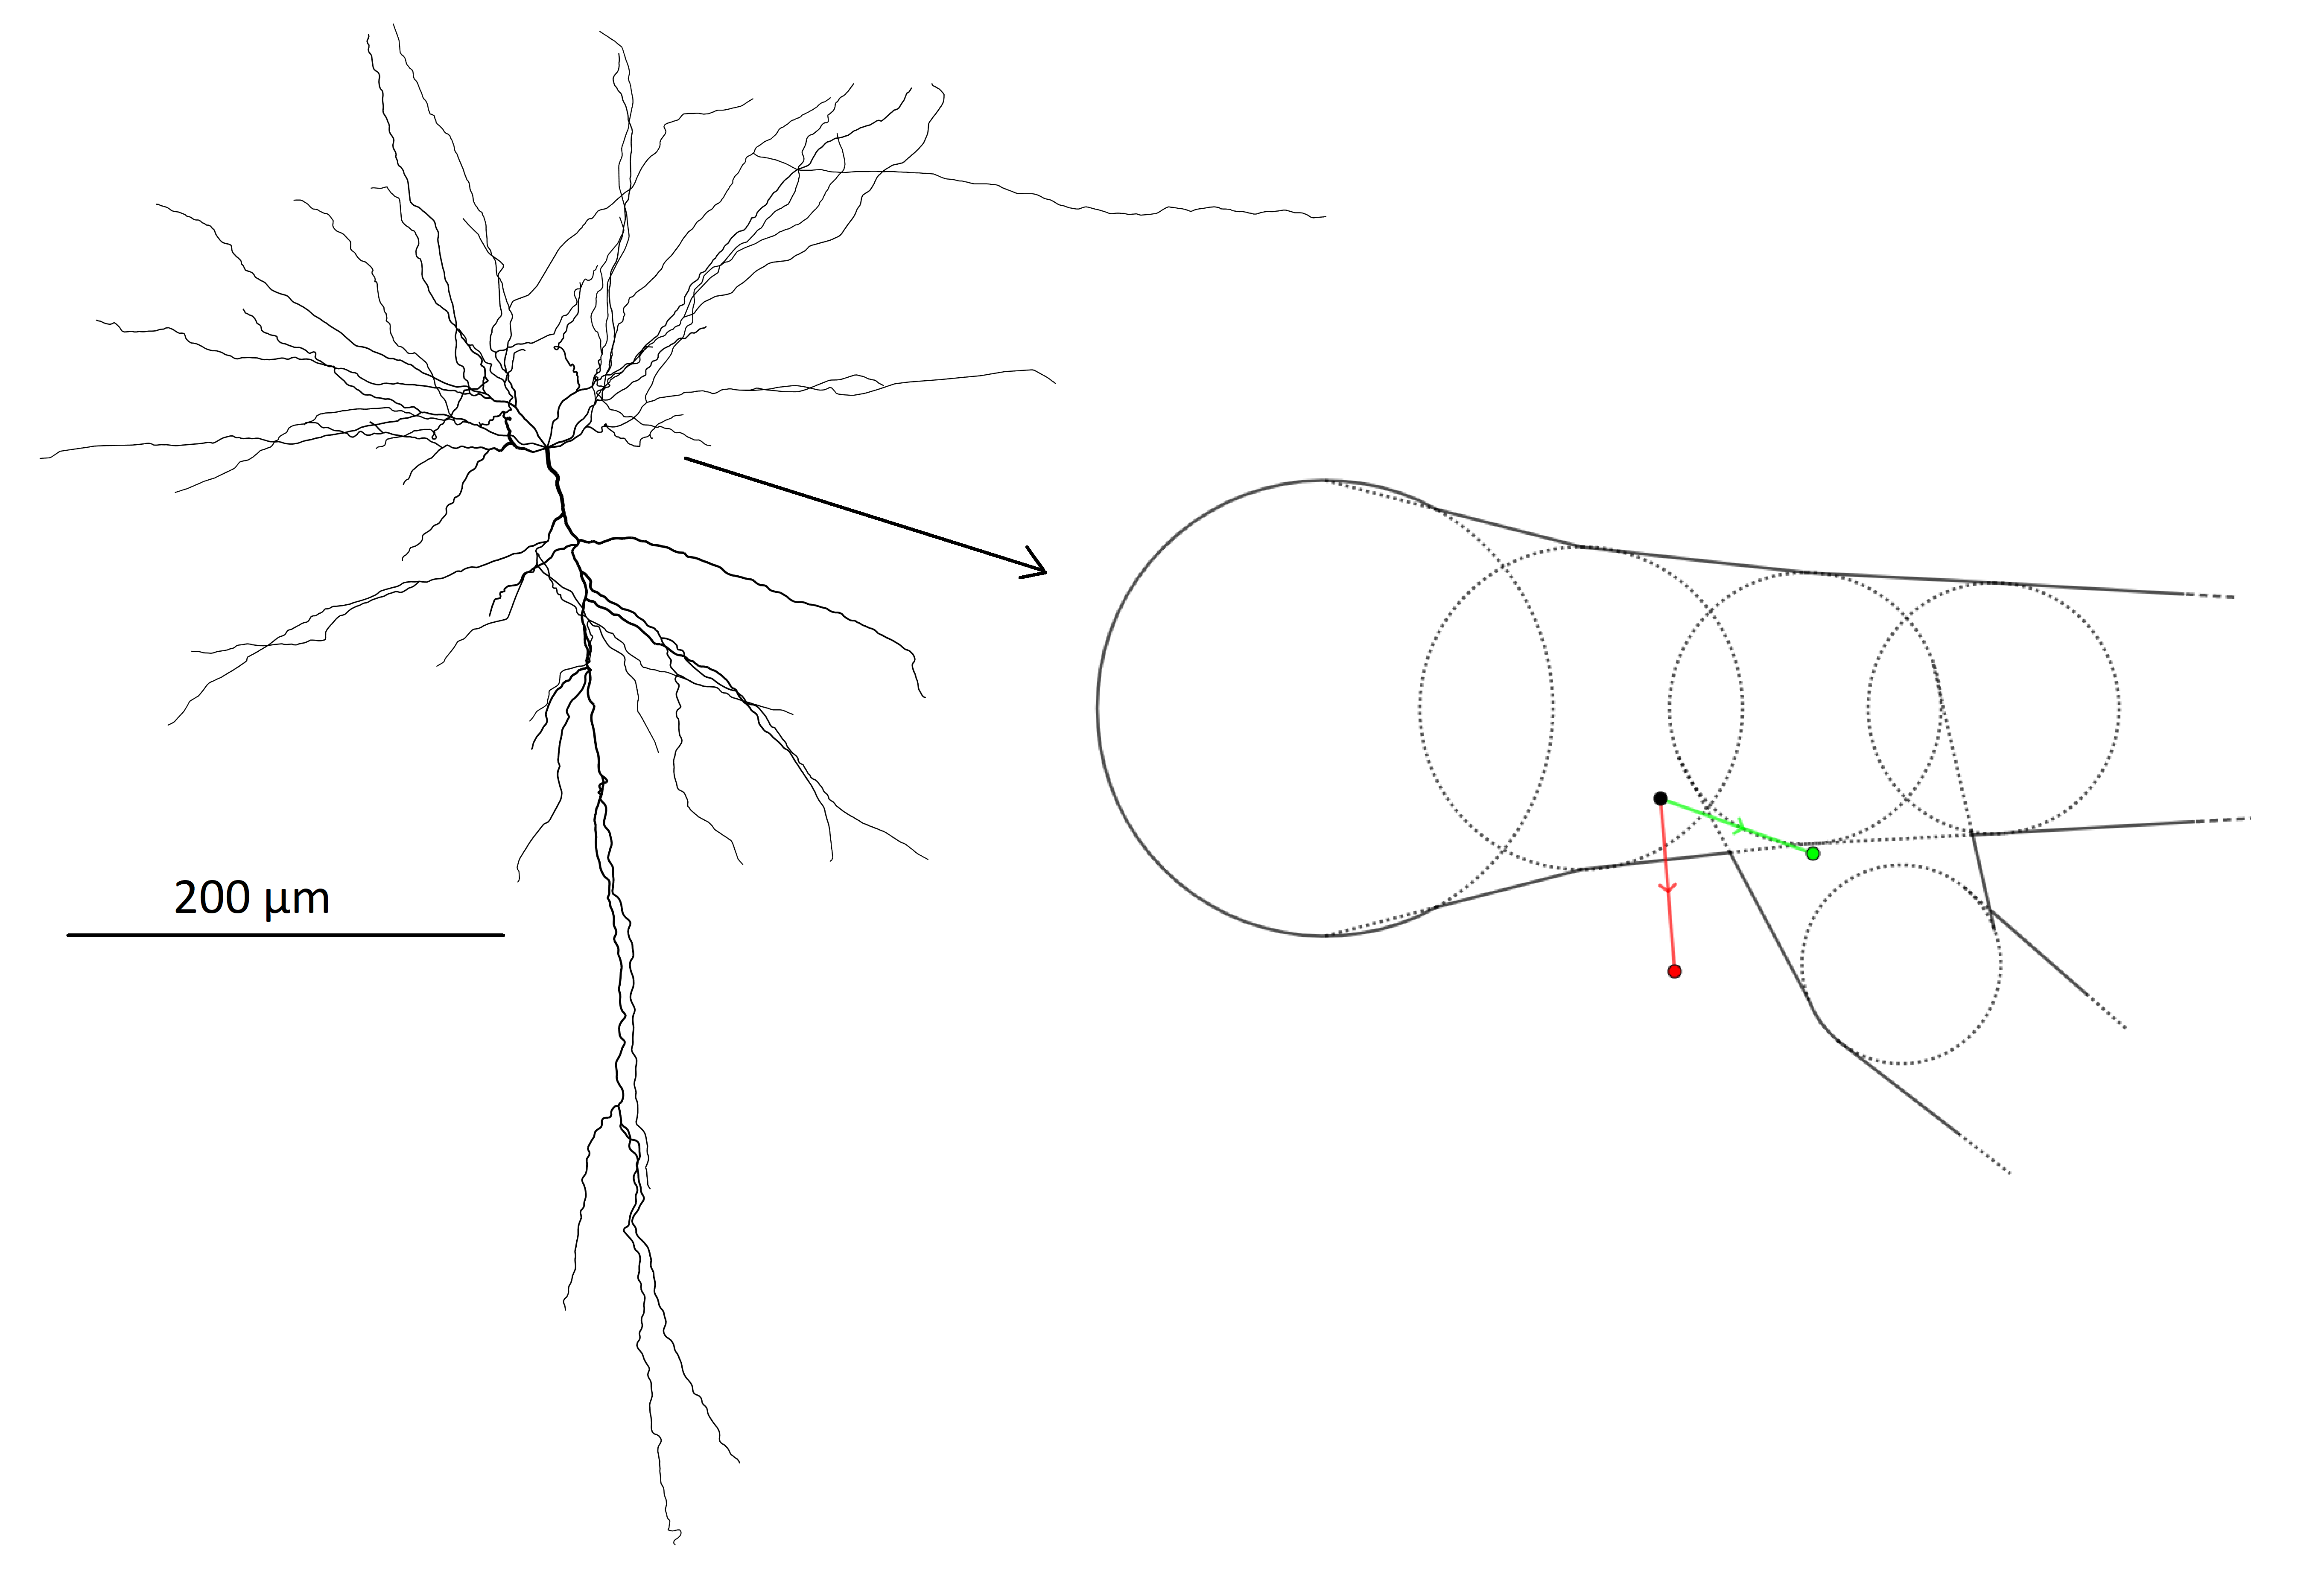
We consider diffusion in pyramidal cells which are one of the main types of neurons in the cortex8. The neurons are from human brain and obtained from the NeuroMorpho.Org database9 under reconstructions from the Allen Brain Atlas10. In these data, the cell structures are represented by connected nodes with associated radii. From these, we approximated the cell geometry by assigned to each node a corresponding sphere and to each node connection a truncated cone making the dendrite diameter change linearly between neighbours (see fig. 1). The cell soma is modeled as a single sphere with a diameter chosen to reproduce the soma surface area estimated from microscopy as reported in the NeuroMorpho database. Finally, the axons of the cells were incompletely characterized and therefore disregarded.The dMRI signal was generated by Monte Carlo simulating one million particles in five neurons each with a number of particles in proportion its relative volume. Trajectories were generated by updating the particle positions with normally distributed steps at each time point with a time resolution resulting in a rms displacement of 0.13 mum (on the order of 1/10 of typical dendrite diameters). After each step, it is evaluated whether each particle remains within the cell structure and if not, the violating particle’s step is rolled back and repeated until a valid position is achieved.
Results
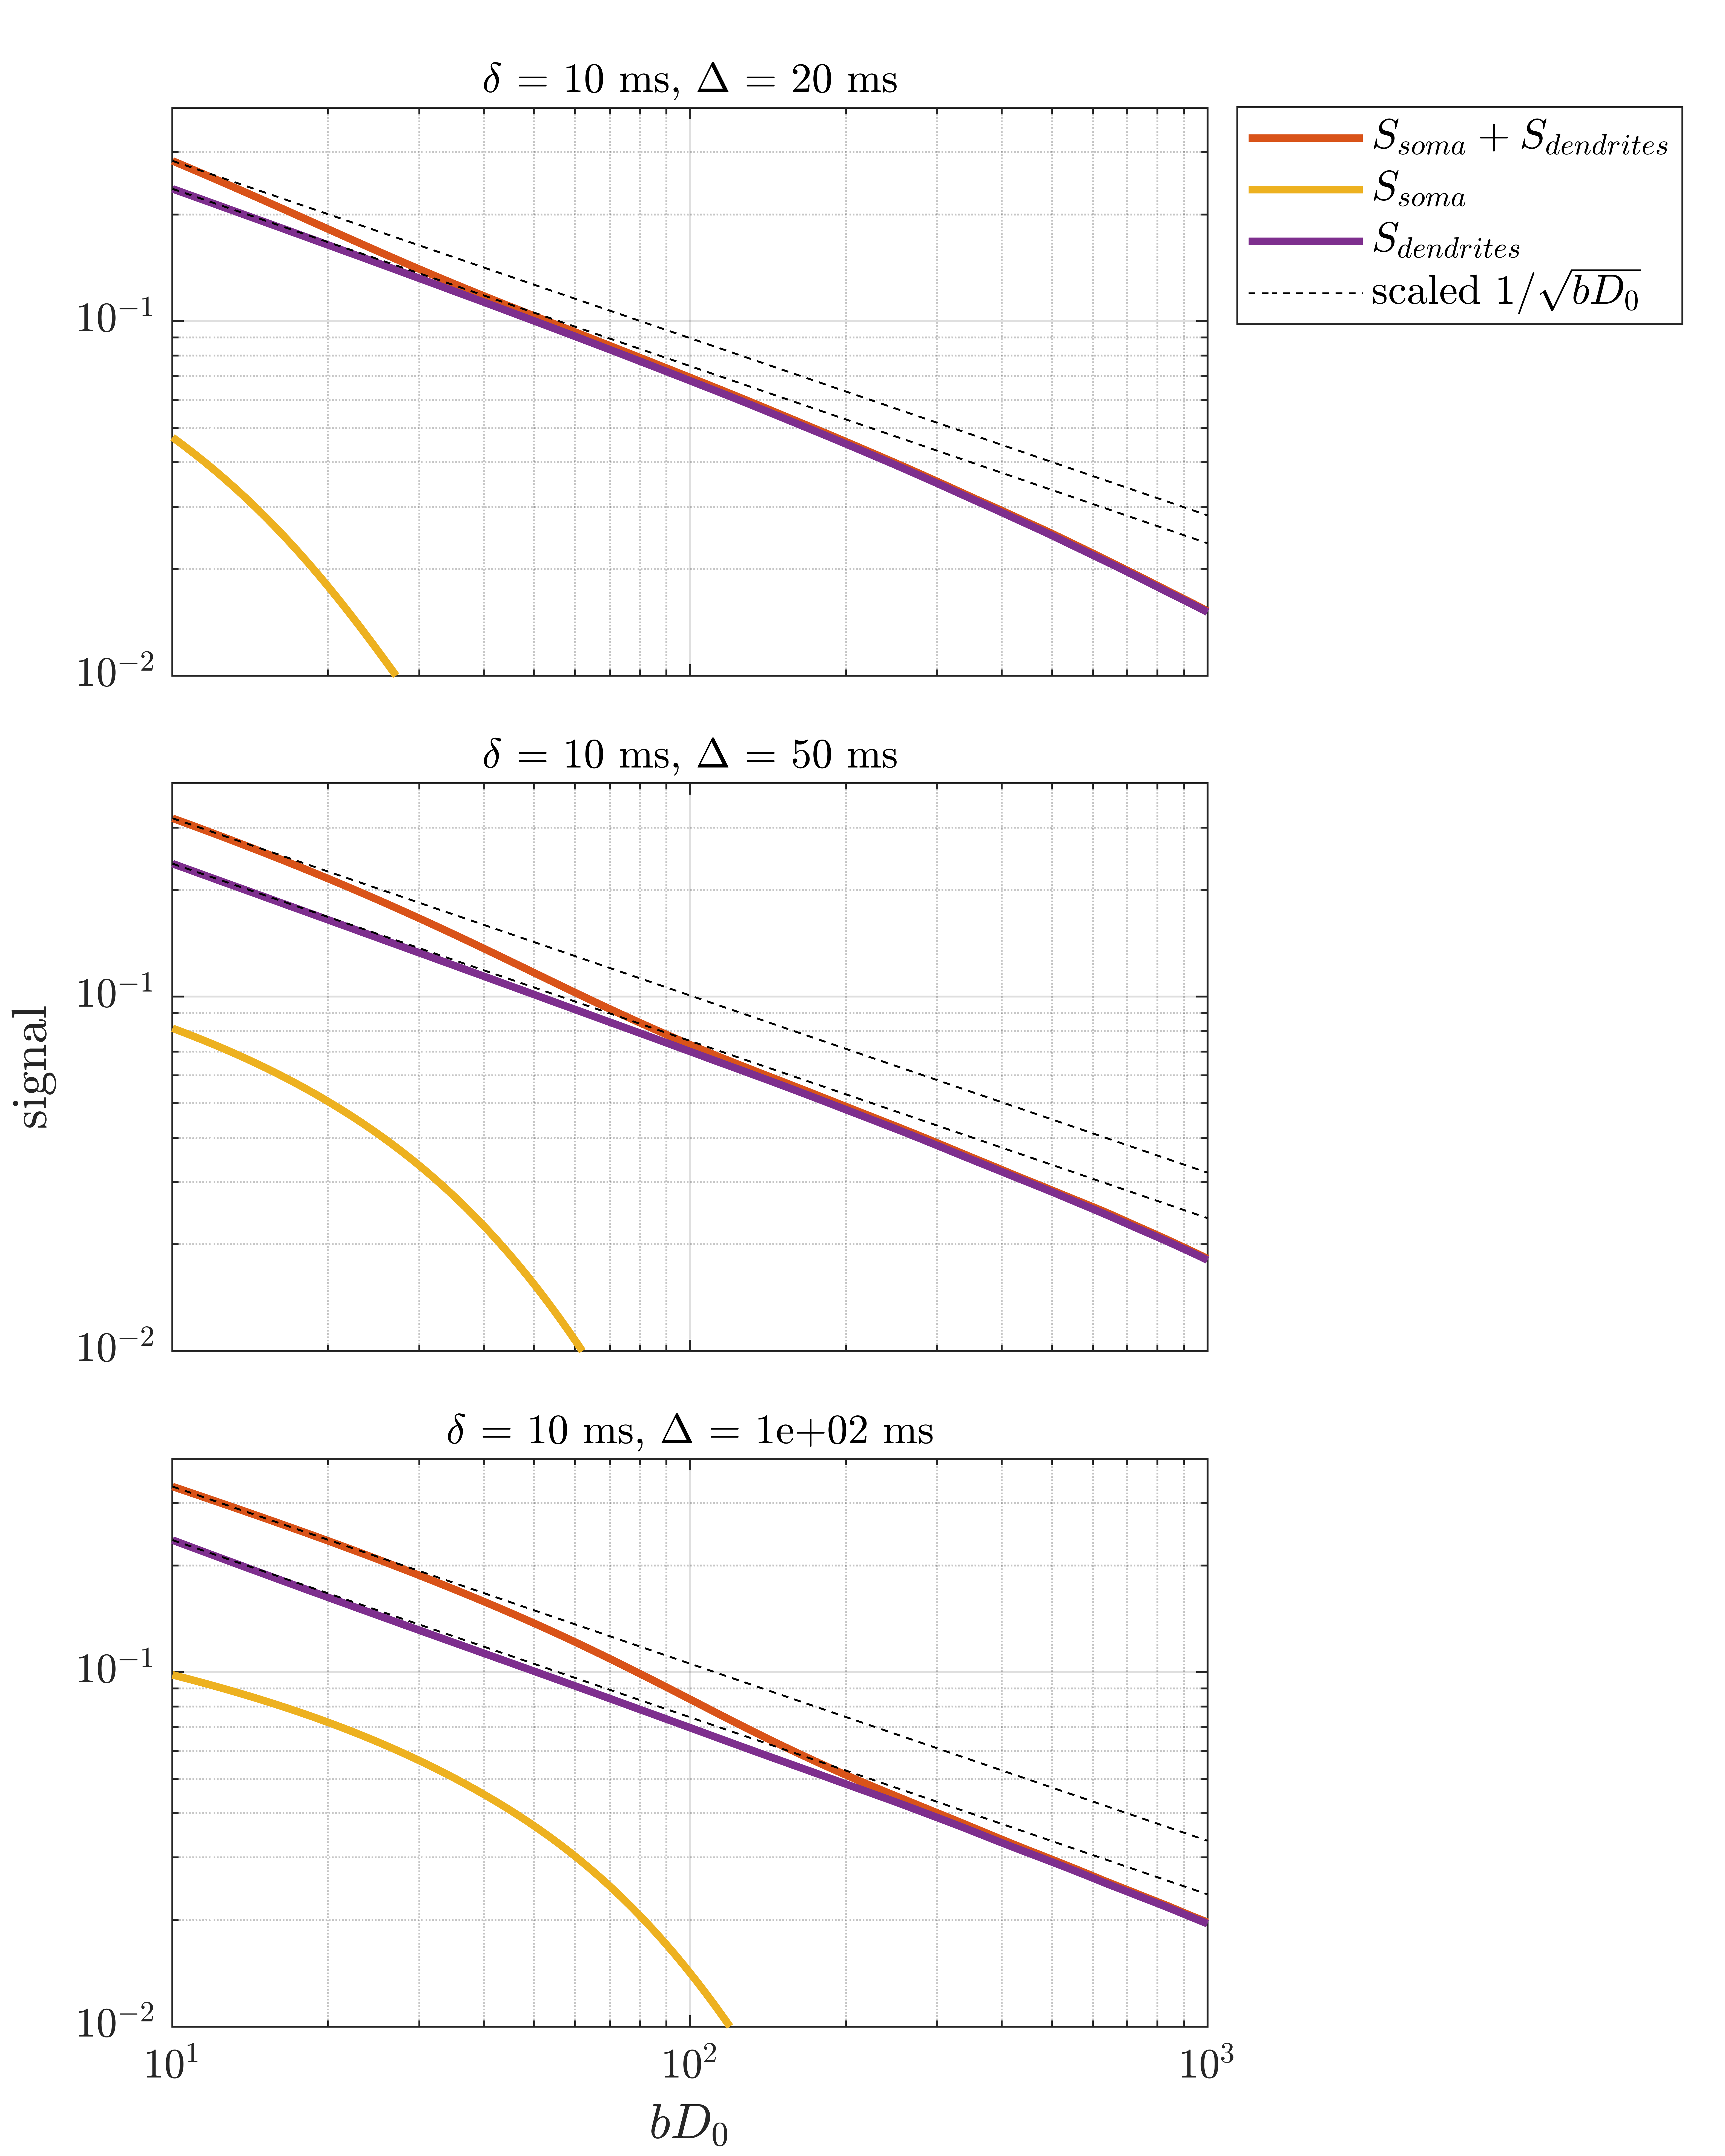
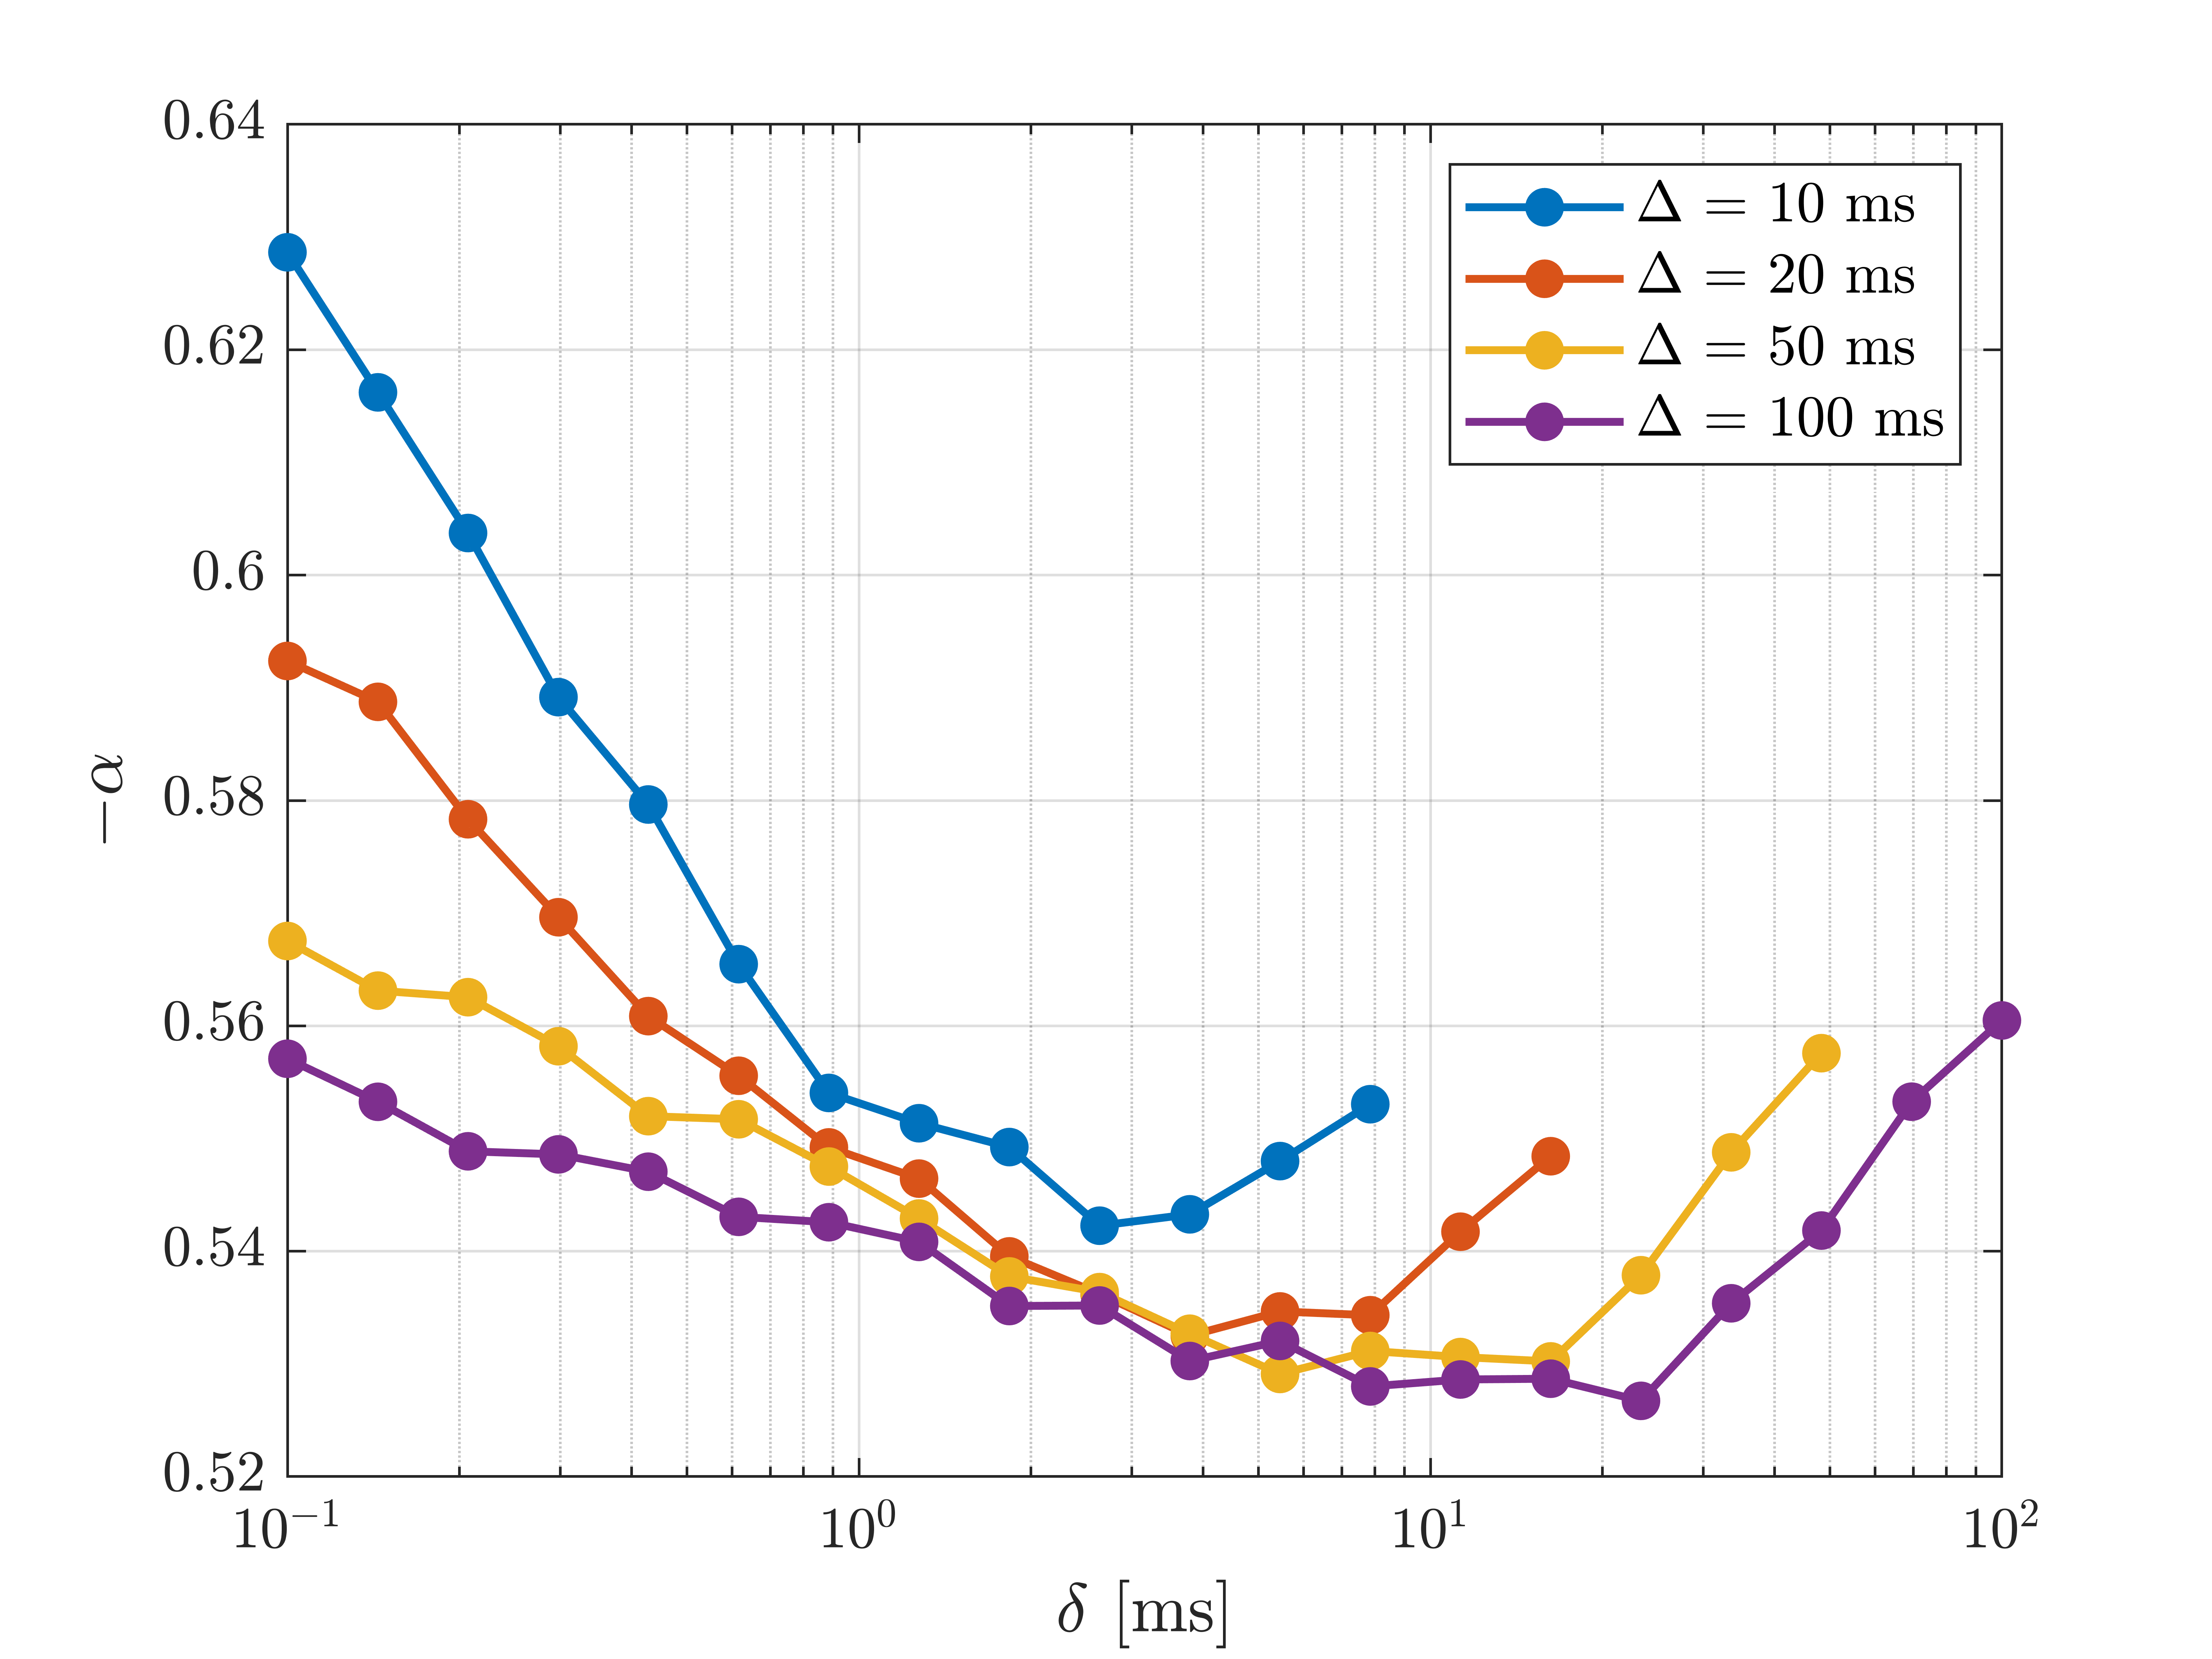
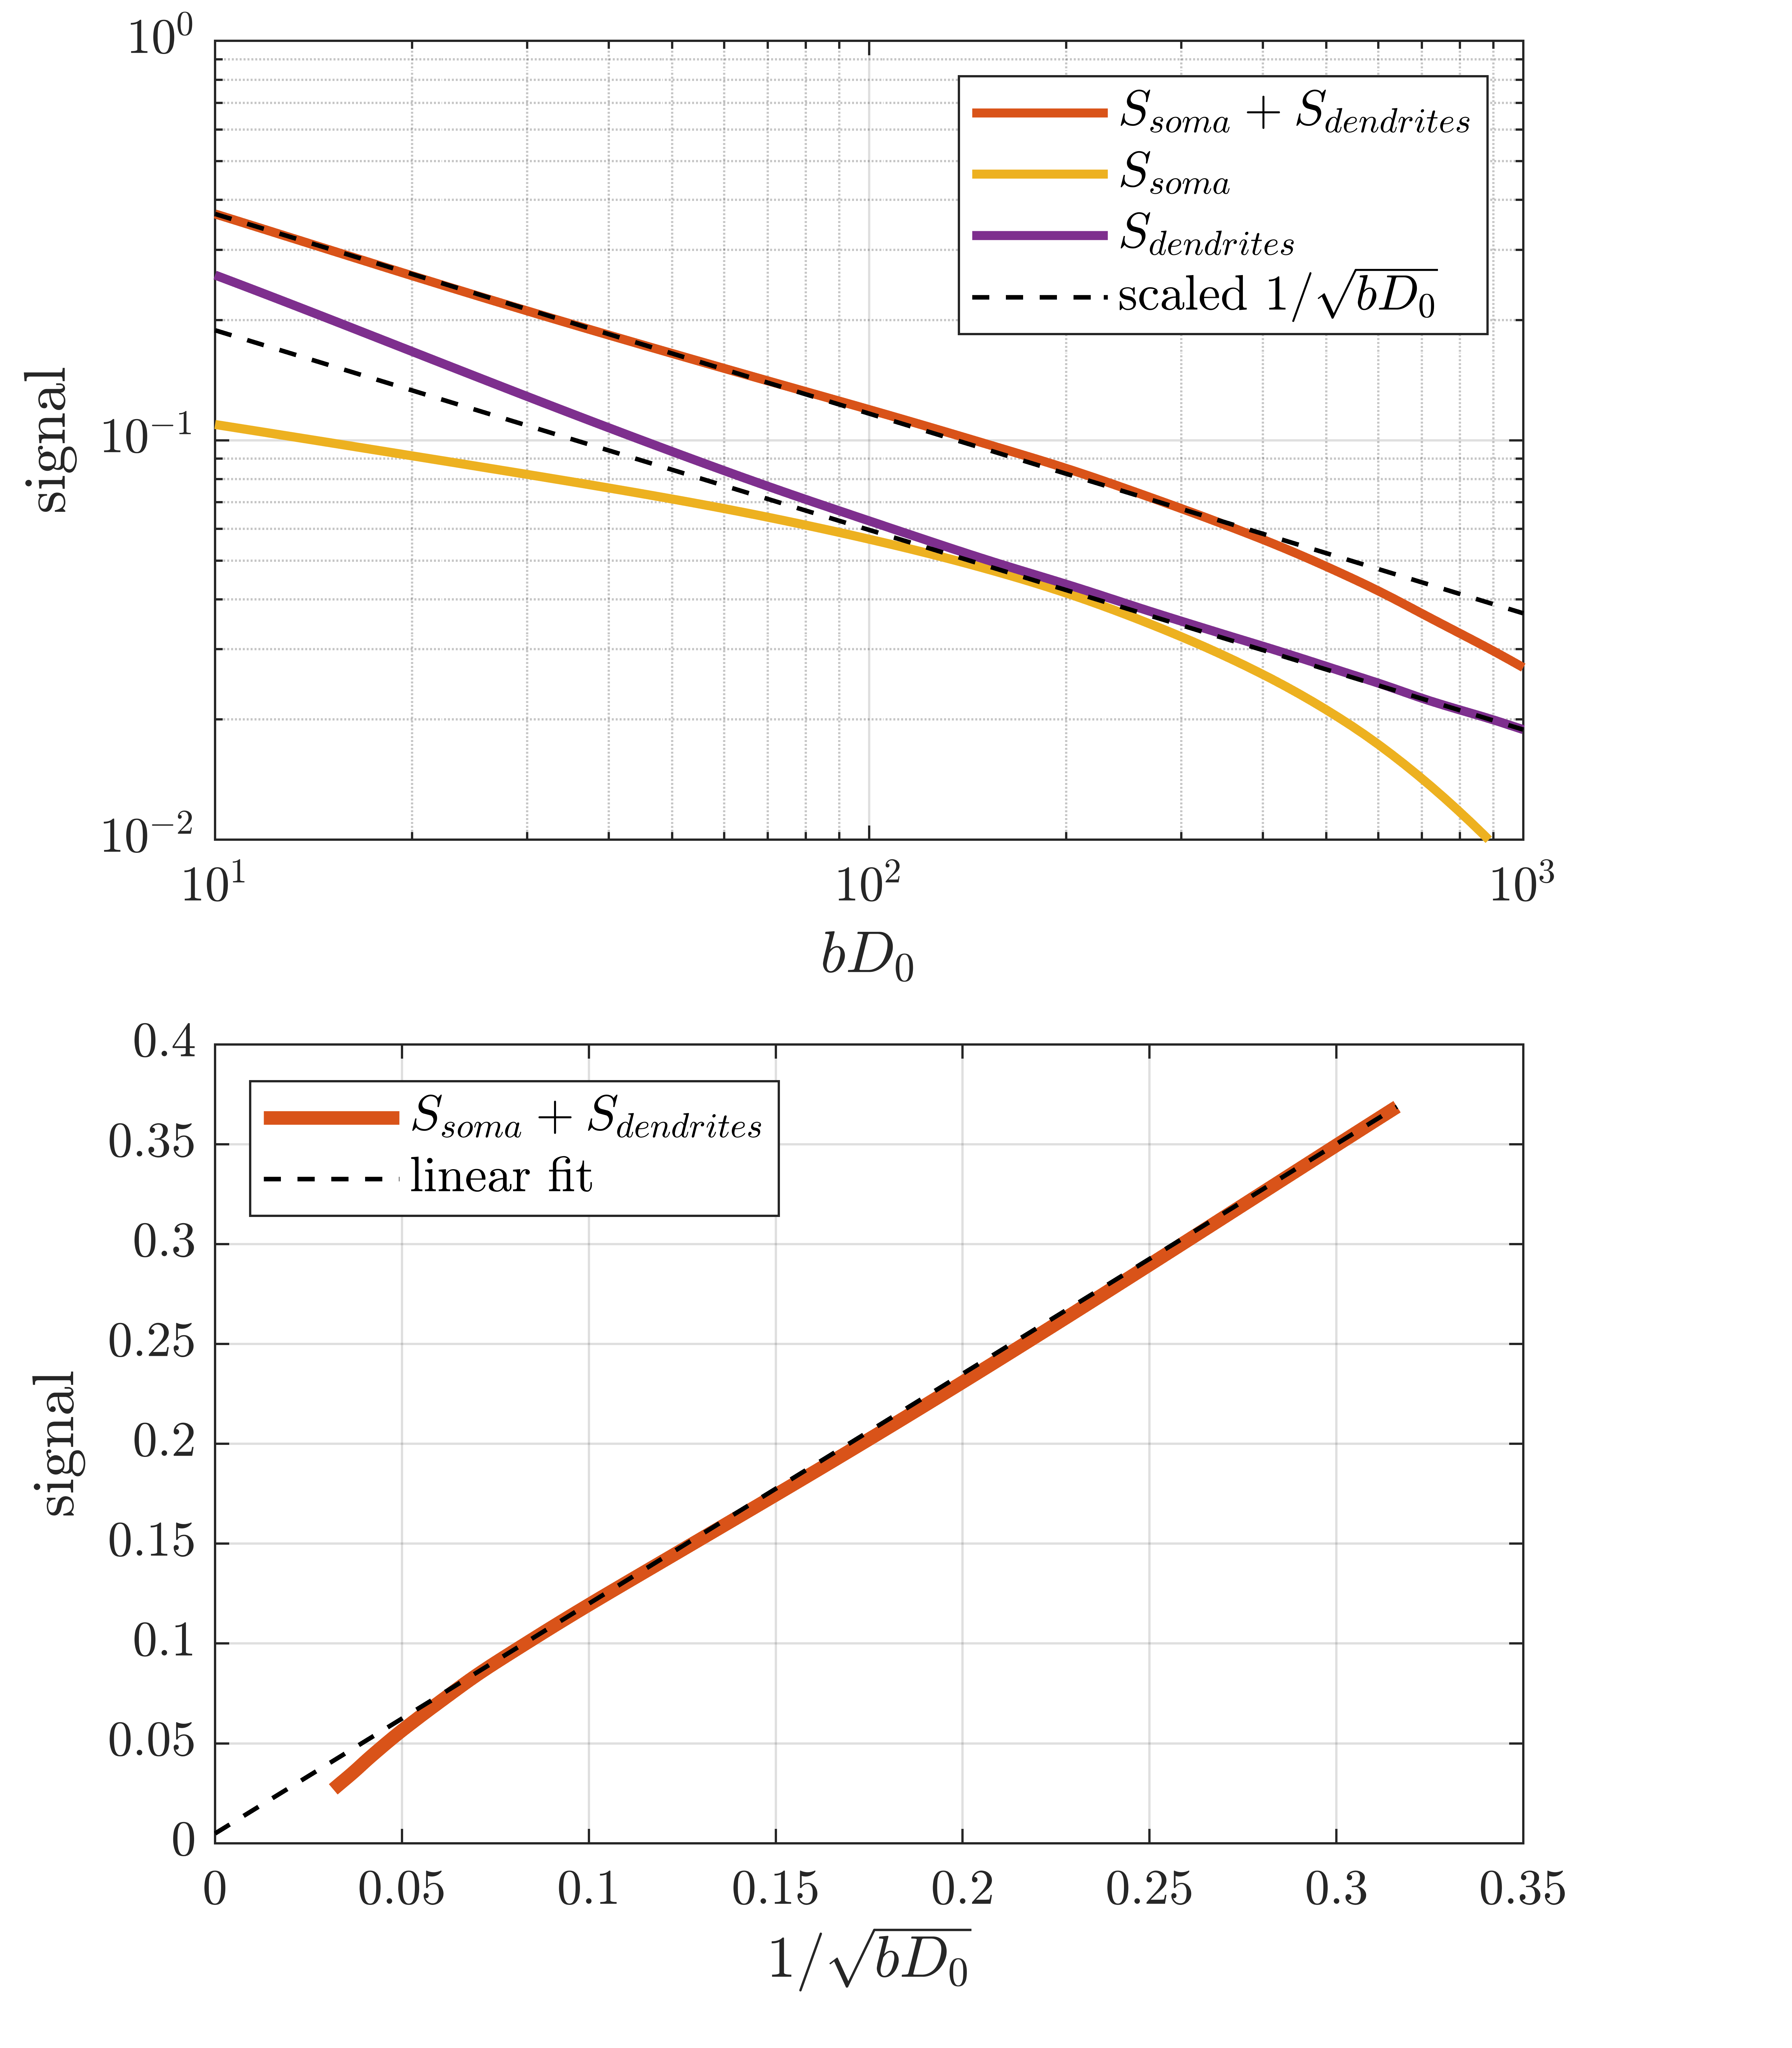
Figure 2 shows the signal as a function of diffusion weighting relative to the intrinsic diffusivity $$$bD_0$$$. This was set to the free diffusivity of water at body temperature (3 mum^2/ms12) but the results can be generalized to any diffusivity by modifying the sequence timings proportionally. Spheres with twice the soma diameters centred at each soma are used to divide the particles into approximate somatic and dendritic subpopulations whose signals can then be studied separately.Firstly, it is seen that the dendritic part of the signal agrees well with the stick power-law behaviour within range of practically relevant diffusion weightings ($$$bD_0$$$<100) even though exponential damping is clearly observed at extreme weightings. Staying within practical range, figure 3 shows the apparent exponent for different sequence timings which comes as close as $$$\sim$$$0.53 to the stick prediction of 0.5 for experimentally reasonable timings. This demonstrates that the stick power law is not broken by realistic undulations and branching.
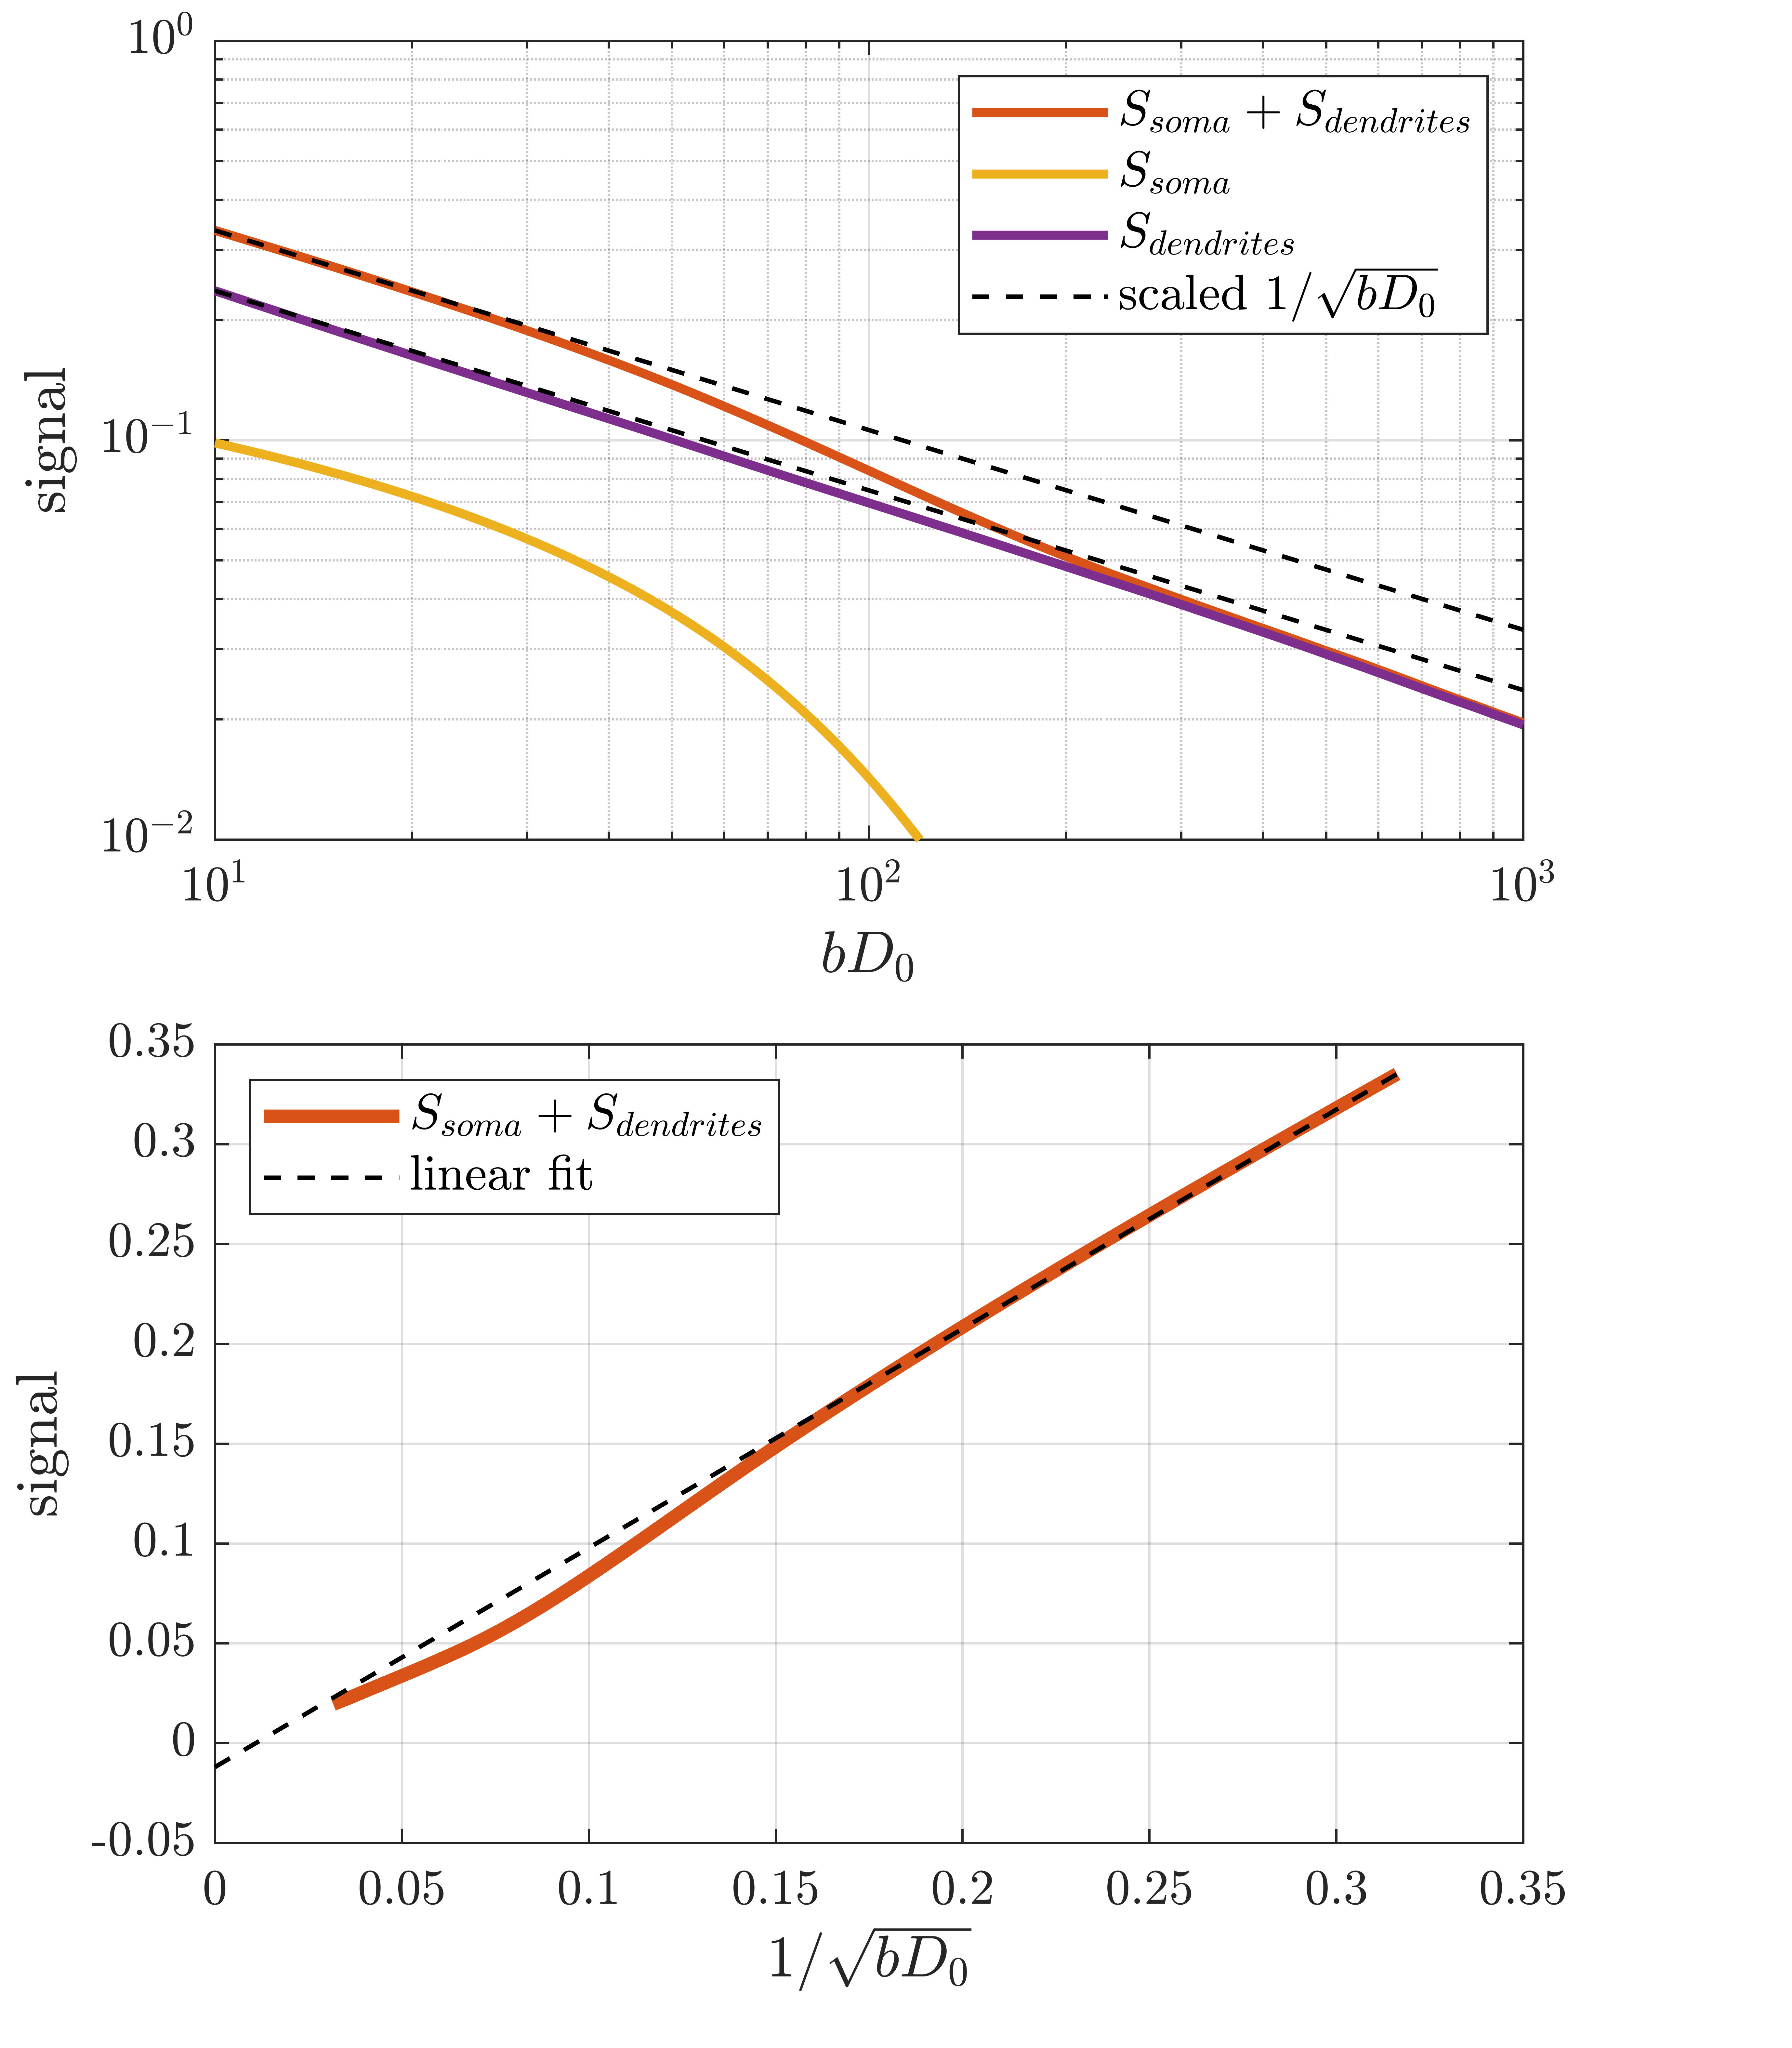
With increased sequence timing, the somatic contribution gains increased importance. Indeed, while the dendritic signal follows the power law, the full signal exhibits more complicated behaviour due to the somatic contribution. To recover the power law in the full signal, one must either use sufficient weighting to suppress the somas which is impractical because it requires very high weighting which in turn increases the power-law deviation of the dendritic signal. An interesting alternative appears for large pulse separations, an intermediate b-value range exists where the somatic signal changes slowly and effectively behaves as an immobile water fraction. As shown in fig. 4 and 5, it is conceivable that this might be exploited to recover the stick scaling at moderate diffusion weighting.
Conclusion
Using Monte Carlo simulations in pyramidal cells, we demonstrate that realistic branching and undulations do not break the stick power law scaling. The presence of soma on the other hand complicates the signal behaviour but it is possible that the power law can be recovered at an intermediate b-value range with appropriate sequence timings.Acknowledgements
No acknowledgement found.References
[1] C. D. Kroenke, J. J. H. Ackerman, and D. A. Yablonskiy, “On the nature of the NAA diffusion attenuated MR signal in the central nervous system,” Magn. Reson. Med., vol. 52, no. 5, pp. 1052–1059, Nov. 2004.
[2] S. N. Jespersen, C. D. Kroenke, L. Østergaard, J. J. H. Ackerman, and D. A. Yablonskiy, “Modeling dendrite density from magnetic resonance diffusion measurements,” Neuroimage, vol. 34, no. 4, pp. 1473–1486, 2007.
[3] D. S. Novikov, E. Fieremans, S. N. Jespersen, and V. G. Kiselev, “Quantifying brain microstructure with diffusion MRI: Theory and parameter estimation,” NMR Biomed., vol. 32, no. 4, p. e3998, Apr. 2019.
[4] E. Fieremans, J. H. Jensen, and J. A. Helpern, “White matter characterization with diffusional kurtosis imaging,” Neuroimage, vol. 58, no. 1, pp. 177–188, Sep. 2011.
[5] J. Veraart, E. Fieremans, and D. S. Novikov, “On the scaling behavior of water diffusion in human brain white matter,” Neuroimage, vol. 185, pp. 379–387, Jan. 2019.
[6] E. T. McKinnon, J. H. Jensen, G. R. Glenn, and J. A. Helpern, “Dependence on b-value of the direction-averaged diffusion-weighted imaging signal in brain,” Magn. Reson. Imaging, vol. 36, pp. 121–127, Feb. 2017.
[7] E. Özarslan, C. Yolcu, M. Herberthson, H. Knutsson, and C.-F. Westin, “Influence of the Size and Curvedness of Neural Projections on the Orientationally Averaged Diffusion MR Signal,” Front. Phys., vol. 6, Mar. 2018.
[8] N. Gilani, S. Hildebrand, A. Schueth, and A. Roebroeck, “Monte Carlo Simulation of Diffusion MRI in geometries constructed from two-photon microscopy of human cortical grey matter,” bioRxiv, p. 626945, Jul. 2019.
[9] G. A. Ascoli, D. E. Donohue, and M. Halavi, “NeuroMorpho.Org: A central resource for neuronal morphologies,” Journal of Neuroscience, vol. 27, no. 35. pp. 9247–9251, 29-Aug-2007.
[10] C. Koch and A. Jones, “Big Science, Team Science, and Open Science for Neuroscience,” Neuron, vol. 92, no. 3. Cell Press, pp. 612–616, 02-Nov-2016.
[11] H. Cuntz, F. Forstner, A. Borst, and M. Häusser, “One Rule to Grow Them All: A General Theory of Neuronal Branching and Its Practical Application,” PLoS Comput. Biol., vol. 6, no. 8, p. e1000877, Aug. 2010.
[12] M. Holz, S. R. Heil, and A. Sacco, “Temperature-dependent self-diffusion coefficients of water and six selected molecular liquids for calibration in accurate 1H NMR PFG measurements,” Phys. Chem. Chem. Phys., vol. 2, no. 20, pp. 4740–4742, Jan. 2000.
Figures